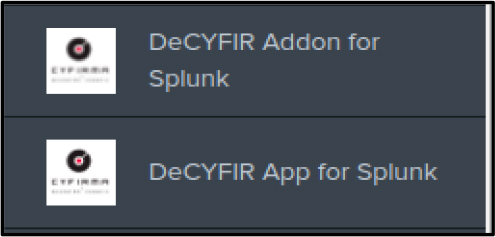
DeCYFIR is cloud-based threat discovery and cybersecurity platform, designed to defend organizations by uncovering attack surfaces, building digital risk profiles & using personalized cyber-intelligence to predict imminent attacks and decode cyber threats before a cyberattack hits.
The Splunk add-on will help to collect DeCYFIR alert events data using the events API and send it to Splunk events. It will also ingest DeCYFIR IOC data as lookup data in Splunk Enterprise.
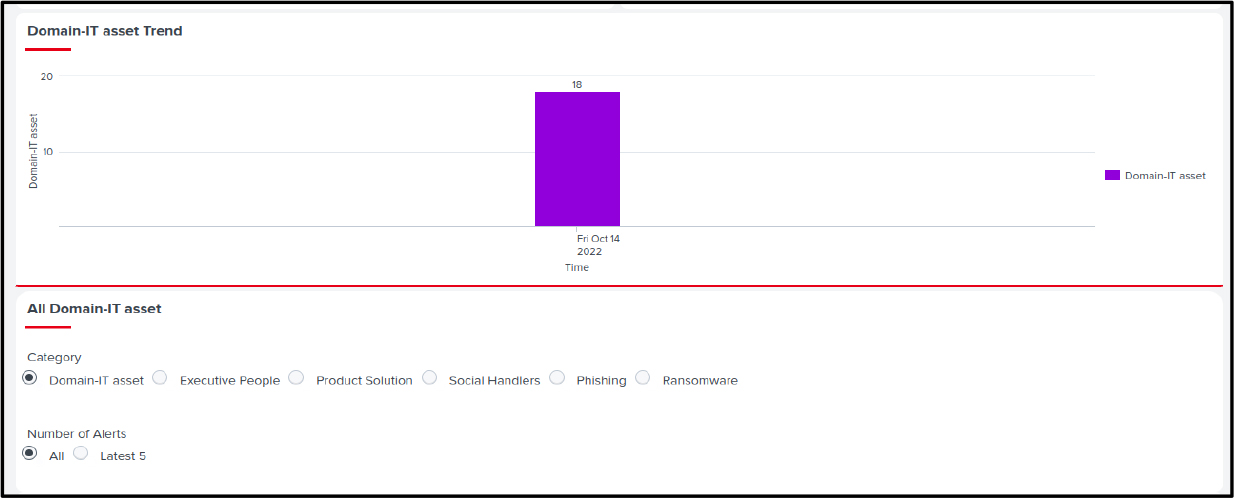
The Splunk app will have searches based on Alerts & IOC data. Dashboards are created based on Splunk searches.
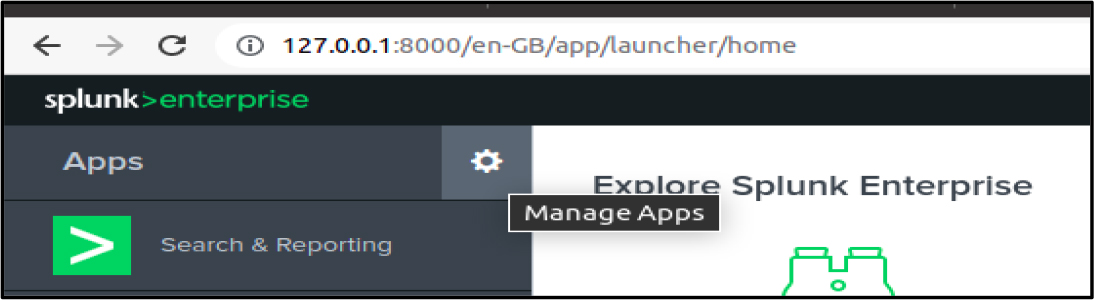
To install Splunk Enterprise. Follow this manual Splunk Installation Manual.
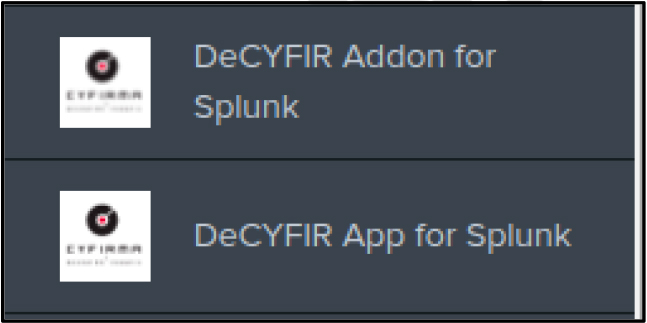
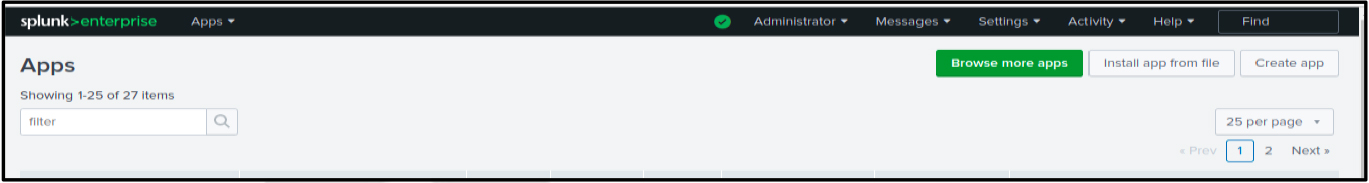
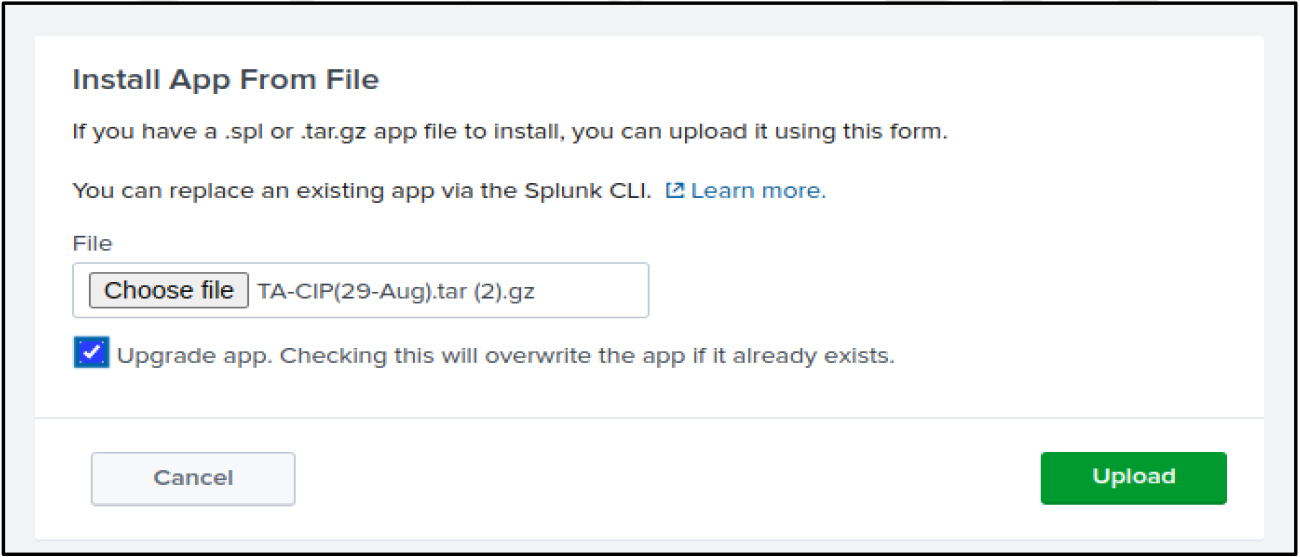
After installation, we can see the Add-on in Apps dropdown.
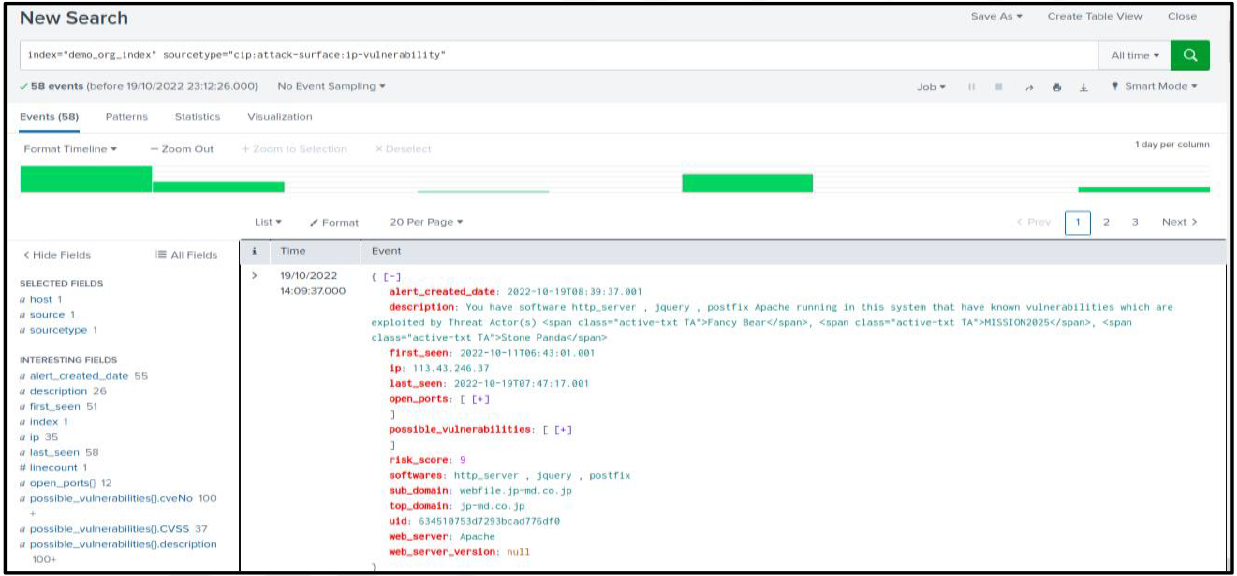
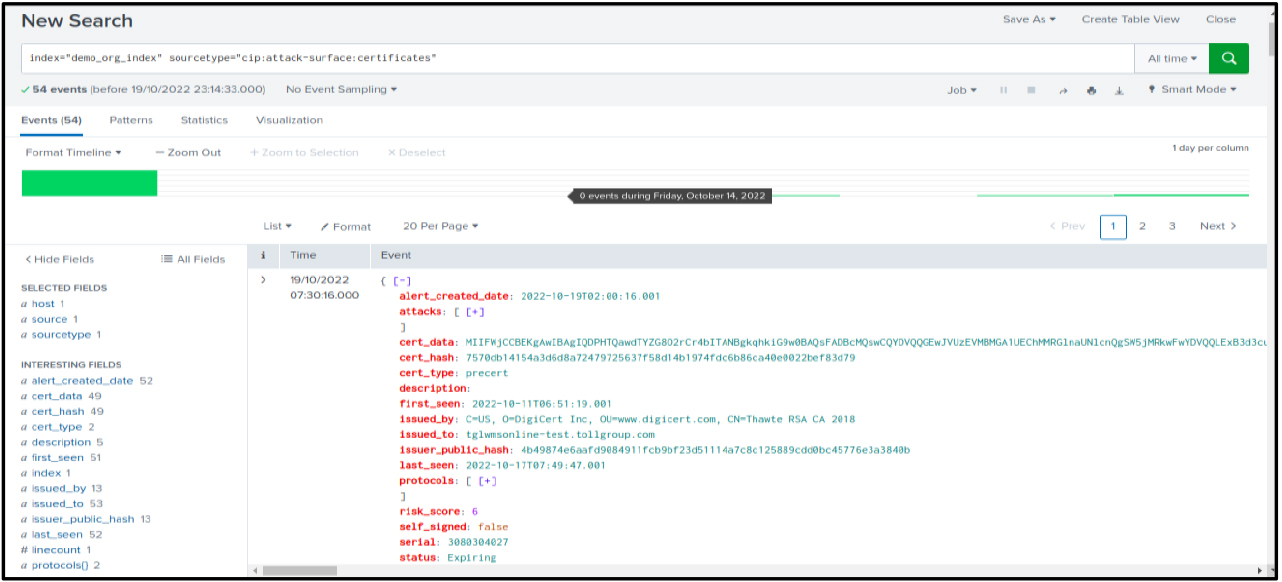
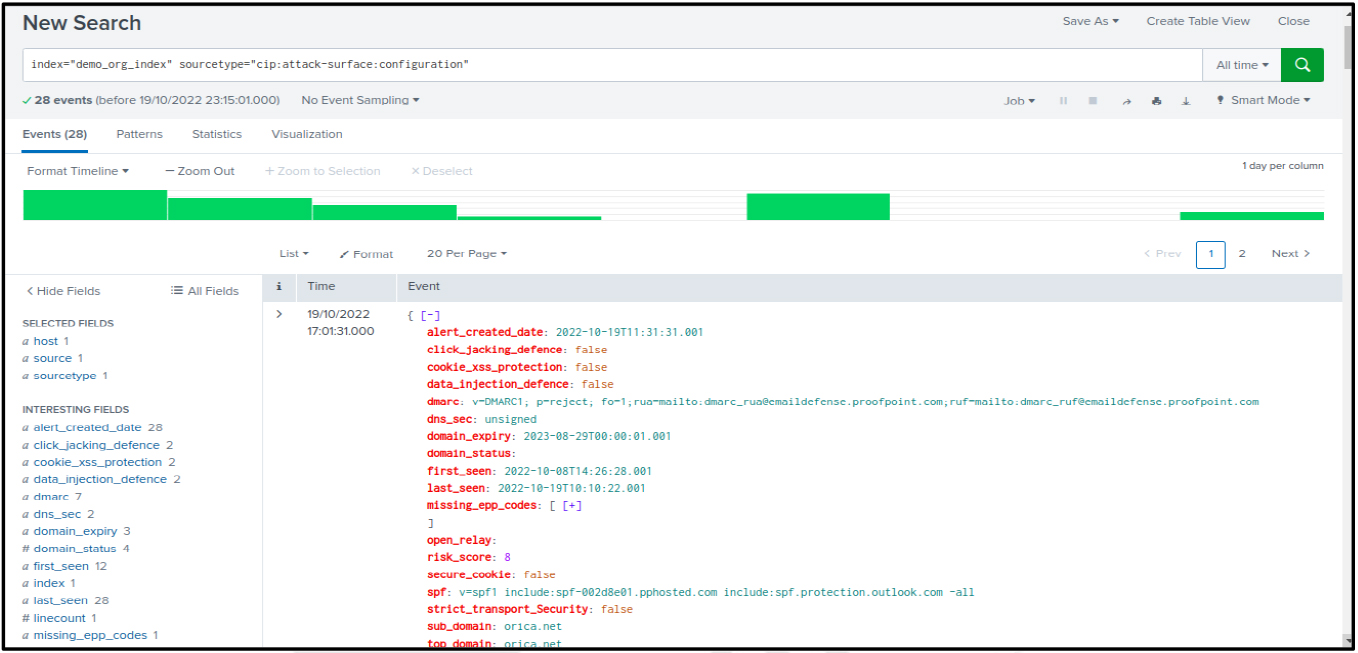
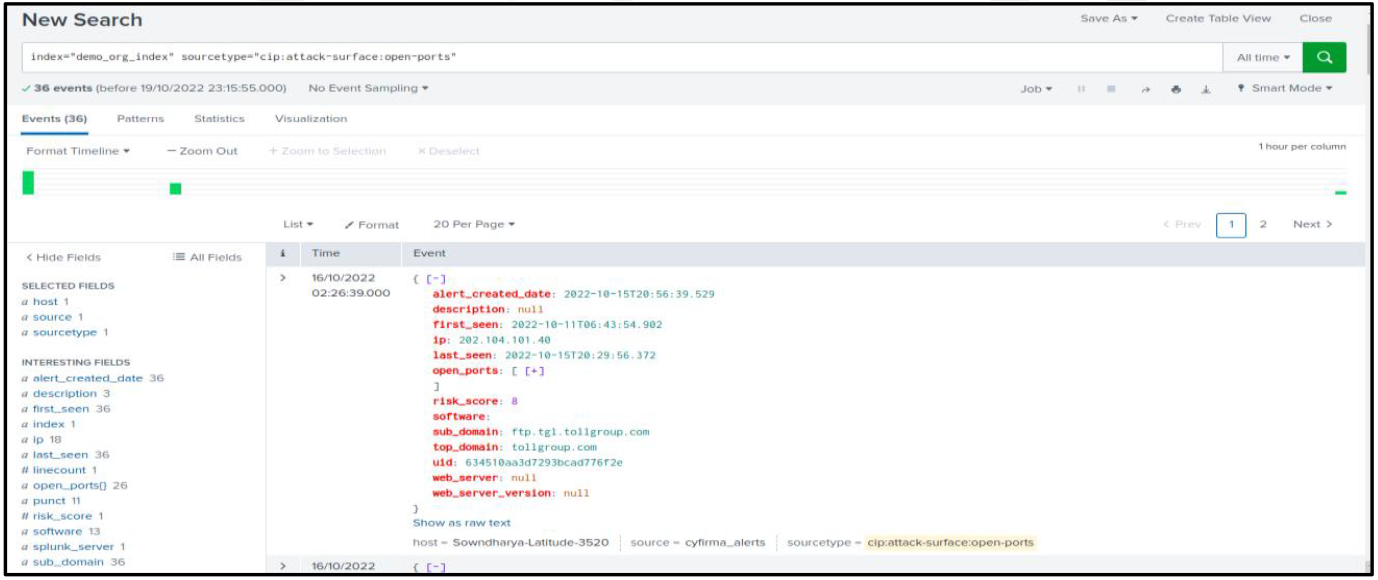
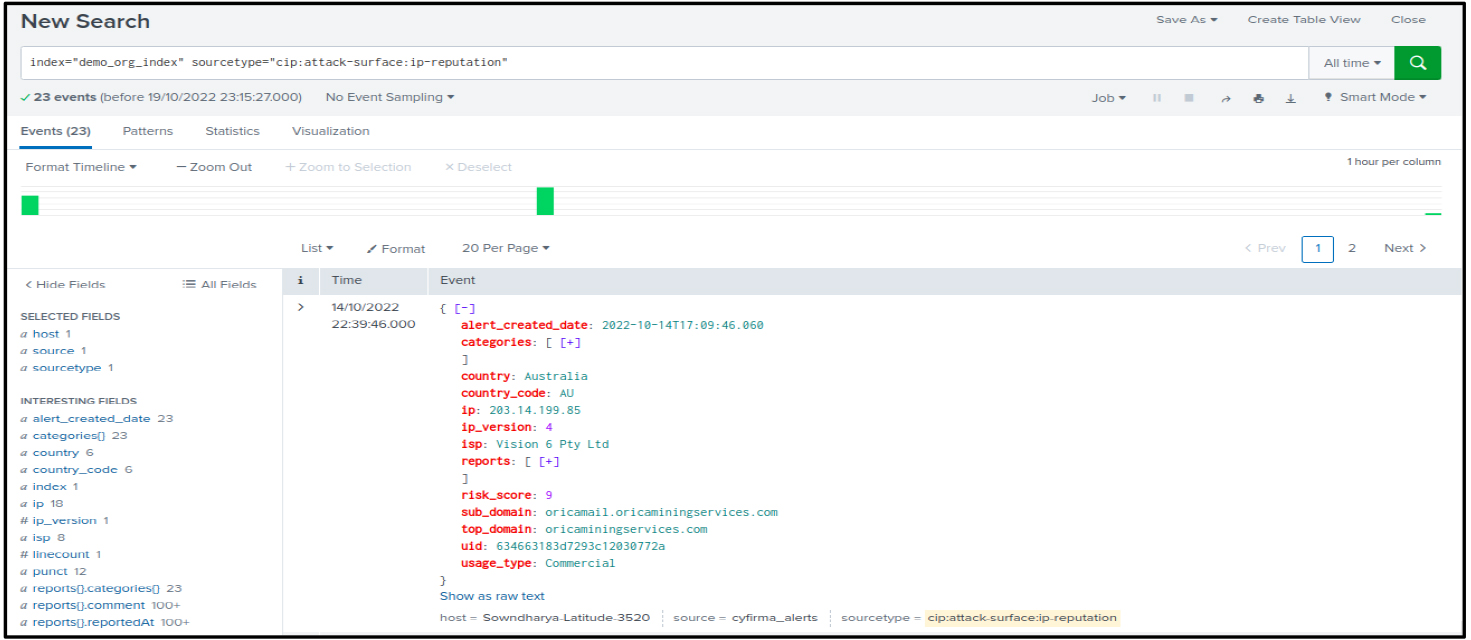
at the defined interval to fetch the CYFIRMA’s Attack Surface sub-categories data and ingest into Splunk indexes with sourcetype set as “cip:attack_surface:<sub category>”
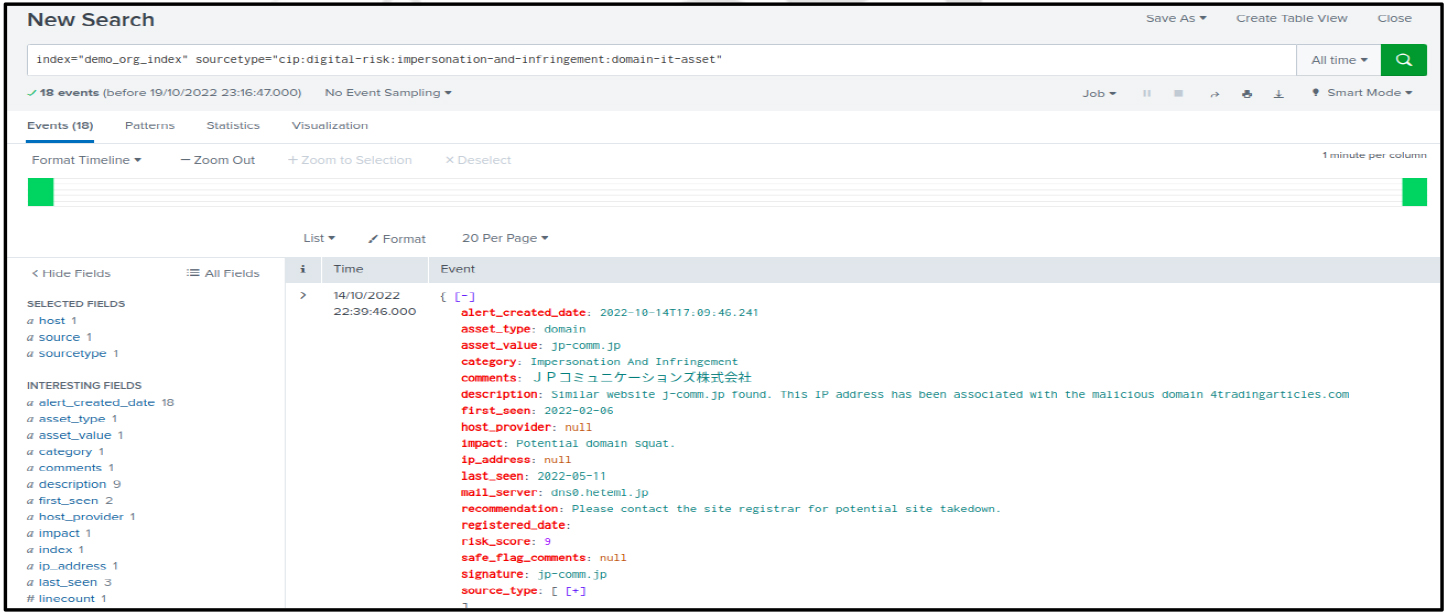
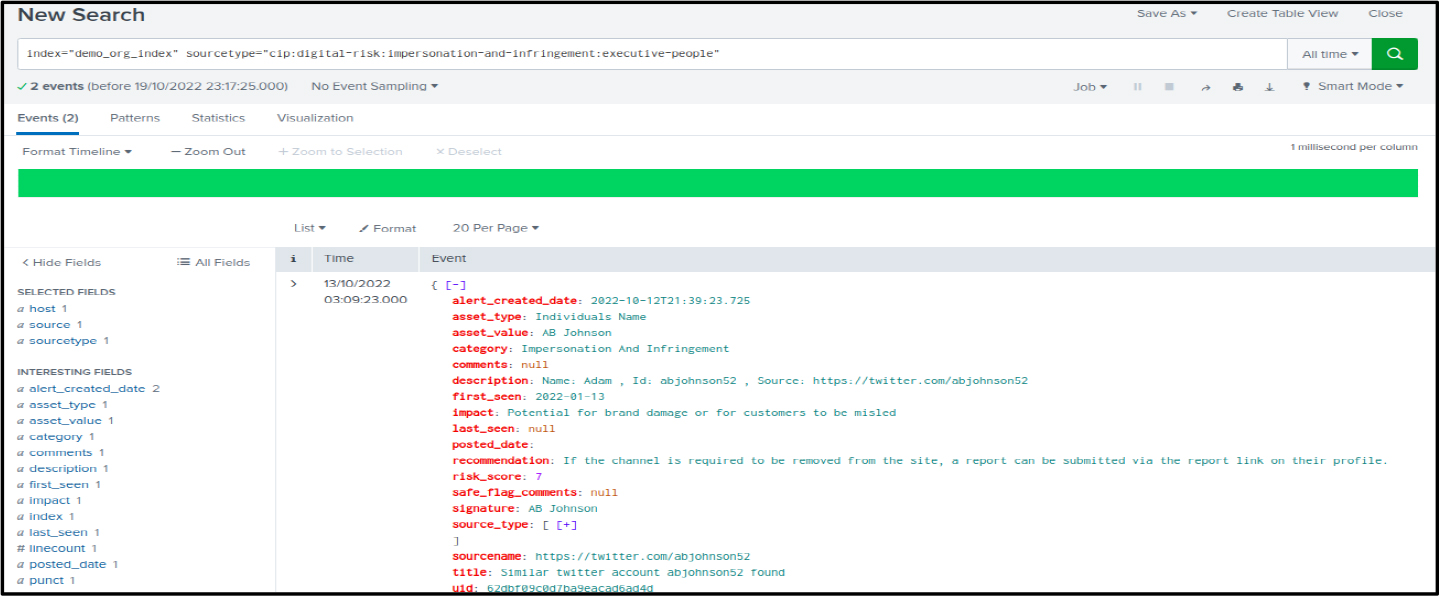
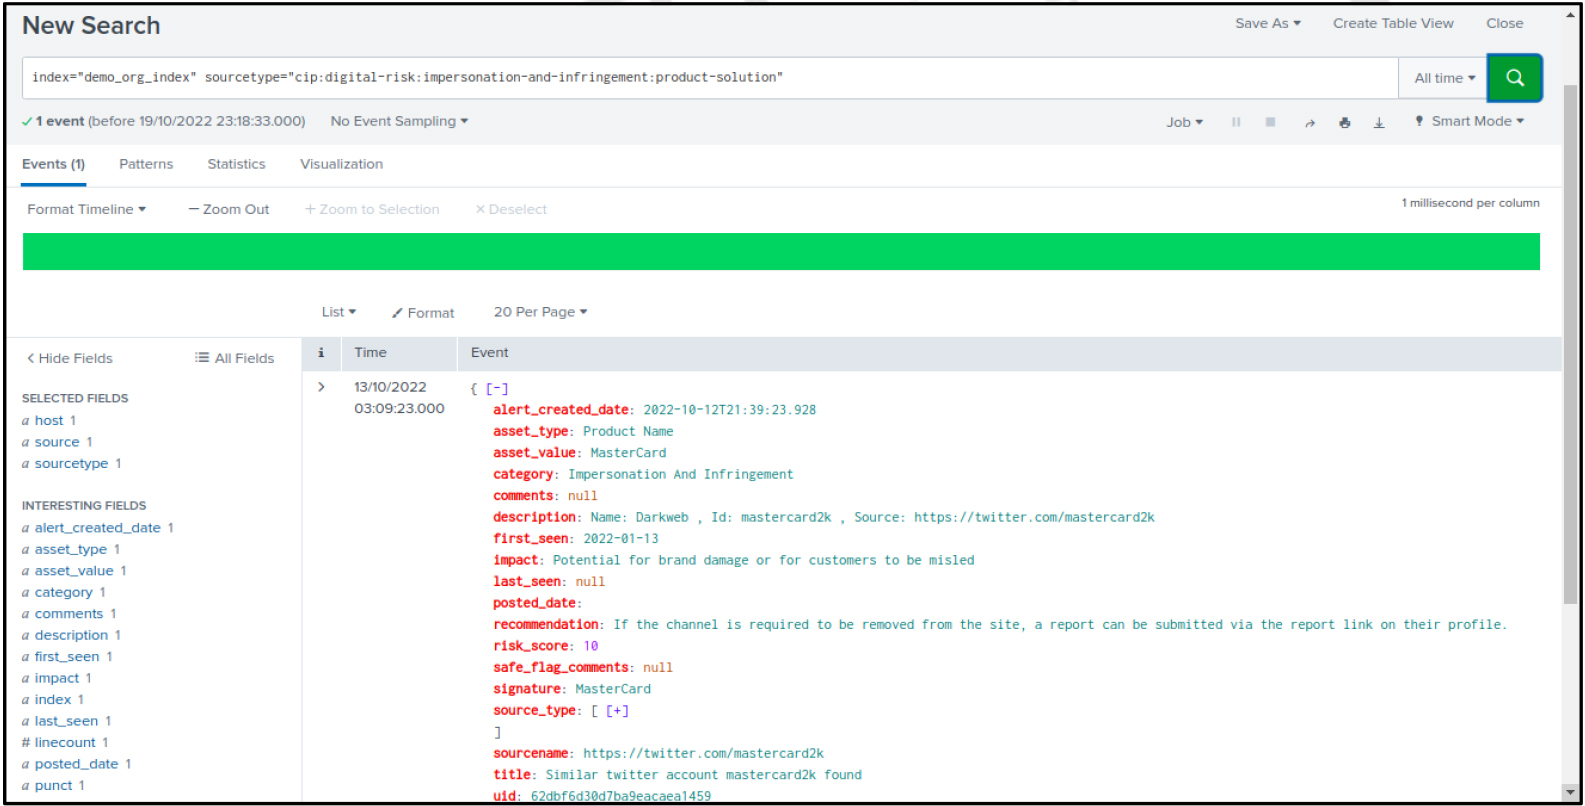
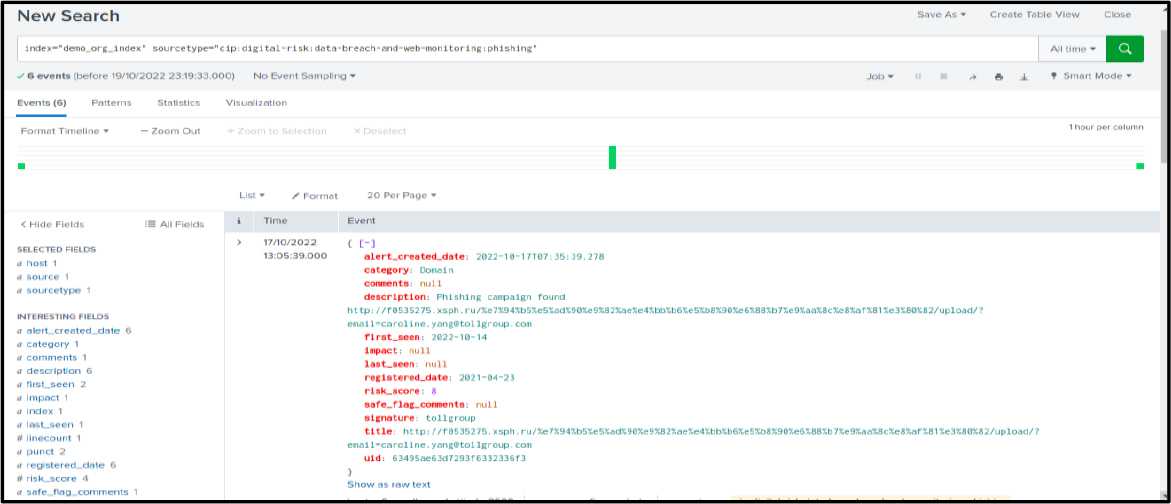
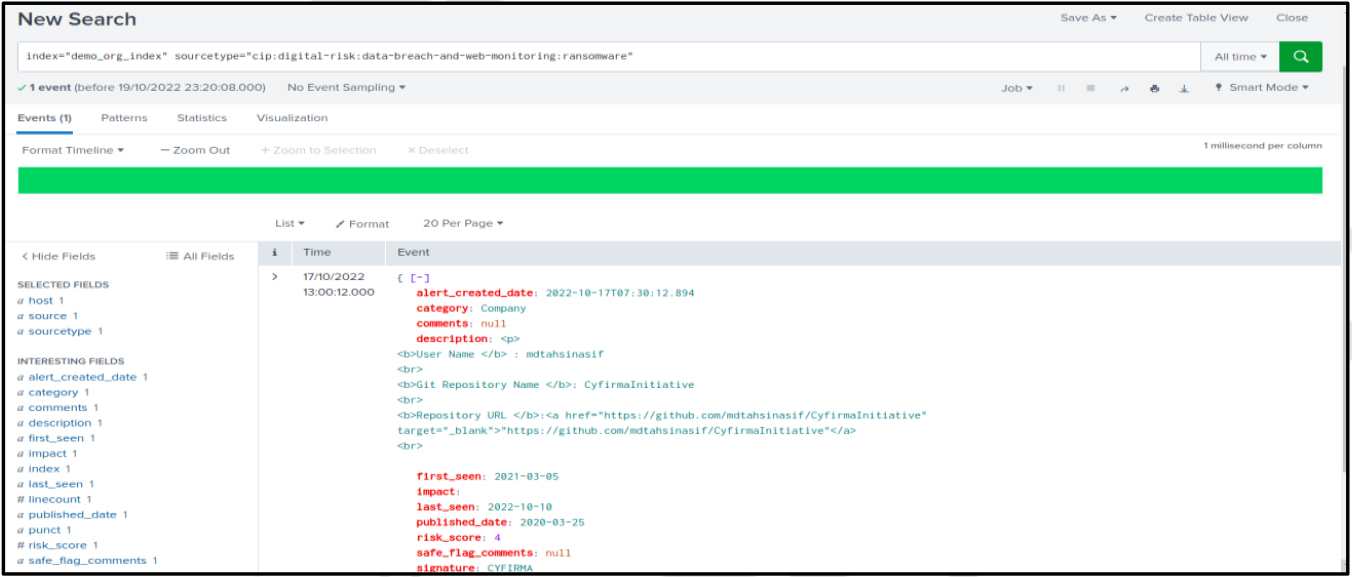
at the defined interval to fetch the CYFIRMA’s Digital Risk sub-categories data and ingest into Splunk indexes with sourcetype set as “cip:digital_risk:<sub category>”
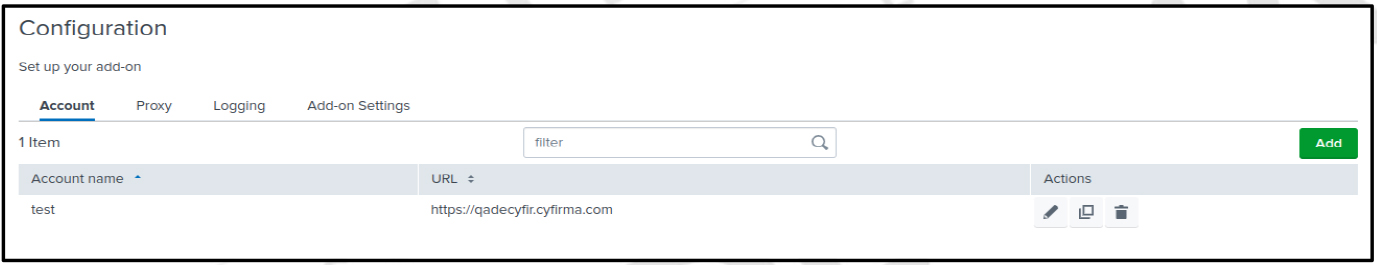
Account
After installation of the DeCYFIR Addon to set up the account follow the below steps
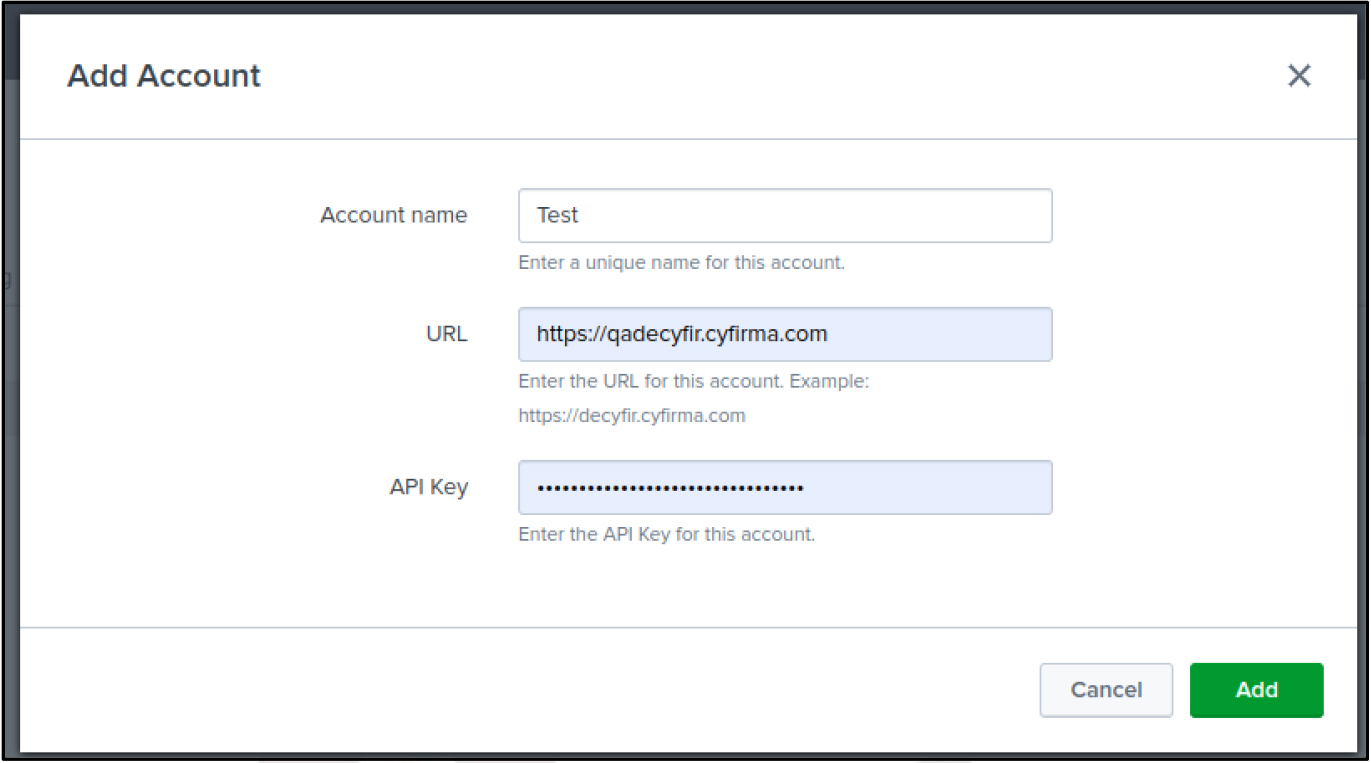
Account should be created successfully.
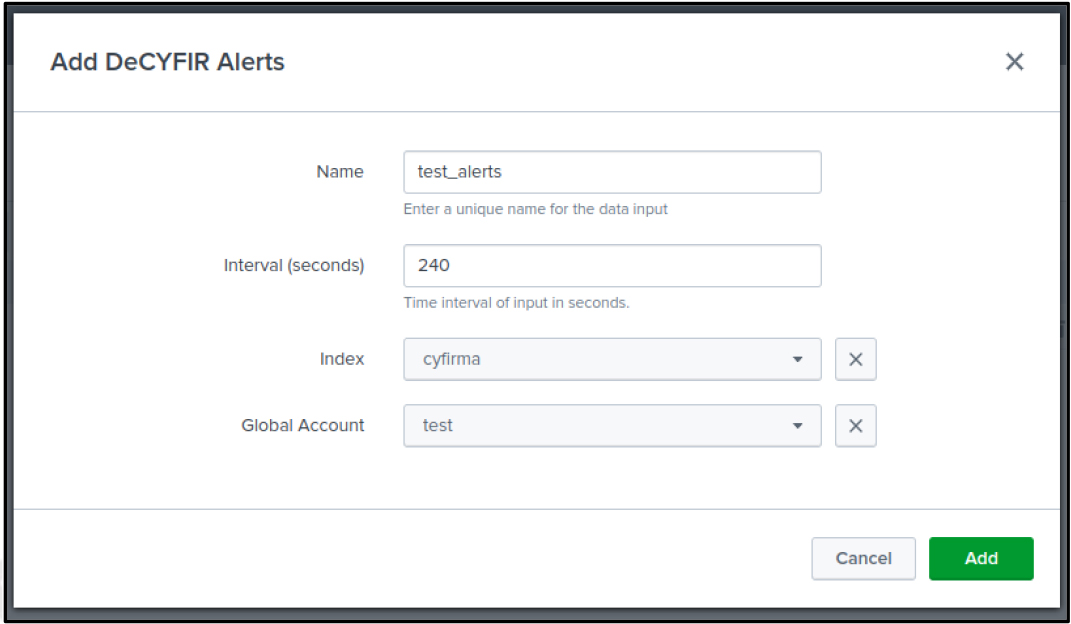
Prerequisites
Users are advised to create a separate index for storing the data before creating the Alerts input. Please create a different index for all clients and select the corresponding index while creating the input for specific clients. For example, create an index named “cyfirma” and select the same index while creating the DeCYFIR Alerts input.
Creating Index
For creating indexes for DeCYFIR Alerts,
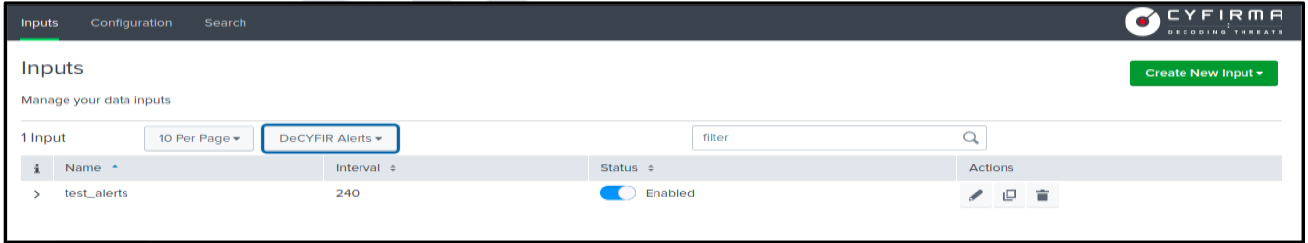
DeCYFIR Alerts
For creating input and data collection of API data, follow the below-mentioned steps in DeCYFIR Add-on.
CYFIRMA’s Attack Surface subcategories
CYFIRMA Digital Risk Subcategories
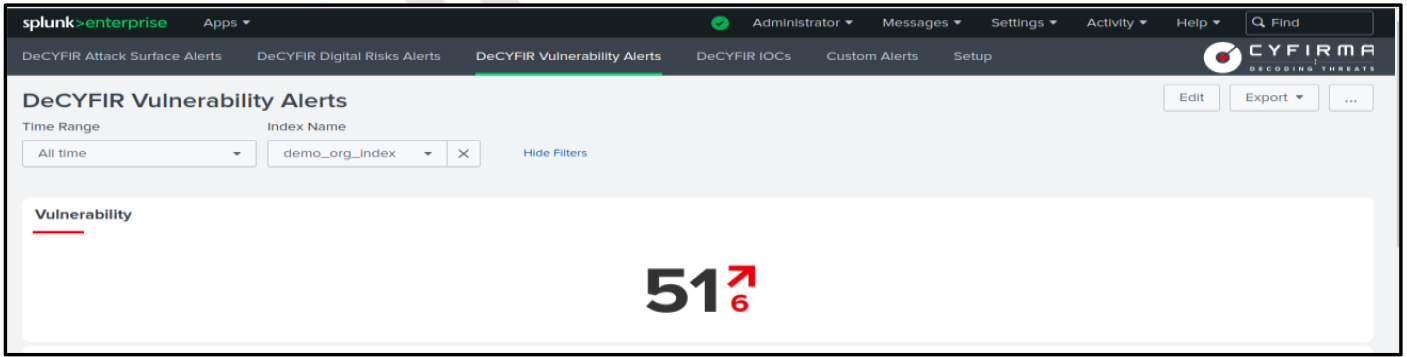
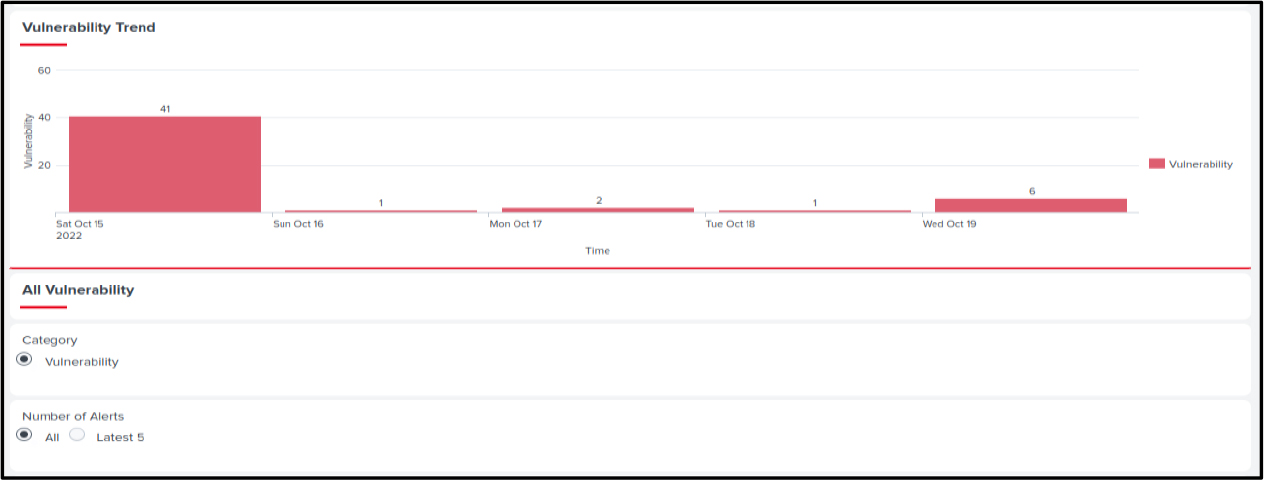
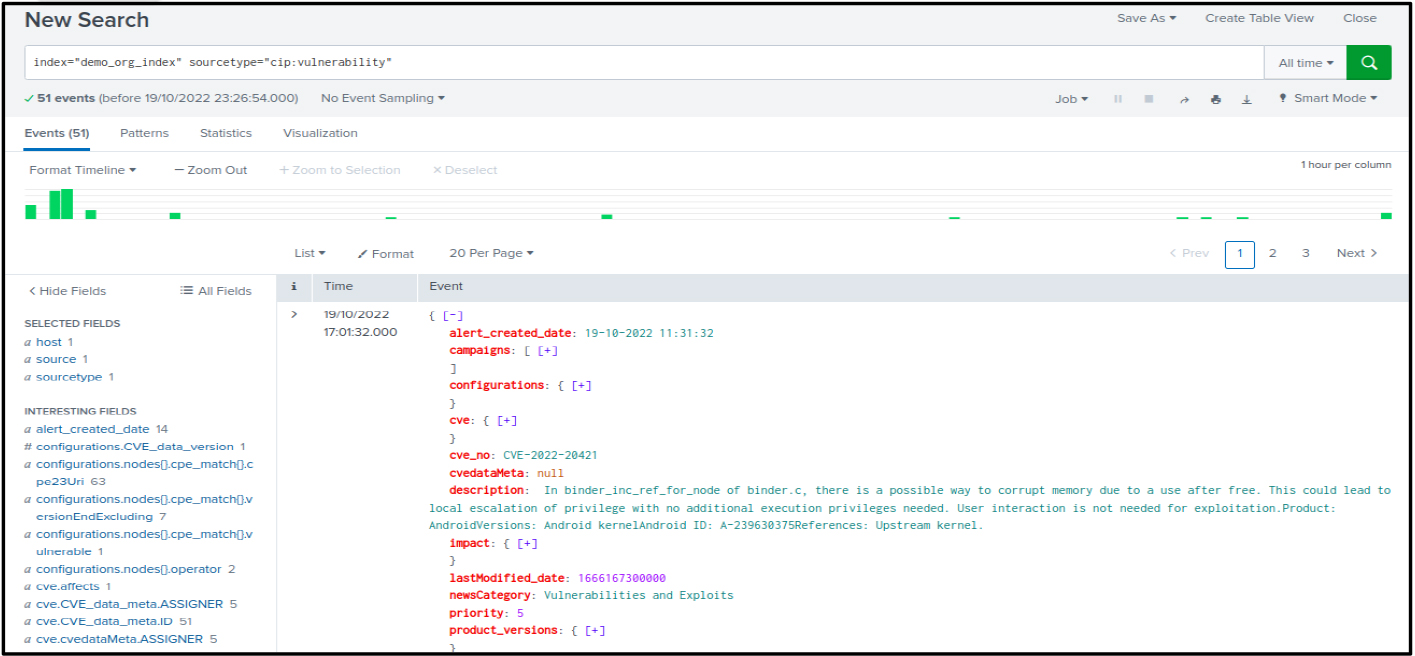
CYFIRMA Vulnerability category
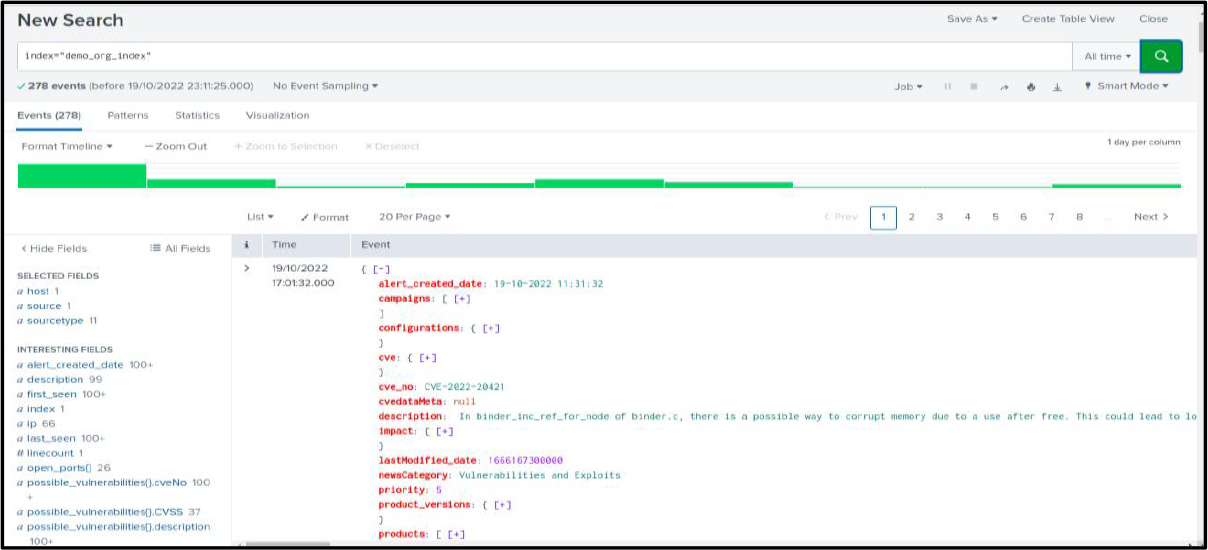
Vulnerability
Eg: index=”cyfirma” sourcetype=”cip:vulnerability”
Dashboard
App will contain a Dashboard tab that fetches data of Attack Surface, Digital Risk, and Vulnerability from the Splunk index.
Splunk app to display Dashboard. It would include the following 6 tabs:
Note: The Decyfir app must be fully configured by logging to the setup page and providing credentials for the Cyfirma product URL and API key.
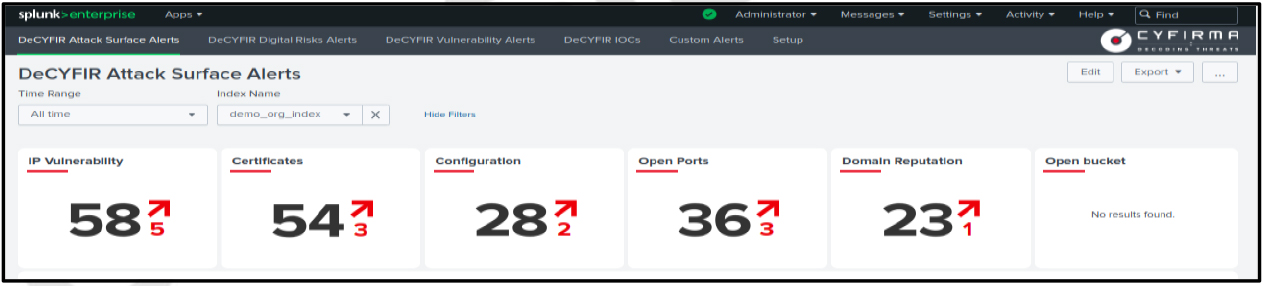
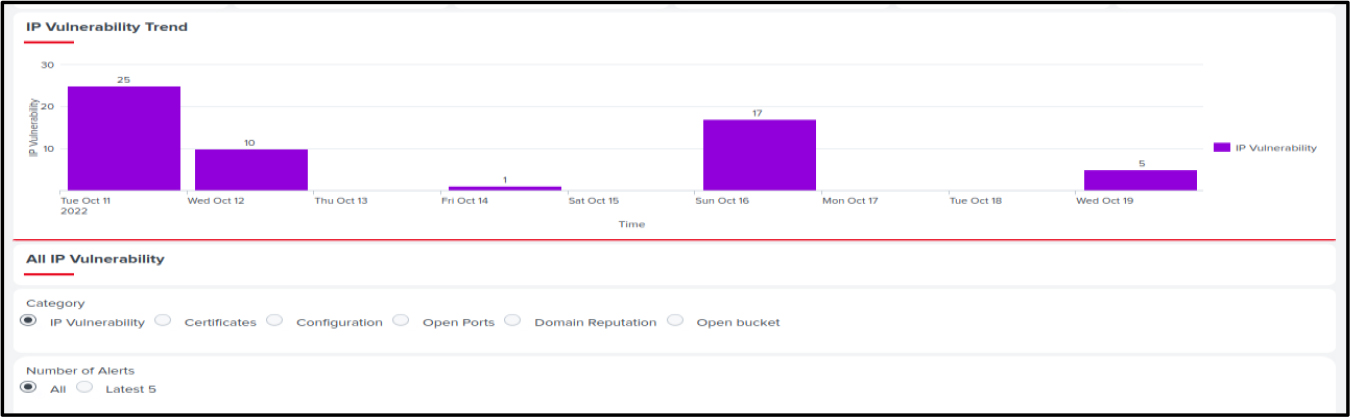
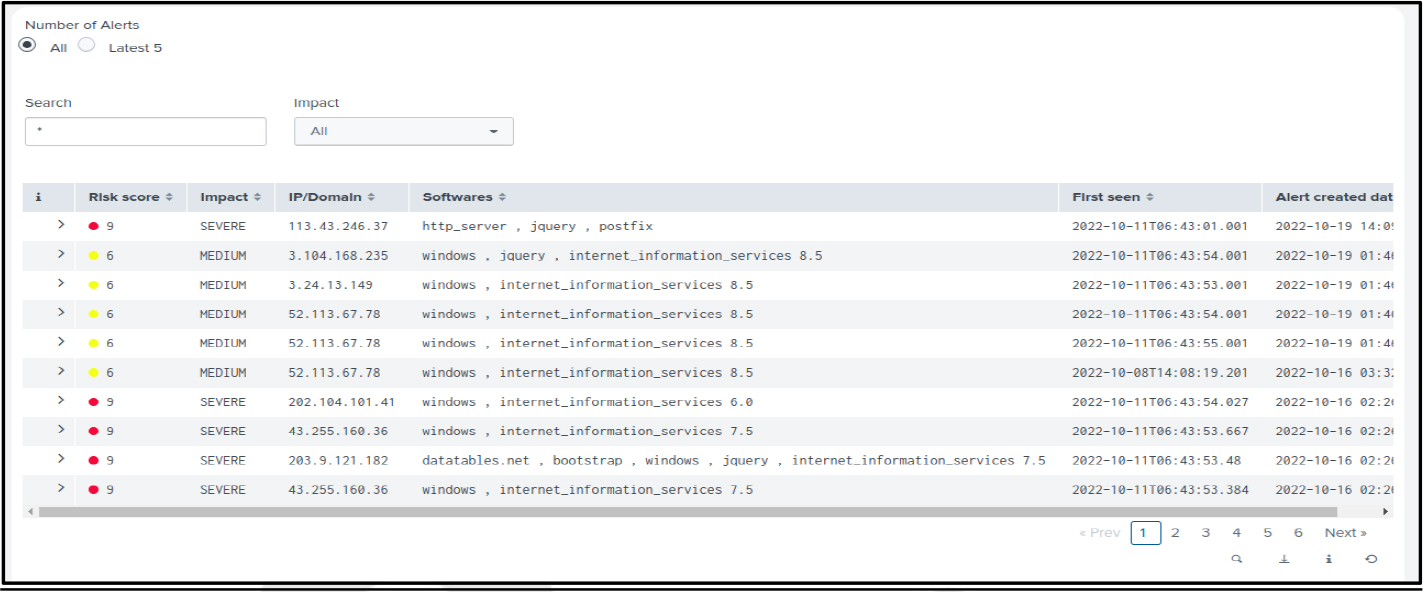
DeCYFIR Attack Surface Alerts:
Widgets to display:
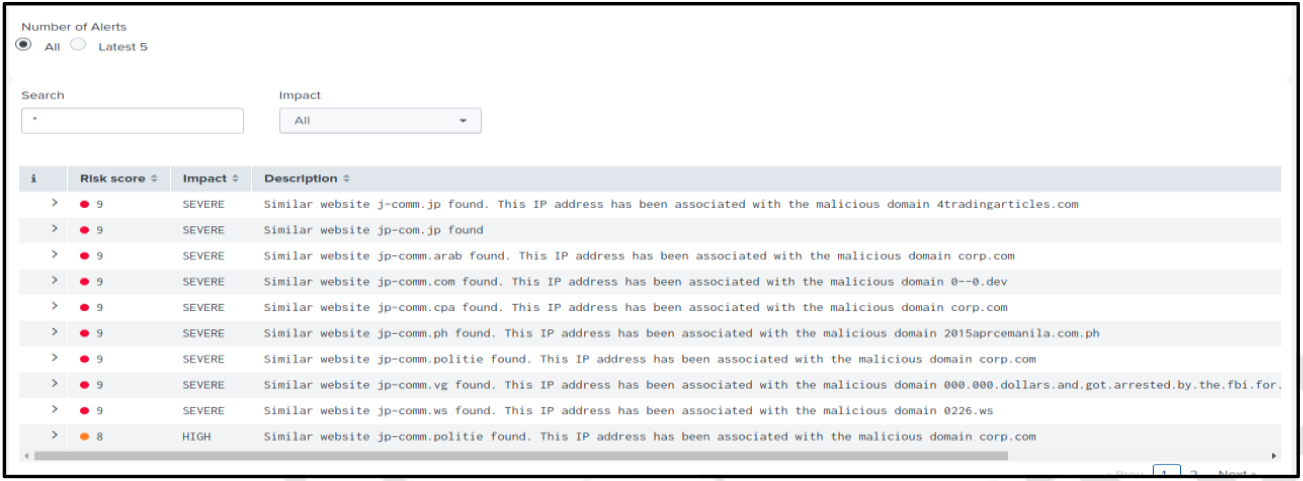
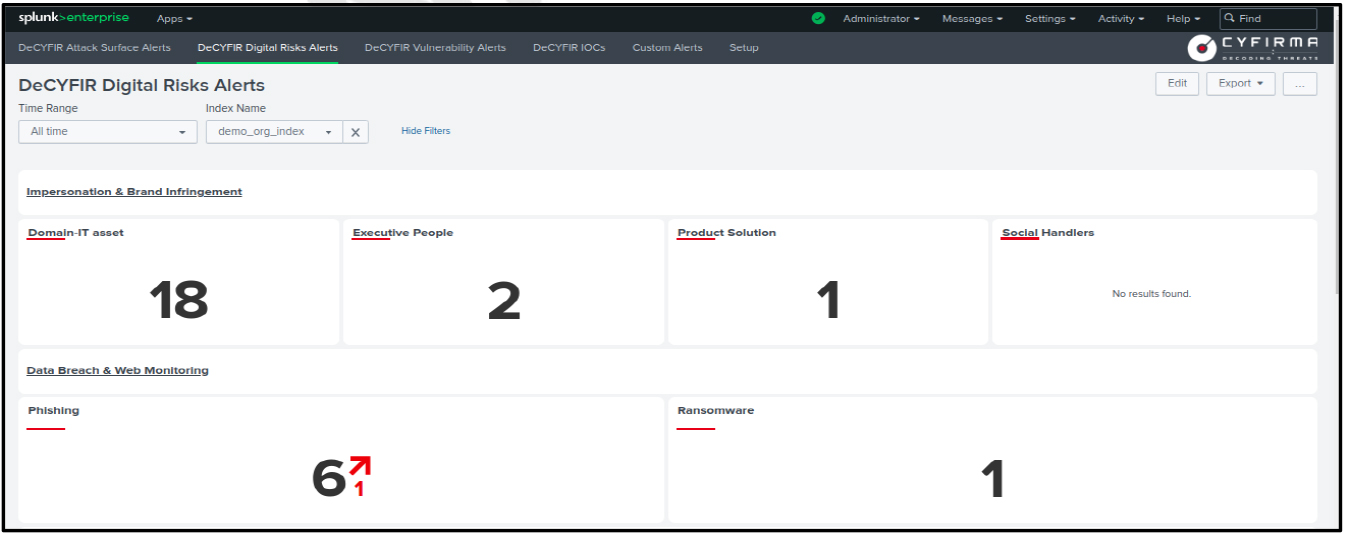
DeCYFIR Digital Risk Alerts:
Widgets to display:
DeCYFIR Vulnerability Alerts:
Widgets to display: