

REAL ESTATE & CONSTRUCTION
CATEGORIES RISK MOVERS
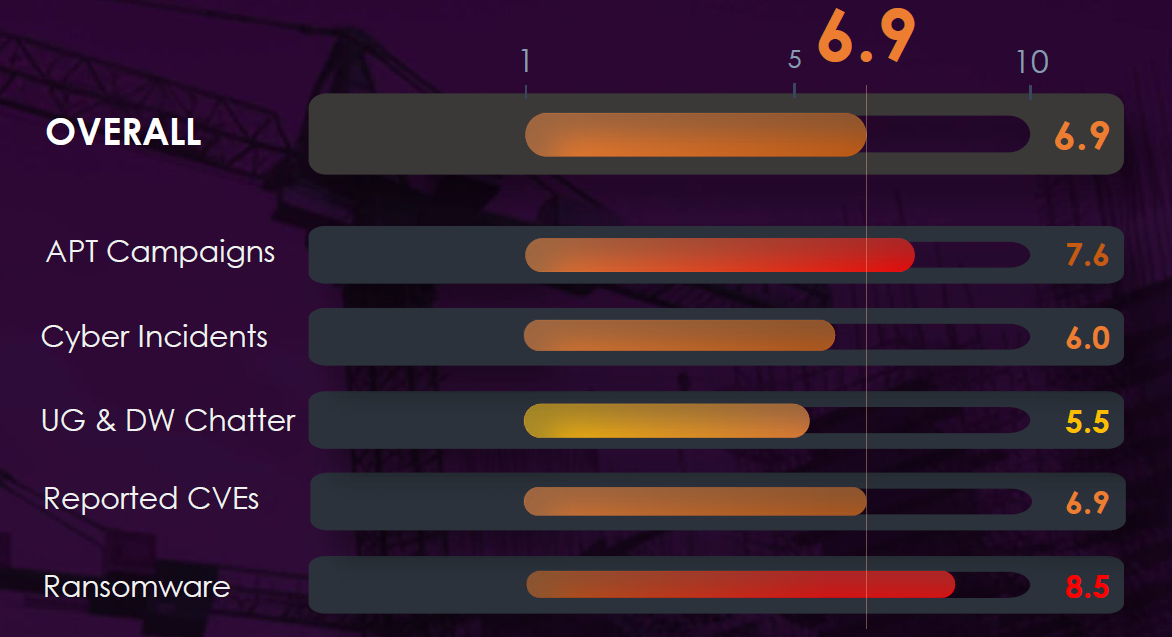
APT Campaigns – 7.6
37 of 114 campaign updates (32%), up from 5 of 32, with share doubling from 16%. The only sector in this series where absolute presence and share rose together, indicating deliberate selection rather than scaling with the pool. Leviathan ranked second, its engineering and infrastructure focus the clearest sector-specific signal. RDP ranked third among targeted technologies.
Cyber Incidents – 6.0
The least-reported sector in the dataset, reflecting what public reporting covers rather than exposure. Neither recorded incident hit a property or construction firm directly. Romania’s land registry disruption showed the sector’s dependency on government systems it does not control. Payment redirection against progress claims and deposit transfers is the dominant financial threat.
Dark Web Chatter – 5.5
609 mentions, 13th of 14 at 1.36%, one of the few sectors where volume declined. The only sector where ransomware exceeds data breach discussion, consistent with disruption rather than disclosure being the effective leverage against fixed project schedules. Ransomware chatter eased in the final period, tracking the September victim slowdown.
Vulnerabilities – 6.9
328 mentions, 7th of 14 at 4.23%, dominated almost entirely by remote code execution against internet-facing project platforms and building management interfaces. That is a standard ransomware initial access route and connects directly to the victim surge. Lean IT and systems that cannot be taken offline make exposure duration the material risk.
Ransomware – 8.5
290 victims, up 42.9% Q-on-Q, the largest increase of any sector this period, with share rising to 10.62% and coverage widening from 39 to 45 countries. The surge is concentrated in two escalating actors rather than broad participation, pointing to a scalable access route. Specialty Trade Contractors led victims at roughly a quarter of the total.
EXECUTIVE SUMMARY
The CYFIRMA Industry Report delivers original cybersecurity insights and telemetry-driven statistics of global industries, covering one sector each week for a quarter. This report focuses on the real estate & construction sector, presenting key trends and statistics in an engaging infographic format.
INTRODUCTION
Welcome to the CYFIRMA infographic industry report, where we delve into the external threat landscape of the real estate & construction industry over the past three months. This report provides valuable insights and data-driven statistics, delivering a concise analysis of attack campaigns, public reports, underground & dark web chatter, vulnerabilities, and ransomware incidents targeting real estate & construction organizations.
We aim to present an industry-specific overview in a convenient, engaging, and informative format. Leveraging our cutting-edge platform telemetry and the expertise of our analysts, we bring you actionable intelligence to stay ahead in the cybersecurity landscape.
METHODOLOGY
UNDERGROUND & DARK WEB CHATTER
VULNERABILITIES
RANSOMWARE
While this report contains data collected and processed by our in-house AI and ML, all charts, statistics, and analyses are done by human CYFIRMA CTI analysts to ensure the highest quality and provide accurate insights.
ADVANCED PERSISTENT THREAT ATTACK CAMPAIGNS
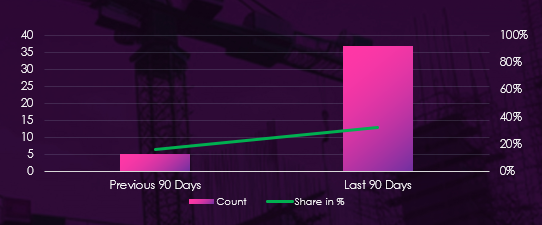
Real estate & construction organizations were featured in 37 of the 114 campaign activity updates, which is a presence in 32% of all activity, a significant jump from the previous period, when this sector was present in 5 out of 32 campaigns. This is an increase in presence to 16% of observed activity.
OBSERVED CAMPAIGNS PER MONTH
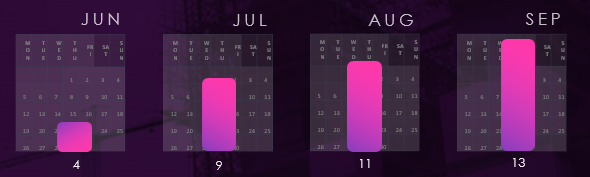
APT activity targeting real estate & construction has been continuous across the period, with recorded counts rising from June through September. Note that campaign activity updates accumulate over time, so campaigns detected earlier continue to generate updates in later months. This skews recorded counts toward the most recent months, and the monthly figures should be read as a floor for earlier periods rather than a direct measure of when activity began.
SUSPECTED THREAT ACTORS
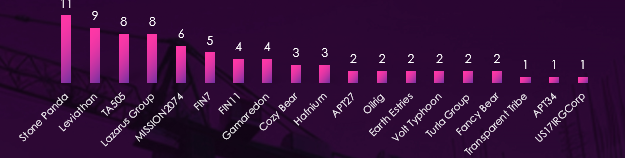
Observed APT campaigns are led by suspected China-linked, state-sponsored actors, with Stone Panda recording the highest campaign count, followed by Leviathan. MISSION2074, Hafnium, APT27, Earth Estries, and Volt Typhoon provide further China-aligned representation. Leviathan ranking second is relevant to the sector given its documented focus on engineering, maritime, and infrastructure-related targets.
Financially motivated actors feature heavily, with TA505, FIN7, and FIN11 all recording significant counts, reflecting the sector’s exposure to criminal monetization alongside espionage. North Korea-associated Lazarus Group matches TA505 in campaign count. Russia-linked Gamaredon, Cozy Bear, Turla Group, and Fancy Bear all appear, the broadest Russian representation recorded this period. Iran-linked OilRig and Pakistan-linked Transparent Tribe complete the profile.
GEOGRAPHICAL DISTRIBUTION
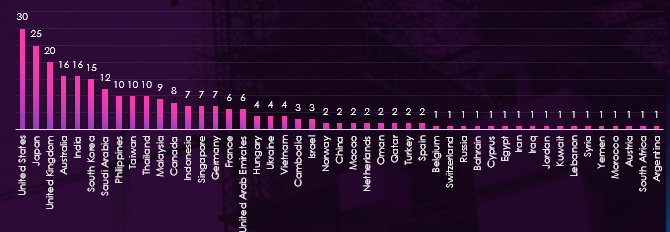
Victim distribution spans 47 countries, with the United States recording the highest victim count, followed by Japan and the United Kingdom. Australia, India, and South Korea form the next tier, with Saudi Arabia notable at seventh overall, higher than in most sectors and consistent with large-scale regional construction and development activity.
Southeast Asian representation is broad, covering the Philippines, Thailand, Malaysia, Indonesia, Singapore, Vietnam, and Cambodia. European presence spans Germany, France, Hungary, Ukraine, Spain, the Netherlands, Belgium, Switzerland, Austria, and Norway.
Middle Eastern presence is wide, covering Saudi Arabia, the UAE, Israel, Oman, Qatar, Bahrain, Kuwait, Jordan, Lebanon, Iran, Iraq, Syria, and Yemen. Remaining victims are spread across East Asia, Africa, and Latin America.
TOP ATTACKED TECHNOLOGY
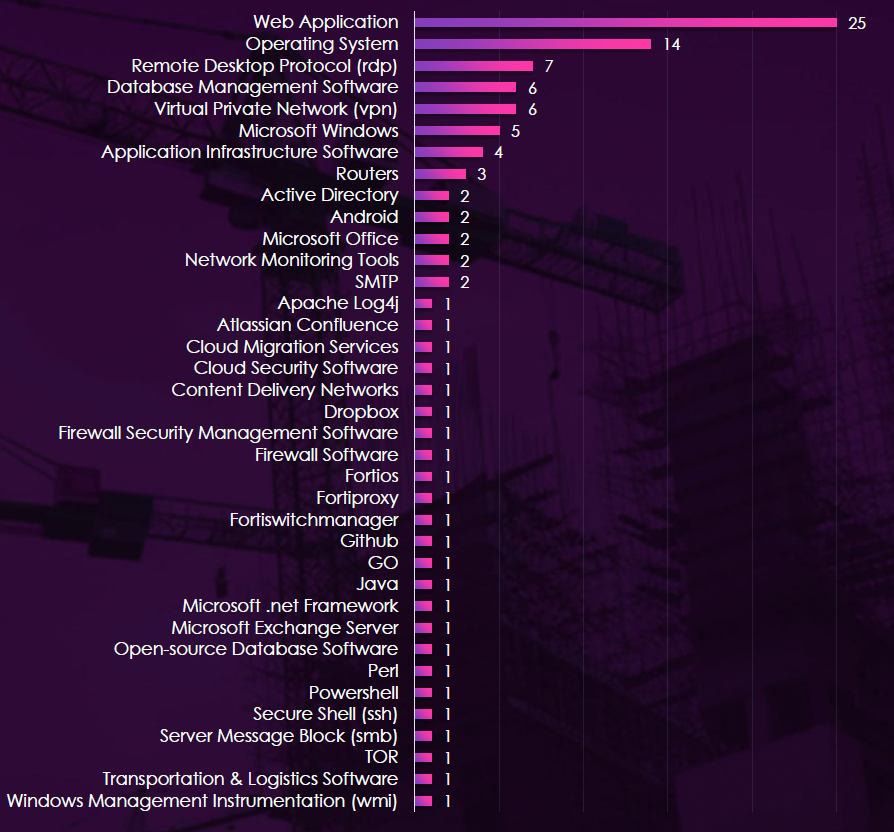
Web applications account for the highest number of observed attacks by a wide margin, followed by operating systems. Remote desktop protocol ranks third, higher than in most sectors, pointing to remote access as a primary route into distributed project sites and site offices. Database management software, VPN solutions, and Microsoft Windows also feature across multiple campaigns.
Routers, Active Directory, and network monitoring tools appear alongside three Fortinet products, firewall software, and firewall security management software, indicating sustained interest in perimeter appliances and identity infrastructure. Microsoft Exchange Server, Atlassian Confluence, and Apache Log4j also feature, reflecting exploitation of widely deployed enterprise software with known vulnerability histories.
Android appearing across two campaigns is notable and points to mobile devices as a target, consistent with a workforce operating across distributed and temporary sites. Post-exploitation tooling, including PowerShell, Windows Management Instrumentation, Server Message Block, and SSH, is also recorded, indicating campaigns progressing beyond initial access.
Risk Level Indicator: 7.6 – High
FORWARD ASSESSMENT
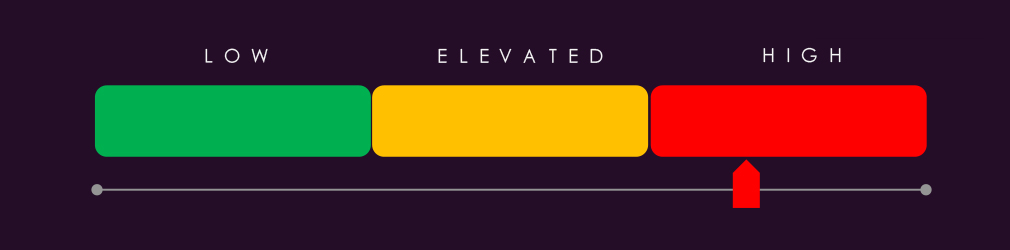
Based on observed trajectory across the two reporting periods, the real estate and construction sector external threat landscape is expected to remain at High through the next 90 days. Campaign presence grew from 5 to 37 in absolute terms, with the sector’s share doubling from 16% to 32%. Both measures rising together indicates the sector is attracting disproportionately increased attention rather than simply scaling with a growing campaign pool.
Sustained volume: Campaign presence grew from 5 out of 32 to 37 out of 114 observed campaign activity updates period over period. Recorded monthly counts rose from 4 to 13 across June to September, though activity updates accumulate toward later months and overstate the steepness of that curve. 35 to 45 real estate and construction sector campaigns over the next 90 days is a plausible baseline estimate.
Dominant actor continuity: Stone Panda and Leviathan recorded the highest campaign counts and show no indicators of reduced tempo. Leviathan’s documented focus on engineering and infrastructure targets indicates sector-specific rather than opportunistic interest, and is the clearest signal that this sector is being deliberately selected.
Criminal and state actor overlap: TA505, FIN7, and FIN11 collectively account for a substantial share of observed campaigns, placing financially motivated actors alongside the leading state-sponsored groups. The sector’s combination of high-value project data, contractual information, and payment flows supports continued targeting from both directions.
Remote access and perimeter exposure: Remote desktop protocol ranking third among targeted technologies, alongside VPN solutions, routers, three Fortinet products, and Active Directory, points to perimeter compromise followed by lateral movement through identity infrastructure. Organizations with exposed RDP, unpatched edge appliances, or weak segmentation between site and corporate networks face the highest immediate risk. Android targeting across two campaigns indicates mobile devices should be included in that exposure assessment.
Geographic targeting: The United States, Japan, and the United Kingdom lead in victim count across 47 countries. Saudi Arabia ranking seventh is above its position in most sectors and is expected to persist given the scale of regional construction and development programmes. The Indo-Pacific corridor and North America remain primary target zones.
Multi-origin threat profile: China-linked, North Korean, Russian, Iranian, and Pakistani state actors feature alongside three major financially motivated groups. Russian representation is the broadest recorded this period, spanning four distinct groups. Defenders should prioritize TTP-based detection over actor-specific IOC tracking given the breadth of actor representation and the heavy overlap in targeted remote access and perimeter infrastructure.
REPORTED CYBER INCIDENTS
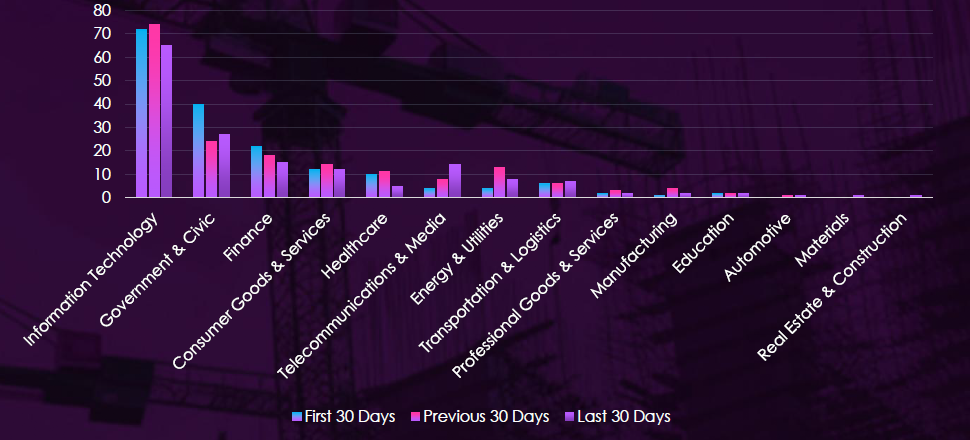
Over the past 90 days, DeCYFIR and DeTCT platforms tracked 691 cyber incidents reported publicly. We could identify the industry for 515 of these incidents.
The real estate & construction industry was detected in just 1 incident, which equals 0.19% of the incidents where we knew the industry, ranking 14th out of 14 industries.
THREAT BRIEF
Real estate and construction is the least-reported sector in this dataset, appearing in only one incident across the quarter and three across the full period since April. This is not evidence of low risk. It reflects what public security reporting covers. Security vendors, national CERTs and the technical press write about software vendors, government agencies, banks and large listed companies. Property developers, contractors, architecture practices, facilities managers and regional estate agencies are almost never named unless a breach is large enough to trigger notification in a jurisdiction that requires it. The sector is also structurally fragmented, with most work delivered by small firms and joint ventures that have no communications function and no obligation to disclose. Anything below should be read as directional, not statistical.
Two incidents touched the sector in the quarter, and neither involved a construction or property firm as the direct victim. The Romanian land registry was disrupted by a cyberattack that stalled the national property market for weeks, which is the clearest demonstration in the data that this sector’s operational dependency sits in government systems it does not control: title records, planning permission, permits and land registration. Separately, the FBI warned about fake permit fee scams, a fraud model that targets contractors and developers through the administrative processes they must complete, not through their networks. Earlier in the period, outside the 90-day window, a large commercial real estate services firm suffered an account breach affecting several hundred thousand records.
The sector’s real exposure is visible in the patterns hitting neighbouring industries rather than in its own thin record.
Payment redirection is the dominant financial threat to construction, and it does not require sophistication. The sector runs on large, scheduled, expected payments between parties who rarely meet: progress claims, subcontractor invoices, retention releases, deposit transfers at completion. Business email compromise works against exactly this profile, and the growth in social engineering and credential theft observed across all sectors this quarter translates directly into invoice fraud here. Conveyancing and deposit interception is the residential equivalent and has the same structure.
Third-party compromise is how risk reaches this sector. The consistent pattern across professional services and retail this quarter was compromise arriving through a supplier, a support system or a shared platform rather than through the victim’s own perimeter. Construction is more exposed to this than most industries, because a single project links a client, main contractor, dozens of subcontractors, designers, surveyors and suppliers, all exchanging documents through shared project platforms and common data environments with credentials that outlive the project. The weakest firm in that chain sets the security level for everyone on it.
Building operational technology is the emerging physical risk. The advisories issued this quarter about active exploitation of programmable logic controllers in critical infrastructure concern the same classes of equipment used in building management: HVAC, access control, lifts, fire systems, and energy management. Facilities management and smart-building operators run this equipment across portfolios, frequently with remote vendor access and rarely with network segmentation.
Ransomware against local government is a delivery risk in its own right. Several local authorities lost services to ransomware during the quarter. For developers and contractors, an authority unable to issue permits, process inspections or update registers halts projects just as effectively as an attack on the contractor.
Design and bid data carries value that firms routinely underestimate. Tender pricing, bid submissions and design documentation are commercially sensitive on a fixed timeline, and the extortion actors dominating this quarter monetise exactly that kind of leverage. A leak before a bid deadline is worth more to an attacker than the data itself.
Assessment. The absence of reported incidents should be treated as a visibility problem rather than a risk finding. The sector’s profile combines high-value scheduled payments, deep and transient supplier chains, operational dependency on government systems it cannot secure, and physical building systems reaching the internet. Where firms in this sector are compromised, the loss is most likely to arrive as a redirected payment or a stalled project rather than as a headline breach, and neither of those outcomes generates the kind of public reporting this dataset collects. Ransomware leak-site monitoring and construction trade press would be required to see the real level of activity.
Risk Level Indicator: 6.0 – Elevated

FORWARD ASSESSMENT
Threat level for the real estate and construction sector over the next 90 days is assessed as an elevated risk. Public incident reporting remains thin, but ransomware victim data indicates substantially higher actual exposure than the public dataset reflects, with significant quarter-on-quarter growth in victim count and sector share.
The following developments are anticipated based on current trends, actor capabilities, and operational patterns:
Ransomware Targeting Contractors as the Defining Trend. Ransomware groups are treating the sector as a target class rather than pursuing individual high-value firms. The victim distribution is broad across subsectors, from specialty trade contractors through to architecture firms, property management, and building materials supply. Volume growth at this rate is unlikely to reverse without a structural change in attacker incentives.
Payment Redirection as Primary Financial Threat. Business email compromise against construction payment workflows does not require technical sophistication. Progress claims, subcontractor invoices, and deposit transfers between parties who rarely meet are a standing target for the social engineering and credential theft techniques that dominated this quarter across all sectors.
Third-Party Compromise as Primary Intrusion Path. A single project links a client, main contractor, and dozens of subcontractors exchanging documents through shared platforms with credentials that outlive the project. The weakest firm in that chain sets the security level for everyone on it. Supply chain compromise patterns observed across professional services and retail this quarter apply directly here.
Design and Bid Data as Extortion Leverage. Tender pricing, bid submissions, and design documentation are commercially sensitive on a fixed timeline. A leak before a bid deadline carries disproportionate leverage relative to the data’s intrinsic value. Ransomware groups with leak sites are well positioned to exploit this.
Building OT as Emerging Attack Surface. HVAC, access control, lifts, fire systems, and energy management run on the same equipment classes flagged in this quarter’s critical infrastructure advisories on PLC exploitation. Facilities management and smart-building operators frequently run this equipment with remote vendor access and without network segmentation, a configuration that mirrors exactly what Iranian-linked actors exploited in water utilities this quarter.
UNDERGROUND & DARK WEB CHATTER ANALYSIS
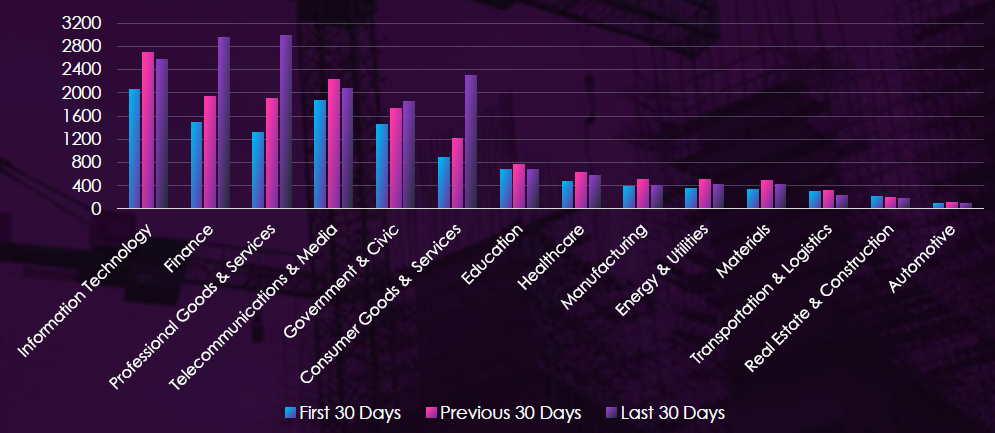
Over the past 90 days, CYFIRMA’s telemetry has identified 609 mentions of real estate & construction organizations out of a total of 44,866 industry-linked mentions. This is from a total of 300k+ posts across various underground and dark web channels and forums.
Real estate & construction organizations landed in 13th place out of 14 industries in the last 90 days, with a share of 1.36% of all detected industry-linked chatter.
Below is a breakdown by 30-day periods of all mentions.
GLOBAL CHATTER CATEGORIES
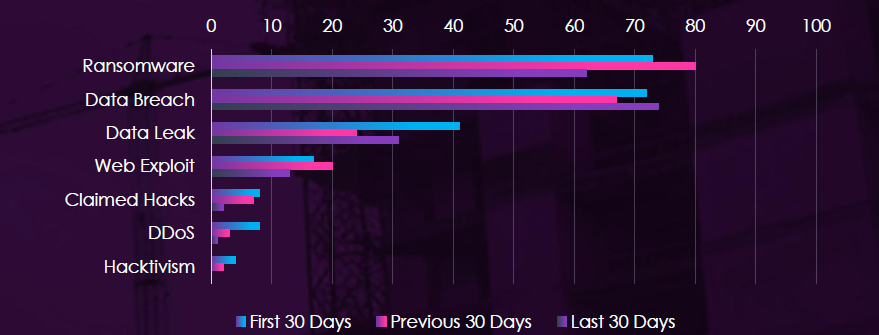
Underground & dark web chatter related to the real estate & construction sector over the last 90 days is led by ransomware, the only sector in this report where ransomware exceeds data breach discussion. Ransomware rises then falls back below its opening level, while data breach mentions stay broadly flat across all three periods. Data leaks decline after the first period without recovering. Web exploit volumes remain low throughout. Claimed hacks, DDoS, and hacktivism all fall steadily to near zero by the final period, and total sector chatter declines across the window against a rising trend in most other sectors.
Risk Level Indicator: 5.5 – Elevated
FORWARD ASSESSMENT
Real estate & construction carries the lowest chatter volume of any sector in this report apart from automotive, and it is one of the few where total volume declined across the window. No category shows sustained growth. The elevated rather than high rating reflects that absence of escalation, qualified by the sector’s unusual composition, where ransomware rather than data theft leads the profile.
Ransomware as the Leading Category: The only sector in this report where ransomware exceeds data breach chatter. Construction and property firms hold limited volumes of resaleable personal data but operate on fixed project schedules with contractual penalties for delay, which makes disruption rather than disclosure the effective leverage. This shifts the practical exposure from regulatory and reputational cost toward direct financial loss through halted work.
Flat Breach and Leak Volumes: Data breach chatter is essentially unchanged across the window and leak chatter declines. Against a report-wide pattern of steep growth in both categories, this sector shows none, indicating the data it holds carries limited resale demand rather than that it is better defended.
Project Data and Supplier Access: Bid documents, contract terms and project schedules have value to competitors and to fraud operators targeting payment redirection, but not to the bulk data markets driving volume elsewhere. Construction supply chains also involve numerous small subcontractors with credentialed access to shared project systems, which is a route into larger principals that generates little underground discussion because it is not traded.
Declining Disruption and Claim Categories: Claimed hacks, DDoS and hacktivism all fall to near zero by the final period. These categories were already low, so the decline carries less weight here than in sectors where they fell from a meaningful base, and the sector has no obvious geopolitical profile that would drive their return.
Low Volume as a Visibility Limitation: At this volume, single incidents move category totals materially, and period-to-period changes should not be read as trends with confidence. The absence of chatter is also not evidence of absence of targeting, since ransomware operators frequently negotiate privately before any leak-site posting, and construction firms have historically settled without public disclosure.
VULNERABILITIES ANALYSIS
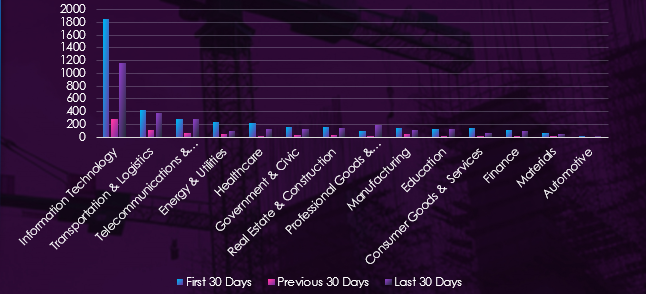
Over the past 90 days, CYFIRMA’s telemetry has identified 328 mentions of real estate & construction organizations out of a total of 7,758 industry mentions. This is from over 10k CVEs reported and updated in the last 90 days.
Real estate & construction organizations ranked 7th out of 14 industries in the last 90 days, with a share of 4.23% of all detected industry-linked vulnerabilities.
Below is a breakdown by 30-day periods of all mentions.
VULNERABILITY CATEGORIES
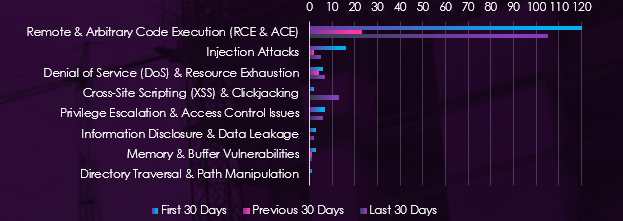
Reported CVEs in the real estate & construction sector over the last 90 days are dominated by remote and arbitrary code execution, which accounts for the large majority of volume in both the first and final periods. Cross-site scripting rises sharply in the final period from near zero. Injection attacks decline substantially from their opening level. Denial of service and privilege escalation remain low and broadly flat, while information disclosure, memory and buffer, and directory traversal stay minimal throughout. All categories show a pronounced mid-period reduction that appears across every sector in the dataset and should be treated as a collection artefact rather than a change in disclosure activity.
Risk Level Indicator: 6.9 – Elevated
FORWARD ASSESSMENT
Real estate & construction shows a vulnerability profile dominated almost entirely by remote code execution, with total volume slightly lower in the final period than the first. The mid-window reduction appears at a similar proportion across all fourteen sectors, indicating disclosure and publication rhythm at the feed level rather than anything specific to this sector, so the first-to-final comparison is the meaningful read. The elevated rather than high rating reflects that flat-to-declining trajectory, qualified by the sector’s limited capacity to act on disclosures at the pace they arrive.
Remote & Arbitrary Code Execution: Dominant throughout and the only category carrying substantial volume. Construction and property firms operate project collaboration platforms, document management systems, building management interfaces and tenant or client portals, much of it vendor-supplied and internet-facing. Unauthenticated code execution against this class of system is the primary exposure, and fragmented IT ownership across joint ventures, subcontractors and managing agents complicates both asset inventory and patch deployment.
Cross-Site Scripting: Rises sharply in the final period from a near-zero base, the only category moving upward while the sector total declines. Relevant to tenant portals, client-facing project interfaces, and property listing platforms, where client-side compromise supports credential capture rather than serving as an endpoint in itself.
Patch Capacity as the Limiting Factor: The gap between disclosure and remediation is wider in this sector than in most. Construction and property firms typically run lean IT functions, rely heavily on vendor-managed systems, and operate sites and buildings where systems cannot be taken offline on a security timetable. Exposure duration rather than exposure volume is the material risk, and a flat disclosure count does not imply flat accumulated exposure.
Alignment with the Chatter Profile: The sector’s underground chatter is led by ransomware with flat data breach volumes, while its vulnerability profile concentrates in code execution. These are consistent rather than contradictory. Unauthenticated code execution against internet-facing systems is a standard ransomware initial access route, and the two datasets describe the same attack path from opposite ends.
Remaining Categories: Injection attacks decline from their opening level, and denial of service, privilege escalation, information disclosure, memory and buffer, and directory traversal all remain minimal. None currently shape the sector’s risk profile.
RANSOMWARE VICTIMOLOGY
In the past 90 days, CYFIRMA has identified 290 verified ransomware victims in real estate & construction organizations. This accounts for 10.62% of all 2,731 ransomware victims during the same period, placing this sector 6th out of 14 industries.
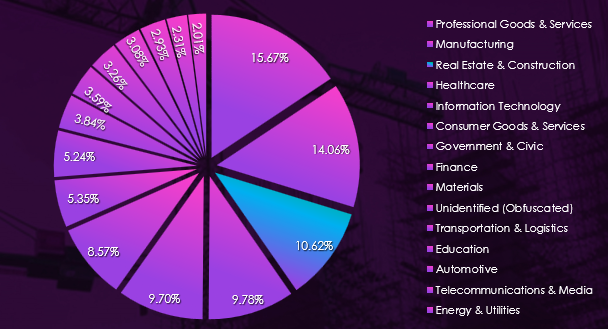
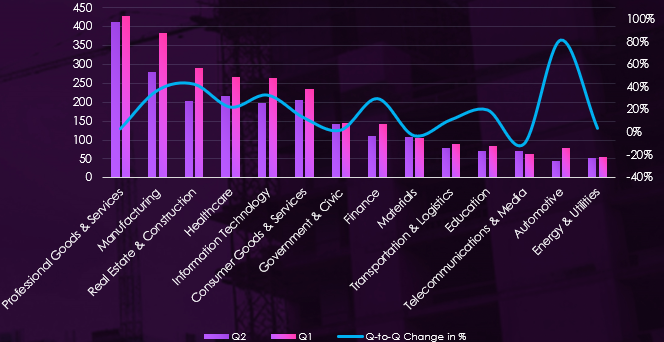
Furthermore, a quarterly comparison shows that the number of victims in real estate & construction organizations has grown. It went up from 203 to 290 victims, a dramatic 42.9% increase. The overall interest, represented by share, also grew significantly from 8.91% to 10.62% of all victims.
INDUSTRY MONTHLY ACTIVITY CHART
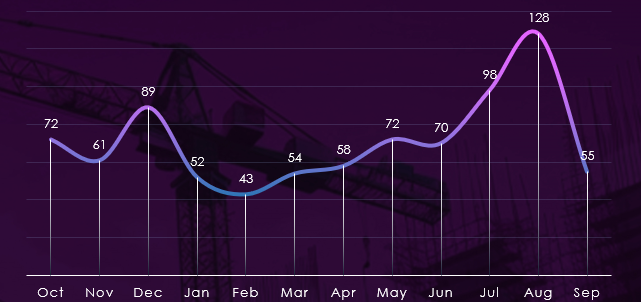
Monthly activity recorded a major dip during early 2026, then grew continuously across months until July and August, when activity dramatically spiked. Three weeks into September, it appears the activity in this industry has slowed down again.
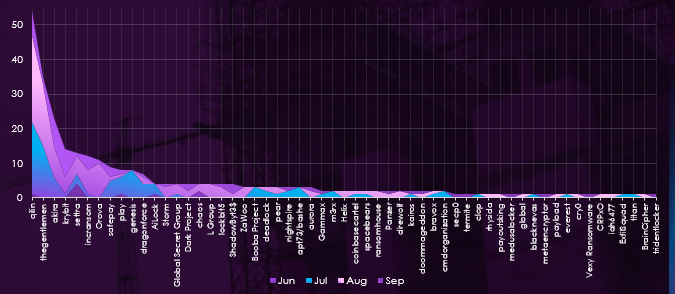
Qilin and Thegentlemen drove the surge, together accounting for over a third of July and August volume. Qilin escalated from a single June victim to 21 in July and 25 in August. Thegentlemen recorded no June victims before posting 15 and 18 in the following two months.
Akira and Krybit built steadily across the period and were the most active groups in September, while Orova entered with 10 victims in August alone. Genesis concentrated all eight of its victims in July. The concentration of the spike in a small number of escalating actors, rather than broad participation growth, points to a scalable access route being worked rather than a sector-wide shift in targeting.
BREAKDOWN OF ACTIVITY PER GANG
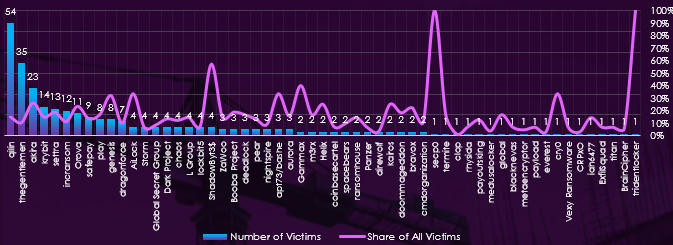
Out of the 99 gangs, 57 recorded victims in the real estate & construction industry in the last 90 days, representing a 58% participation rate.
Qilin and Thegentlemen had the highest numbers of victims by a wide margin, and both directed a meaningful share of their overall activity here, at 14.8% and 10.4%, respectively.
ShadowByt3$ recorded 57.1% of its victims in this sector, the highest share among multi-victim gangs. Gammax (40.0%), AiLock (33.3%), Apt73/bashe (33.3%), and Genesis (32.0%) also show strong sector focus. Akira at 26.1% is the clearest specialist among high-volume groups.
On average, gangs active in this industry recorded a 17.9% share of their victims from this industry. That is about 1 in 6 victims.
VICTIMS PER INDUSTRY SECTOR
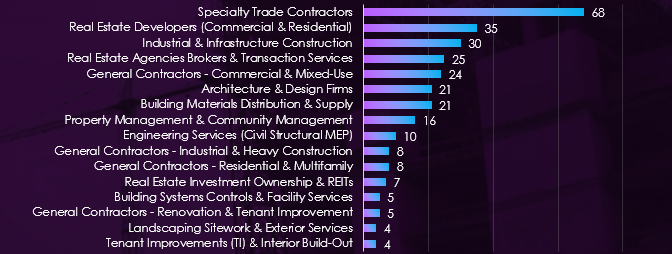
Specialty Trade Contractors accounted for the largest share of victims by a wide margin, at roughly a quarter of the sector total. These are typically small and mid-sized subcontractors with limited security resourcing but direct integration into larger project workflows, making them both easy to compromise and disruptive to lose.
Real Estate Developers, Industrial & Infrastructure Construction, Real Estate Agencies, and General Contractors in commercial and mixed-use work formed a substantial second tier. Architecture & Design Firms and Building Materials Distribution each recorded 21 victims. Victims were recorded across all 16 tracked subsectors, from engineering services and property management through to landscaping and interior build-out.
GEOGRAPHIC DISTRIBUTION OF VICTIMS
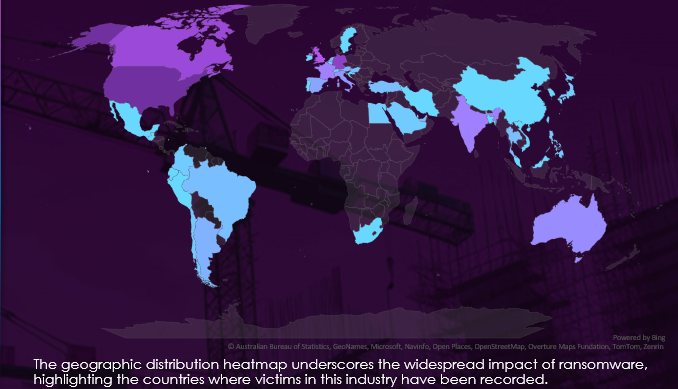
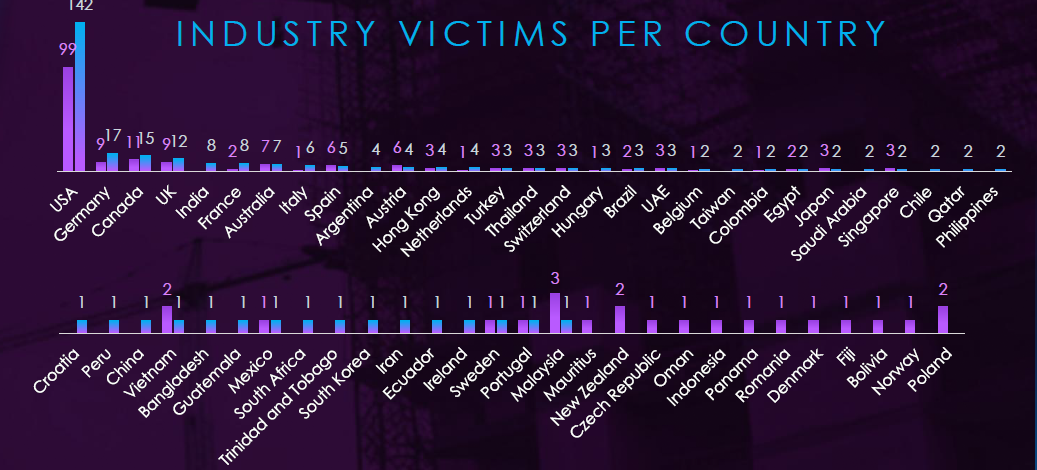
Real estate & construction victimology shows the USA as the most targeted, accounting for 49% of all victims.
Remaining activity is distributed among 44 countries for 148 victims.
Germany and India recorded the highest elevations in the last 90 days, both rising by 8 victims, followed by France, Italy, Canada, and Argentina.
Austria, Malaysia, New Zealand, and Poland saw the largest declines, though all were small in absolute terms.
In the last 90 days, 45 countries recorded real estate & construction victims, 6 more than the 39 countries in the previous period.
Risk Level Indicator: 8.5 – High
FORWARD ASSESSMENT
The Real Estate & Construction sector threat landscape is expected to remain high through the next 90 days. Victim volume grew 42.9% quarter-on-quarter from 203 to 290, the largest increase recorded across any sector this period, and sector share rose from 8.91% to 10.62%. The 9.0 rating reflects conditions in the United States specifically, which absorbed 49% of all victims and the bulk of the increase. Organisations outside the US currently face a materially lower risk level, but the underlying driver is not geographically bound and could extend to other markets with little warning.
Volume outlook: Activity dipped to 43 in February before climbing steadily, then accelerated sharply to 98 in July and 128 in August. September is tracking at 55 with three weeks recorded, below the peak but above the pre-spike baseline. A range of 250 to 300 victims over the next 90 days is plausible, with wide uncertainty given how concentrated the driver is.
Actor behaviour: 57 of 99 active gangs recorded victims here, a 58% participation rate, but the escalation is not broad-based. Qilin rose from 1 June victim to 25 in August, and Thegentlemen from zero to 18, together accounting for roughly a third of monthly volume at peak. Akira and Krybit led September activity. A disruption to either leading actor would materially reduce sector volume, which is not true of sectors where targeting is distributed.
Access vector hypothesis: A small number of actors scaling rapidly while overall participation stays flat is more consistent with a scalable initial access route being worked through a target list than with a sector-wide change in attacker economics. A shared managed service provider, a widely deployed construction or project management platform, or an exposed appliance class are candidate explanations. This is supported but not confirmed by the data. If the vector is a software product or appliance rather than a US-specific service provider, expansion into European and Asia-Pacific markets should be expected. Reviewing third-party access and remote access appliances is the priority control.
Specialist targeting risk: The average sector share across active gangs is 17.9%, roughly one in six victims. Akira at 26.1% and Orova at 23.4% are the highest among meaningful-volume groups. Akira warrants particular attention, having both escalated through the period and led September activity.
Geographic targeting: US victims rose from 99 to 142, pushing concentration to 49%, the highest recorded for this sector. Country coverage still expanded from 39 to 45, with Germany and India each gaining 8 victims and France, Italy, Canada, and Argentina also rising. Declines were marginal throughout, indicating growth is additive across regions rather than redistributive.
Subsector risk: Specialty Trade Contractors represent the highest-risk subsector by a clear margin. Small subcontractors typically lack dedicated security staff while holding project documentation, client data, and payment information, and their integration into larger construction workflows creates onward access risk to general contractors and developers.
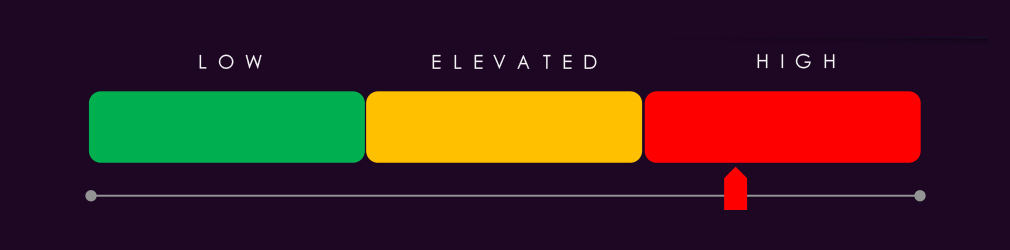
APT Campaigns (High): Real estate & construction featured in 37 of 114 campaign activity updates (32%), up from 5 of 32, with absolute presence and share rising together. Share doubling from 16% is the only case in this series of a sector gaining ground rather than scaling with an expanding pool, indicating deliberate selection. Stone Panda led campaign counts with Leviathan second, whose documented focus on engineering, maritime and infrastructure targets is the clearest sector-specific signal available. TA505, FIN7 and FIN11 all recorded significant counts alongside the broadest Russian representation this period across four groups. Remote desktop protocol ranked third among targeted technologies, higher than in most sectors and consistent with distributed site offices, while Android across two campaigns points to mobile exposure in a workforce operating from temporary locations. Victims span 47 countries, with Saudi Arabia notable at seventh.
Reported Cyber Incidents (Elevated): The sector is the least-reported in the dataset, and this reflects what public security reporting covers rather than actual exposure. Contractors, developers, architecture practices and regional agencies are rarely named unless a breach triggers mandatory notification, and the sector is structurally fragmented across small firms and joint ventures with no communications function and no disclosure obligation. Neither incident touched a construction or property firm directly. Romania’s land registry disruption stalled the national property market for weeks, demonstrating that the sector’s operational dependency sits in government systems it does not control, covering titles, permits and land registration. The FBI separately warned of fake permit fee scams targeting contractors through administrative processes rather than networks. Payment redirection against progress claims, subcontractor invoices, and deposit transfers remains the dominant financial threat and requires no technical sophistication.
Underground & Dark Web Chatter (Elevated): The sector placed 13th of 14 at 1.36% of industry-linked chatter with 609 mentions, and is one of the few where total volume declined across the window. It is the only sector in this report where ransomware exceeds data breach discussion. Construction and property firms hold limited resaleable personal data but operate on fixed schedules with contractual penalties for delay, making disruption rather than disclosure the effective leverage, which shifts exposure from regulatory cost toward direct financial loss through halted work. Breach and leak volumes stayed flat against a report-wide pattern of steep growth, indicating limited resale demand rather than better defence. Ransomware chatter rose then eased in the final period, tracking the September decline in recorded victims, which indicates the signal moves with actual activity rather than lagging it.
Vulnerabilities (Elevated): The sector ranked 7th of 14 at 4.23% of industry-linked disclosures across 328 mentions, with a profile dominated almost entirely by remote code execution. Construction and property firms operate project collaboration platforms, document management systems, building management interfaces, and tenant portals, much of it vendor-supplied and internet-facing, and unauthenticated code execution against this class of system is the primary exposure. Cross-site scripting rose sharply in the final period from near zero, relevant to tenant and client-facing interfaces where client-side compromise supports credential capture. Patch capacity is the limiting factor. Lean IT functions, heavy reliance on vendor-managed systems and buildings that cannot be taken offline on a security timetable make exposure duration rather than exposure volume the material risk, so a flat disclosure count does not imply flat accumulated exposure.
Ransomware (High): 290 victims, up 42.9% from 203, the largest quarter-on-quarter increase recorded across any sector this period, with share rising from 8.91% to 10.62% and coverage expanding from 39 to 45 countries. The escalation is not broad-based. Qilin rose from one June victim to 25 in August, and Thegentlemen from zero to 18, together accounting for roughly a third of peak monthly volume, which is more consistent with a scalable access route being worked through a target list than a sector-wide shift. Reviewing third-party access and remote access appliances is the priority control. Specialty Trade Contractors led victims at roughly a quarter of the total, typically small subcontractors with limited security resourcing but direct integration into larger project workflows. The United States absorbed 49% of victims and the bulk of the increase.
