

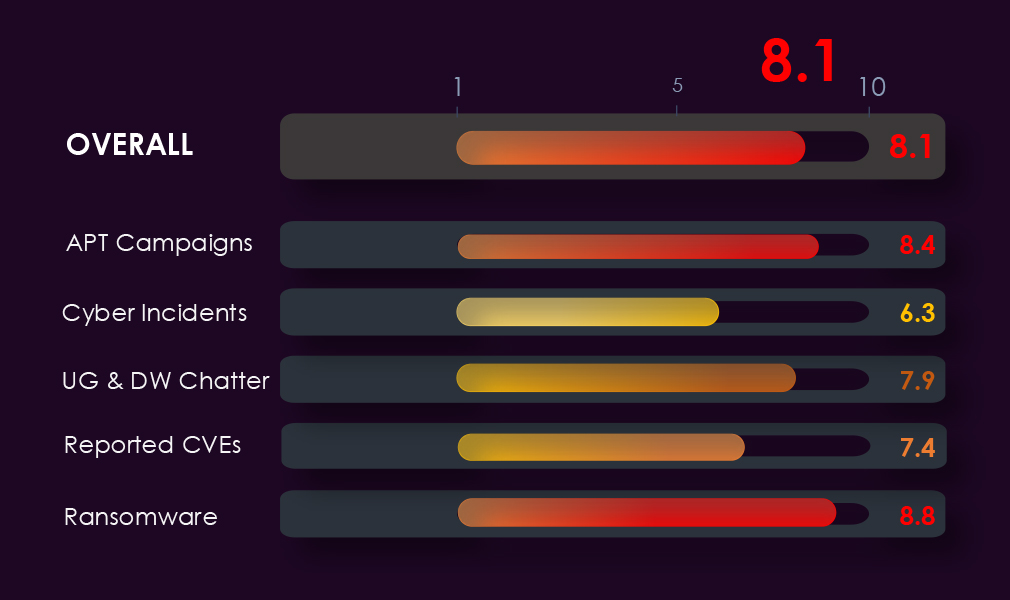
APT Campaigns – 8.4
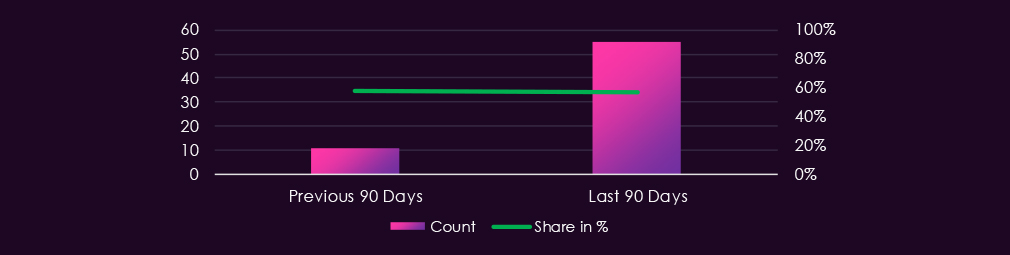
55 of 96 campaigns (57%), a five-fold rise from 11, while holding share against 58% previously. Sustaining share through a five-fold pool expansion means the sector scaled with the threat rather than being diluted. Three Fortinet products alongside Active Directory point to edge compromise followed by identity-based lateral movement. Victim spread across 40 countries is the widest recorded.
Cyber Incidents – 6.3
Low reported volume reflects structural under-disclosure, since incidents in this sector are read by clients rather than the market. Silent Ransom Group’s vishing campaign against US law firms is the only case this period built around a sector’s specific structural weaknesses. Ernst & Young, LexisNexis, and a US Bank fourth-party incident confirm propagation along supplier chains.
Dark Web Chatter – 7.9
2,578 mentions, 3rd of 14 at 12.87%. Breach, leak, and ransomware chatter all rose in every period against a declining sector-wide backdrop. Web exploit mentions surged to become the largest single category, hitting this industry disproportionately. Corroborated by the CVE profile in the same time window.
Vulnerabilities – 7.4
161 mentions, 4th of 14 at 6.12%, concentrated in the final period with every category rising and RCE more than tripling. The rise is visible across all fourteen industries, so the sector weight rests on the corroborating chatter surge rather than disclosure volume alone. Privilege escalation appeared for the first time in the final period.
Ransomware – 8.8
418 victims, 1st of 14, though volume dipped 2.3% and share fell from 18.92% to 16.08%. August hit a period high of 174 with five groups entering the sector for the first time. 68% gang participation is the highest observed in any sector, and country coverage widened from 44 to 55.
The CYFIRMA Industry Report delivers original cybersecurity insights and telemetry-driven statistics of global industries, covering one sector each week for a quarter. This report focuses on the professional goods & services sector, presenting key trends and statistics in an engaging infographic format.
Welcome to the CYFIRMA infographic industry report, where we delve into the external threat landscape of the professional goods & services industry over the past three months. This report provides valuable insights and data-driven statistics, delivering a concise analysis of attack campaigns, public reports, underground & dark web chatter, vulnerabilities, and ransomware incidents targeting professional goods & services organizations.
We aim to present an industry-specific overview in a convenient, engaging, and informative format. Leveraging our cutting-edge platform telemetry and the expertise of our analysts, we bring you actionable intelligence to stay ahead in the cybersecurity landscape.
CYFIRMA delivers pre-emptive cybersecurity, cyber threat intelligence, and external threat landscape management through its platforms, DeCYFIR and DeTCT. These platforms have been purpose-built over many years to continuously collect, correlate, and analyse large volumes of external threat data, combining proprietary intelligence automation with deep, hands-on cyber threat research.
For the purposes of this report, the analysis draws on intelligence generated from CYFIRMA’s platforms. The data referenced has been processed through automated correlation and enrichment mechanisms, informed and validated by human-led research and investigative expertise, and sourced from both structured and unstructured external intelligence channels.
While this report contains data collected and processed by our in-house AI and ML, all charts, statistics, and analyses are done by human CYFIRMA CTI analysts to ensure the highest quality and provide accurate insights.
Professional goods & services organizations featured in 55 out of the 96 campaign activity updates, which is a presence in 57% of all campaigns. This is a significant jump from the previous period when B2B organizations were present in 11 out of 19 campaigns. However, a sustained presence in 58% of observed campaigns.
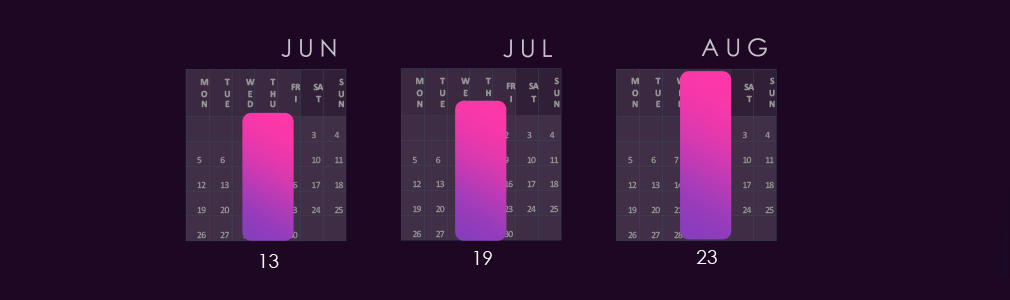
APT activity targeting Professional goods & services has been continuous and increasing. Monthly campaign counts rose steadily across the period, with most campaigns remaining active and updated with new detections as recently as August.
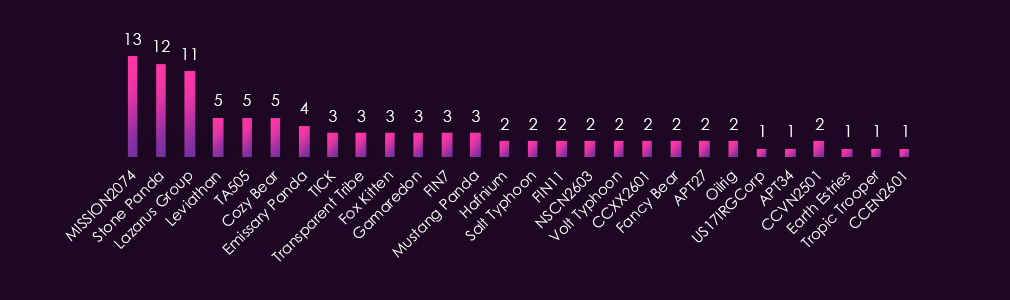
Observed APT campaigns are dominated by suspected China-linked, state-sponsored actors, with MISSION2074 recording the highest campaign count, followed closely by Stone Panda. Leviathan, Emissary Panda, TICK, Mustang Panda, Hafnium, Salt Typhoon, Volt Typhoon, APT27, Earth Estries, and Tropic Trooper provide additional China-aligned representation.
Lazarus Group ranks third overall, indicating sustained DPRK interest alongside the dominant espionage-driven cluster. Russia-linked Cozy Bear, Gamaredon, and Fancy Bear all feature, with Iran-linked Fox Kitten and OilRig also present. Pakistan-linked Transparent Tribe appears across multiple campaigns. Financially motivated actors TA505, FIN7, and FIN11 account for a meaningful share, alongside several regional cybercriminal groups.
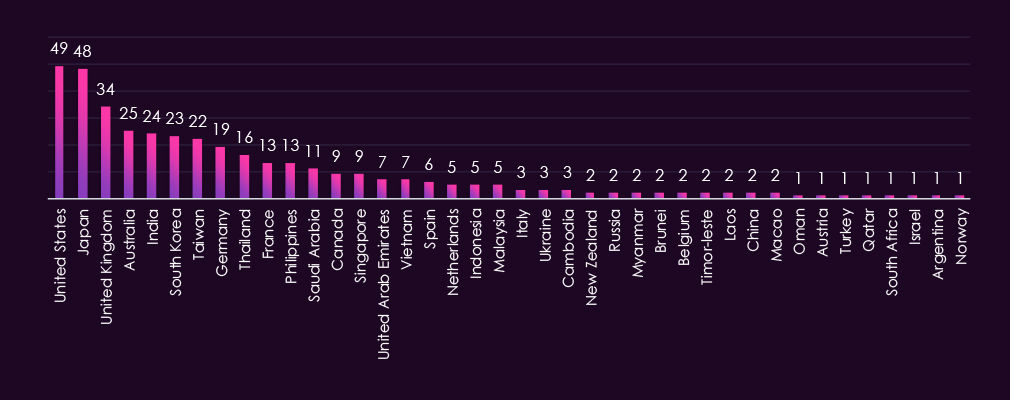
Victim distribution spans 40 countries, with the United States and Japan recording the highest victim counts by a wide margin, followed by the United Kingdom. Australia, India, South Korea, and Taiwan also feature prominently, reflecting concentrated targeting across major professional services markets in North America and the Indo-Pacific.
Germany leads European representation, with France, Spain, the Netherlands, Italy, Ukraine, Belgium, Austria, and Norway all recording victims. Middle Eastern presence is led by Saudi Arabia and the UAE, with Oman, Qatar, and Israel also appearing.
Southeast Asian representation is broad, covering Thailand, the Philippines, Singapore, Vietnam, Indonesia, Malaysia, Cambodia, Myanmar, Brunei, Timor-Leste, and Laos. Remaining victims are spread across East Asia, Latin America, Africa, and Oceania.
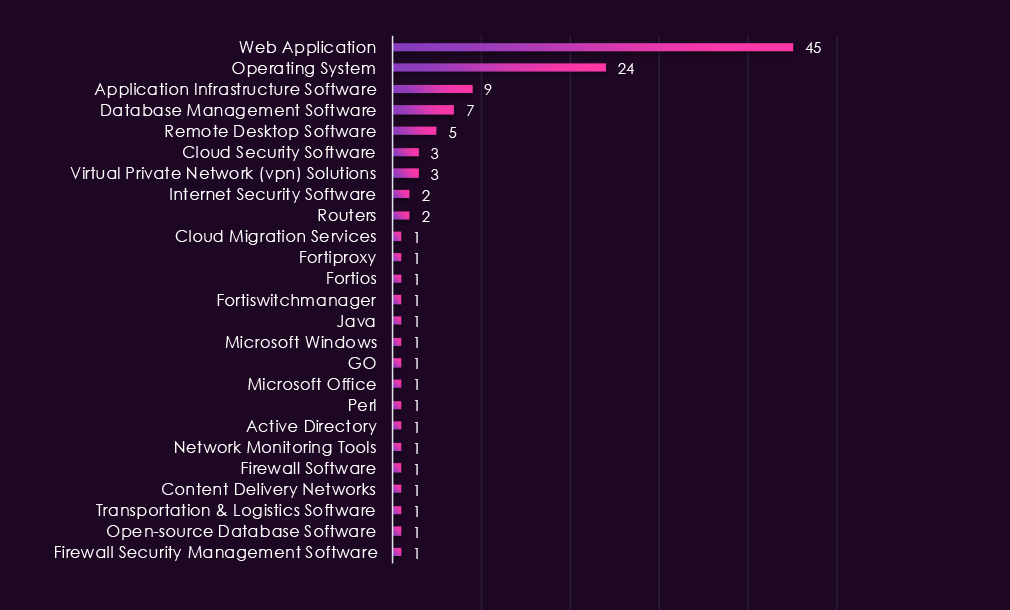
Web applications account for the highest number of observed attacks by a wide margin, followed by operating systems. Application infrastructure software and database management software both feature across multiple campaigns, pointing to platform-level access and data exfiltration as parallel objectives.
Remote desktop software, cloud security software, VPN solutions, internet security software, and routers also appear. Notably, three separate Fortinet products are recorded as targeted technologies, alongside Active Directory, indicating focused interest in network edge appliances and identity infrastructure. Development languages and runtime environments including Java, Go, and Perl also feature, reflecting targeting of the application layer itself.

Based on observed trajectory across the two reporting periods, the professional goods and services sector external threat landscape is expected to remain at High through the next 90 days. Campaign presence grew five-fold in absolute terms from 11 to 55, while holding a sustained share of 57% against 58% previously, indicating the sector is scaling with a rapidly expanding overall campaign pool rather than losing relative prominence.
Sustained volume: Campaign presence grew from 11 out of 19 to 55 out of 96 observed campaigns period over period. Monthly counts increased consistently from 13 to 19 to 23, with campaigns remaining active and receiving new detections as recently as August. 50 to 60 professional goods and services sector campaigns over the next 90 days is a plausible baseline estimate.
Dominant actor continuity: MISSION2074, Stone Panda, and Lazarus Group recorded the highest campaign counts by a clear margin and show no indicators of reduced tempo. The three leading actors span two distinct nation-state clusters, indicating parallel rather than single-origin targeting pressure on the sector.
Edge appliance and identity exposure: Three separate Fortinet products appear among targeted technologies alongside Active Directory, VPN solutions, and routers. This combination points to threat actor interest in network edge compromise followed by lateral movement through identity infrastructure. Organizations with unpatched perimeter appliances or exposed directory services face the highest immediate risk.
Geographic targeting: The United States and Japan lead in victim count by a wide margin, followed by the United Kingdom, Australia, India, South Korea, and Taiwan. North America and the Indo-Pacific corridor are expected to remain primary target zones, with sustained exposure across Western Europe and Southeast Asian professional services markets.
Multi-actor threat profile: China-linked, Russia-linked, North Korean, Iranian, and Pakistani state actors feature alongside financially motivated groups and several regional cybercriminal actors, the broadest actor representation recorded this period. Defenders should prioritize TTP-based detection over actor-specific IOC tracking given the breadth of actor representation and the overlap in targeted technologies.
Over the past 90 days, DeCYFIR and DeTCT platforms tracked 702 cyber incidents reported publicly. We could identify the industry for 516 of these incidents (74%).
Professional goods & services industry was detected in 8 incidents, which equals 1.5% of the incidents where we knew the industry, ranking 11th out of 14 industries.
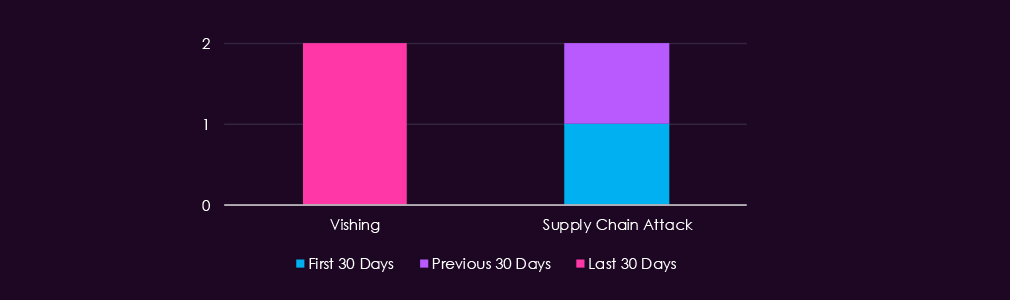
Vishing and supply chain attacks were the only techniques identified, each appearing twice. Vishing was concentrated entirely in the last 30 days, while supply chain attacks were split across the first and previous 30 days. The limited technique diversity reflects the overall low incident volume for this sector and the broader limitation that public reporting on professional services firms is structurally weaker than other sectors.
Professional goods and services ranked eleventh of fourteen sectors, with a flat count across the 90 days period. This low count suggests that public reporting covers limited information, as this sector holds other organizations’ data as a condition of business. Consequently, its incidents are read by clients rather than the market, and the incentive to disclose is weaker.
Data extortion accounted for most of the incidents. ShinyHunters, the most-reported actor, was behind four of the 8 incidents: BCD Travel with 396,313 accounts on June 5, CFGI with 248,235 on June 18, a claimed Brinks Home breach with a leak threat on July 30, and Inter-Con Security with 276,114 on August 5. Paidwork added 23.3 million accounts on July 19. None of this was targeted for the industry; it was opportunistic extortion of exposed platforms. The sector’s exposure lies in what leaks, which describes other companies’ employees, travel patterns, and site access, rather than the victim’s own operations.
One campaign was deliberately aimed at the sector. The Silent Ransom Group was reported on June 7 and 8, running an escalating extortion campaign against US law firms using fake IT support calls. Voice-based social engineering works here because staff are distributed across client sites, partner-level users can quickly authorize access, and help desks are often outsourced or thin outside business hours. Legal privilege multiplies the leverage, as the threat is not simply publication but a breach of client confidentiality. No technical control removes this, but help-desk callback procedures do.
Risk traveled along supplier chains, not directly to targets. Ernst & Young disclosed a breach on July 17, originating in a support system. LexisNexis shut down services on August 10, taking offline a research platform needed by other firms. On August 21, US Bank stated breach claims were related to a fourth-party incident, a supplier of one of its suppliers. Professional firms, sitting at the second and third tiers of large supply chains, propagate risk, not merely end it.
Two narrower findings are worth noting. On August 3, attackers stole 31,000 records identifying people behind Liechtenstein companies and foundations, data held by corporate service providers. On June 24, the Mistic backdoor was linked to ransomware access broker KongTuke and observed across professional services, a reminder that quiet intrusions can become inventory resold and converted into extortion weeks later, often by a different actor.
Web application exposure has sharply changed. External reporting documents five to seven unauthenticated file-upload-to-remote-code-execution vulnerabilities in PHP-based CMS plugins within a month, including Forminator Forms and Everest Forms at CVSS 9.8, affecting 300,000 and 100,000 sites, respectively. Elementor Pro, Avada, and GiveWP, along with PHP core patches on August 3 and 6, also affected these vulnerabilities. This volume exceeds baseline, and the bug class is concerning as it requires no credentials, user interaction, or chaining. Exploitation is already industrialized, as evidenced by a BdThemes plugin supply-chain compromise on August 10, the unmasking of the StopAndProtect operation on August 18, and miniOrange authentication bypass attacks on August 24. Professional firms are disproportionately exposed due to their small public web estates, reliance on WordPress, marketing agency maintenance, and lack of patching for client data. Serving malware from their websites damages their confidentiality proposition.
Two caveats exist. No state-linked activity was reported, suggesting a disclosure gap rather than a real absence, as government and defense clients are established espionage targets and such intrusions are rarely disclosed. The link between the August vulnerability cluster and this sector is inference from how these firms run their web estate, not an observed finding, as no incident shows a professional services firm compromised through a WordPress plugin during this period.

Threat level for the professional goods and services sector over the next 90 days is assessed as elevated risk. Low public incident volume reflects structural under-disclosure rather than low actual exposure.
The following developments are anticipated based on current trends, actor capabilities, and operational patterns:
Opportunistic Data Extortion as Background Risk. ShinyHunters and similar mass extortion actors will continue targeting exposed platforms regardless of sector. Professional firms holding large employee and client datasets remain in scope. The risk is not direct targeting but collateral exposure through platforms the sector relies on.
Voice-Based Social Engineering Against Law Firms. The Silent Ransom Group’s vishing campaign against US law firms is an operationally proven model combining low technical complexity with high leverage. Fake IT support calls exploiting distributed staff and outsourced help desks are likely to continue and expand to other professional services verticals where similar structural conditions apply.
Supply Chain as Primary Propagation Path. Ernst & Young, LexisNexis, and the US Bank fourth-party incident confirm that professional services firms are active nodes in supply chain risk, not endpoints. Breaches at this tier affect multiple downstream clients simultaneously, meaning impact consistently exceeds what public incident counts suggest.
Web Application Vulnerability Exploitation. The volume and severity of PHP-based CMS plugin vulnerabilities reported this quarter exceeds baseline. Exploitation is already industrialized. Professional firms relying on WordPress and marketing agency-maintained websites without active patching programs face concrete near-term exposure.
Over the past 90 days, CYFIRMA’s telemetry has identified 2,578 mentions of professional goods & services organizations out of a total of 20,037 industry-linked mentions. This is from a total of 300k+ posts across various underground and dark web channels and forums.
Professional goods & services organizations landed on 3rd place out of 14 industries in the last 90 days with a share of 12.87% of all detected industry-linked chatter.
Below is a breakdown by a 30-day period of all mentions.
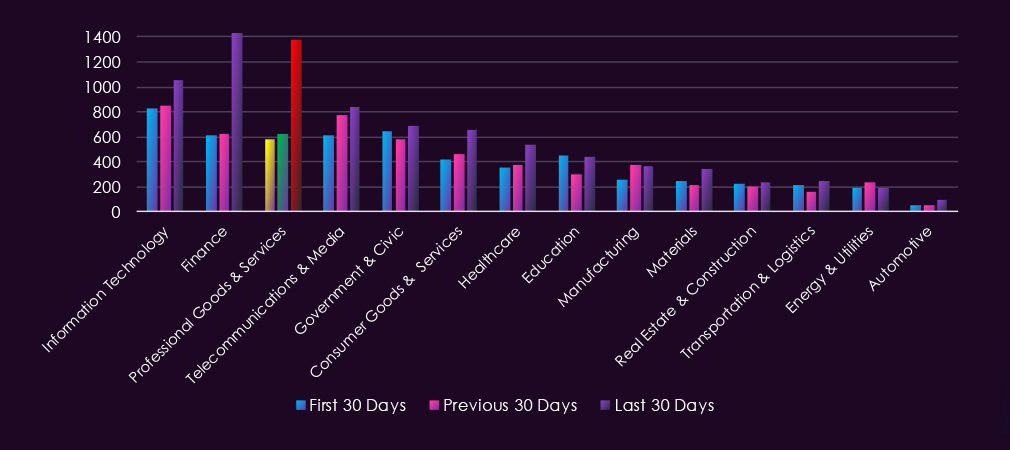
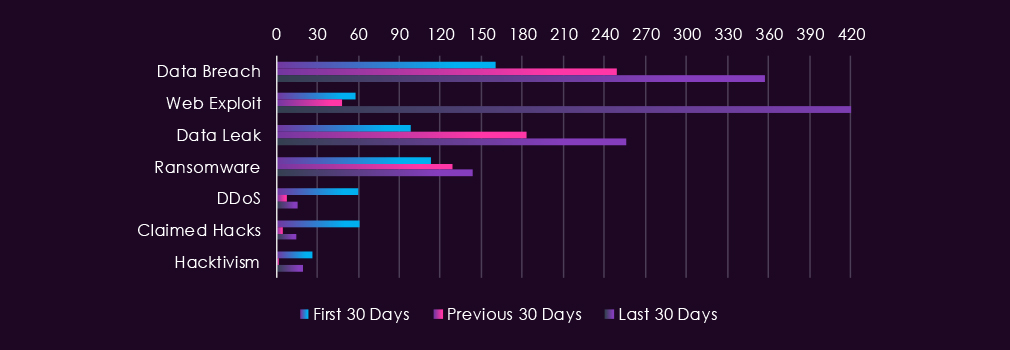
Underground & dark web chatter related to the professional goods & services sector over the last 90 days is dominated by data breach and data leak discussions, both of which rise consistently across all three periods. Web exploit mentions surge in the final period to become the sector’s largest single category, coinciding with a dense cluster of high-severity PHP and WordPress plugin disclosures. Ransomware mentions rise steadily across the window. DDoS, claimed hacks and hacktivism all drop sharply after the first period and remain at reduced levels.

Professional goods & services carries one of the highest chatter volumes in this report, with breach, leak, and ransomware discussions all rising across every period rather than declining. A concentrated wave of web exploit activity in the final period adds an immediate and actionable exposure on top of that trend. The combination of sustained growth across data-focused categories and an active exploitation window is the primary driver of the high score.
Web Exploit and PHP Plugin Exposure: The final-period surge coincides with an unusually dense run of high-severity disclosures across PHP core, WordPress and widely deployed plugins, including multiple unauthenticated file-upload-to-RCE flaws affecting hundreds of thousands of sites. Chatter of this type reflects exploit listings, proof-of-concept sharing, scanning tool updates and webshell kit sales rather than confirmed compromise. Professional services firms run client-facing and marketing sites on these platforms at high rates and often outside core IT patch management, making this the sector’s most immediate remediation priority.
Data Breach and Data Leak: Both rise in every period, with breach chatter more than doubling and leak chatter more than tripling over the window. Professional services firms hold client records, contracts, financial documentation and privileged access into client environments, which retain resale value beyond the firm itself. Growth against a declining sector-wide backdrop indicates genuine sustained targeting rather than a monitoring artefact.
Ransomware: The only category rising steadily in every period without volatility. Professional services firms combine high-value client data with limited tolerance for operational interruption and, in many cases, smaller security functions than the clients they serve. Web application compromise via the plugin flaws above is a plausible initial access route into that outcome.
Client Access as an Attack Path: Accountants, consultancies, law firms and agencies hold credentialed access into client systems and data. Compromise of a single firm can convert into exposure across multiple downstream organisations that were never individually targeted, which makes this sector’s rising breach and leak volumes relevant beyond the sector itself.
DDoS, Claimed Hacks and Hacktivism: All three fall sharply after the first period and remain low. The retreat in claim-based and disruption categories, set against climbing breach, leak, ransomware and exploit volumes, points to a shift in attacker focus toward access acquisition and data theft rather than reduced interest in the sector.
Over the past 90 days, CYFIRMA’s telemetry has identified 161 mentions of professional goods & services organizations out of a total of 2,632 industry mentions. This is from over 10k CVEs reported and updated in the last 90 days.
Professional goods & services organizations ranked 4th out of 14 industries in last 90 days with share of 6.12% of all detected industry-linked vulnerabilities.
Below is a breakdown by 30-day periods of all mentions.
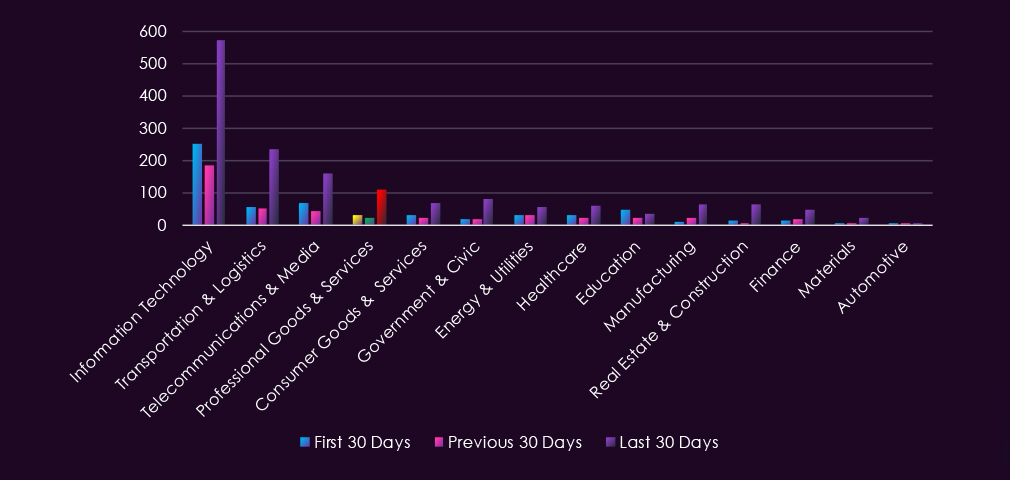
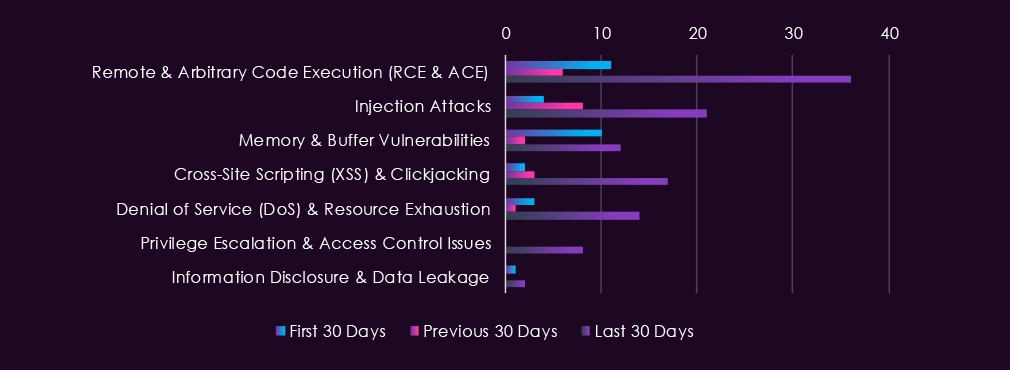
Reported CVEs in the professional goods & services sector over the last 90 days are concentrated heavily in the final period, with every category rising sharply. Remote and arbitrary code execution more than triples from initial levels to become the dominant category. Cross-site scripting and denial of service both rise several-fold, while injection attacks more than double. Memory and buffer vulnerabilities dip mid-period before recovering above initial levels, and privilege escalation appears only in the final period. Information disclosure remains minimal throughout.

Professional goods & services show a sharp final-period concentration in reported vulnerabilities, with every category rising and remote code execution dominant. Attribution of CVEs to industry is inherently imprecise, since disclosures are filed against products rather than sectors, and the final-period rise is visible across all fourteen industries rather than this one alone. What supports the high score is the correspondence between this vulnerability profile and the sector’s own chatter, where web exploit activity surged in the same window.
Remote & Arbitrary Code Execution: More than triples in the final period to become the dominant category. This aligns closely with the concentrated run of unauthenticated file-upload-to-RCE flaws disclosed across PHP core, WordPress, and widely deployed plugins during the same window. Professional services firms run client-facing and marketing sites on these platforms at high rates, frequently outside core IT patch management, which makes this the sector’s most immediate remediation priority.
Cross-Site Scripting and Injection: Both rise several-fold in the final period. Cross-site scripting growth is consistent with the disclosed XSS-to-webshell chains in the same disclosure cluster, where client-side flaws served as the entry point to server-side compromise rather than as an endpoint in themselves. These categories should be read together with RCE rather than separately.
Chatter Corroboration: The sector’s underground chatter shows web exploit mentions surging in the same period to become its largest single category. Two independent data sources moving together, one measuring disclosure and the other measuring attacker discussion, is a stronger signal than either alone and reduces the likelihood that this is a classification artefact.
Denial of Service and Privilege Escalation: Denial of service rises several-fold, and privilege escalation appears for the first time in the final period. Combined with sustained code execution exposure, privilege escalation is the lateral movement risk following initial web application compromise, which is a material concern in firms holding credentialed access into client environments.
Client Access as an Attack Path: Accountants, consultancies, law firms and agencies hold privileged access into client systems. A web application compromise at a single firm can convert into exposure across multiple downstream organisations that were never individually targeted, which makes public-facing site patching disproportionately consequential in this sector.
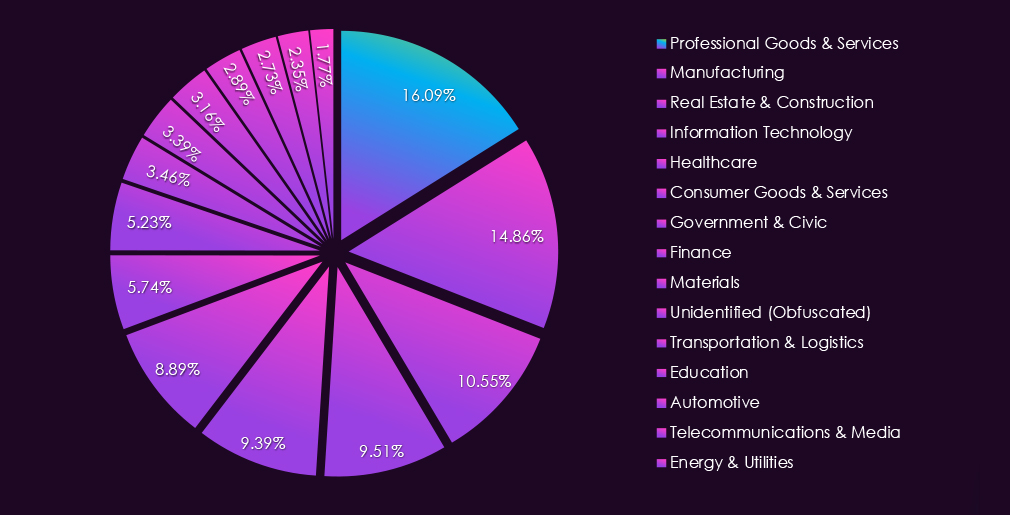
In the past 90 days, CYFIRMA has identified 418 verified ransomware victims in professional goods & services organizations. This accounts for 16.09% of all 2,598 ransomware victims during the same period, placing this sector 1st out of 14 industries.
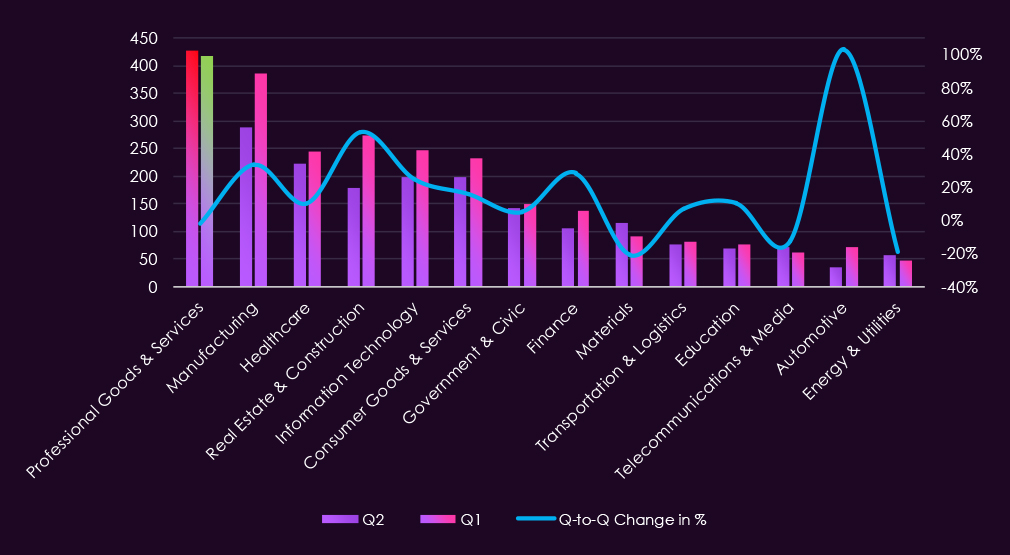
Furthermore, a quarterly comparison shows that the number of victims in professional goods & services organizations has been sustained. It went down mildly from 428 to 418 victims and a minor -2.3% decrease. The overall interest, represented by the share, also went down from 18.92% to 16.08% of all victims.
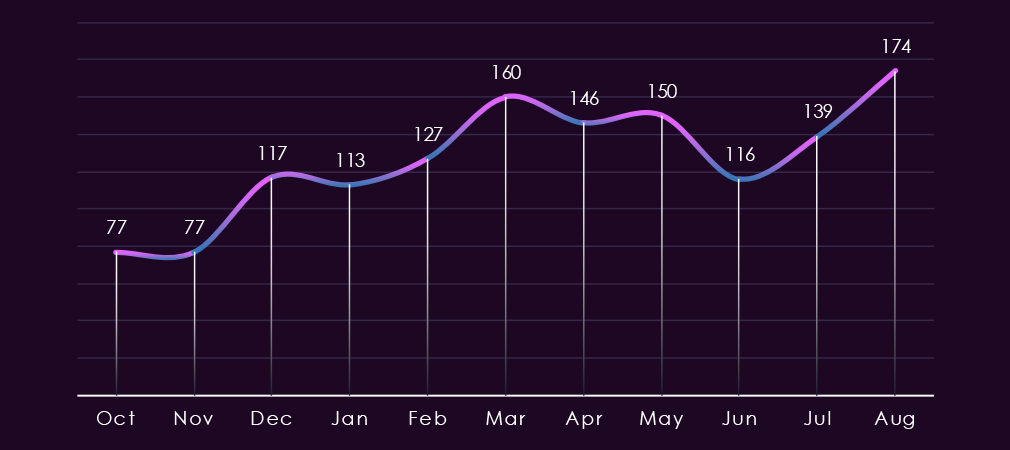
Monthly activity shows a choppy but clear upward trend. Growth is clear from October to May. Activity then hit plateau and recorded a dip during June, only to rebound and record a new high during August.
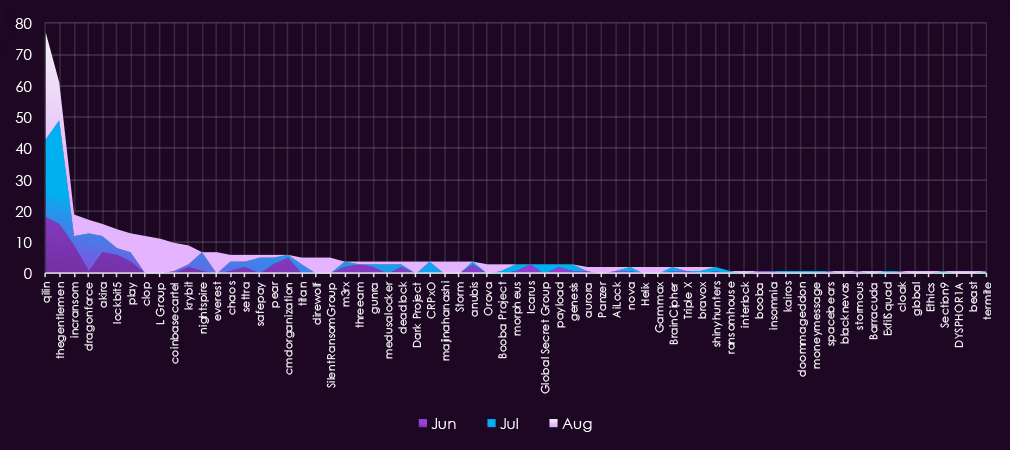
Qilin and Thegentlemen dominated the period, together accounting for roughly a third of all sector victims. Qilin escalated steadily across all three months, rising from 18 in June to 34 in August. Thegentlemen peaked sharply in July with 33 victims before falling back to 12 in August.
August brought a notable shift in the wider actor set. Clop, L Group, Everest, Direwolf, and SilentRansomGroup all recorded their first sector victims that month (new and returning groups), with Coinbasecartel also escalating from a single July victim to nine. This influx of newly active groups is the primary driver behind August reaching the period high of 174 victims.
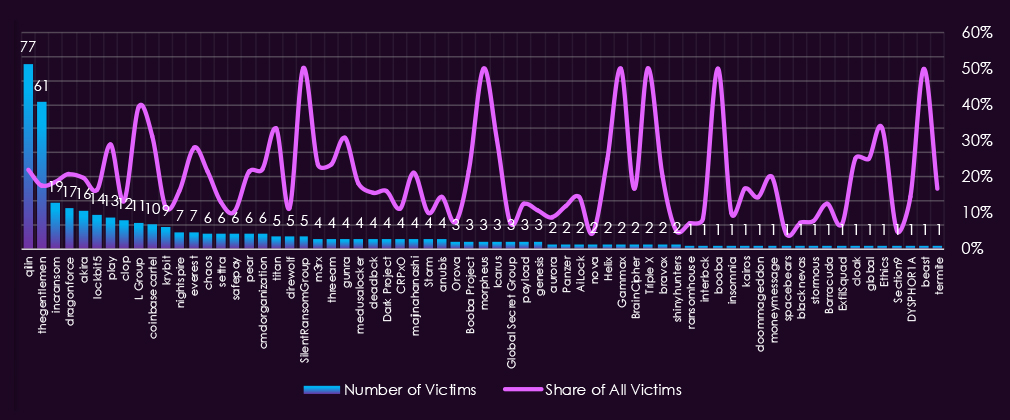
Out of the 99 gangs, 67 recorded victims in the professional goods & services industry in the last 90 days, representing a 68% participation rate.
Qilin and Thegentlemen had the highest numbers of victims by a wide margin, and both also devoted a substantial share of their overall activity to this sector, at 21.8% and 17.5% respectively.
SilentRansomGroup, Morpheus, Gammax, Triple X, Booba, and Beast each recorded 50% of their victims in this sector, though all are low-volume gangs. Among higher-volume groups, L Group (39.3%), Titan (33.3%), and Coinbasecartel (31.3%) show the strongest sector focus.
On average, gangs active in this industry recorded a 19.8% share of their victims from this industry. That is about 1 in 5 victims.
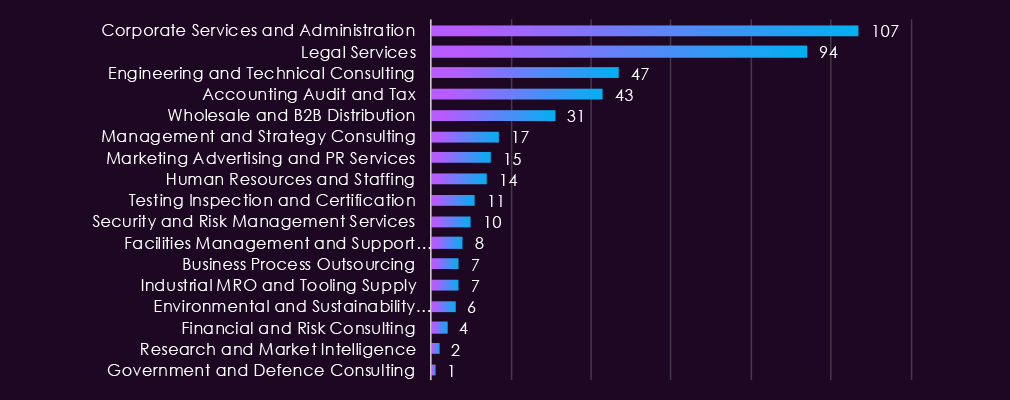
Corporate Services and Administration and Legal Services accounted for the largest share of victims by a wide margin, together representing close to half of all sector victims. Both handle concentrated volumes of confidential client and corporate records, giving attackers strong leverage for extortion beyond operational disruption alone.
Engineering and Technical Consulting, Accounting Audit and Tax, and Wholesale and B2B Distribution formed a substantial second tier. Victims were recorded across all 17 tracked subsectors, from management consulting and marketing through to research and government advisory, confirming that no segment of this vertical was left untouched during the period.
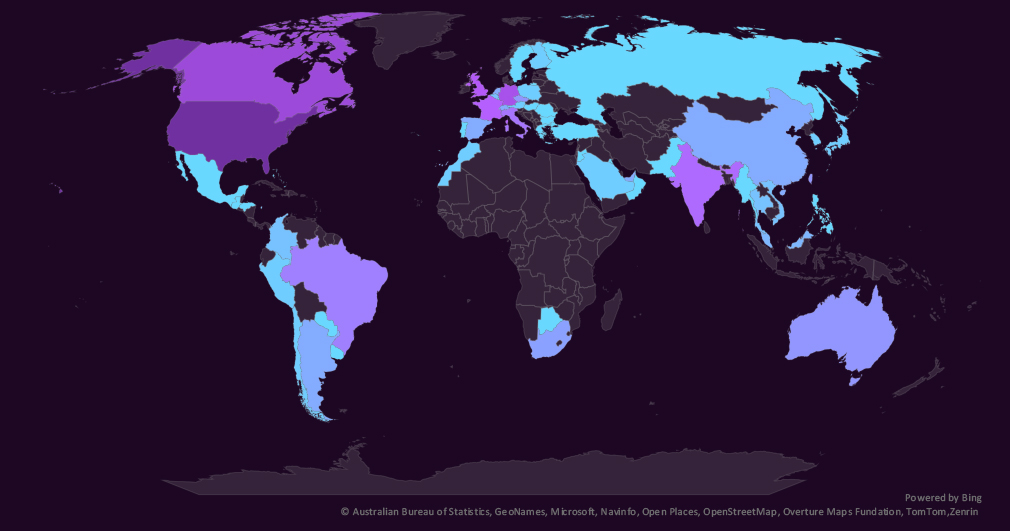
The geographic distribution heatmap underscores the widespread impact of ransomware, highlighting the countries where victims in this industry have been recorded.
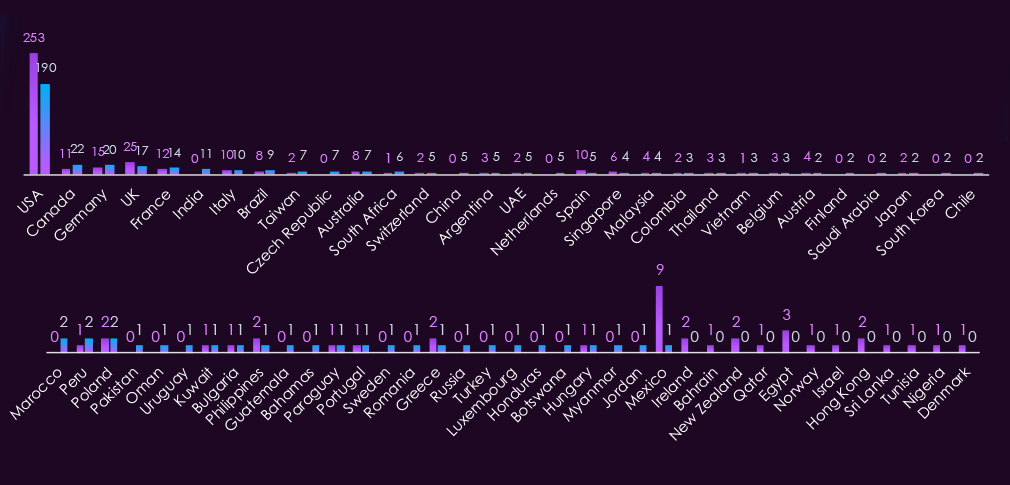
Professional goods & services victimology shows the USA being the most targeted, accounting for 46% of all victims.
Remaining activity is distributed among 54 countries for 418 victims.
Canada and India recorded the highest elevations in the last 90 days, both rising by 11 victims, followed by the Czech Republic, Germany, Taiwan, and South Africa.
The USA, the UK, and Mexico saw the largest declines.
In the last 90 days, 55 countries recorded professional goods & services victims, 11 more than the 44 countries in the previous period.

The Professional Goods & Services sector threat landscape is expected to remain at high through the next 90 days. This sector ranks 1st of 14 industries at 16.09% of all ransomware victims, and while volume dipped marginally quarter-on-quarter from 428 to 418, August recorded a period high of 174 victims. The combination of the highest gang participation rate observed across any sector, an expanding actor set, and widening geographic reach supports a forward posture of sustained high-tempo targeting.
Volume outlook: Monthly activity has trended clearly upward since October, rising from 77 to a period high of 174 in August. The June dip to 116 proved temporary, with July and August both rebounding strongly. A baseline of 440 to 490 victims over the next 90 days is the most plausible outcome, with upside risk if the groups that entered the sector in August sustain their current tempo.
Actor behaviour: 67 of 99 active gangs recorded professional goods & services victims, a 68% participation rate that is the highest observed across any sector and confirms this vertical as a near-universal target. Qilin escalated consistently across the period and is expected to maintain or increase tempo, while Thegentlemen remains a major contributor despite its August decline. Clop, L Group, Everest, Direwolf, and SilentRansomGroup all entered the sector in August as new or returning groups, and further expansion of the active actor set is probable.
Specialist targeting risk: The average sector share across all active gangs is 19.8%, roughly one in five victims. SilentRansomGroup directs half its activity here, and L Group, Titan, and Coinbasecartel each exceed 30%. This breadth of proportional focus indicates deliberate sector selection across a wide portion of the actor set rather than incidental targeting.
Geographic targeting: Country coverage expanded from 44 to 55, the widest spread recorded for this sector. Canada and India each gained 11 victims, with the Czech Republic, Taiwan, and South Africa also rising sharply from low or zero baselines. The USA remains dominant at 46% despite a substantial absolute decline, and the redistribution of volume toward Asia-Pacific and Central Europe is expected to continue.
Subsector risk: Corporate Services and Administration and Legal Services represent the highest-risk subsectors. Legal firms warrant particular attention given that a single compromise can expose privileged material spanning many client organisations, making them disproportionately valuable targets relative to their victim count alone.
APT Campaigns (High): Professional goods & services featured in 55 of 96 observed campaigns (57%), a five-fold increase in absolute terms from 11, with share holding steady against 58% previously. Sustaining share through a five-fold expansion of the overall campaign pool indicates the sector scaled with the threat rather than being diluted by it. MISSION2074 led campaign counts followed closely by Stone Panda, with Lazarus Group third overall, placing two distinct nation-state clusters at the top of the actor set and indicating parallel rather than single-origin targeting pressure. Twelve China-aligned groups feature alongside Russian, Iranian, and Pakistani state actors and financially motivated groups. The technology profile is the sharpest finding, with three separate Fortinet products recorded alongside Active Directory, VPN solutions, and routers, pointing to network edge compromise followed by lateral movement through identity infrastructure. Victim distribution spans 40 countries, the widest recorded.
Reported Cyber Incidents (Elevated): Low reported volume reflects structural under-disclosure rather than low exposure. Firms in this sector hold other organisations’ data as a condition of business, so incidents are read by clients rather than the market and the incentive to disclose is weaker. Most reported activity was opportunistic data extortion by ShinyHunters against exposed platforms, where the sector’s exposure lies in what leaks, describing other companies’ employees, travel patterns, and site access rather than the victim’s own operations. One campaign was deliberately aimed at the sector: the Silent Ransom Group ran escalating extortion against US law firms using fake IT support calls, a model that works because staff is distributed across client sites, partner-level users can authorise access quickly, and help desks are often thin or outsourced. Risk travelled along supplier chains rather than directly to targets, with Ernst & Young originating in a support system, LexisNexis taking a research platform other firms depend on offline, and US Bank attributing breach claims to a fourth-party incident.
Underground & Dark Web Chatter (High): The sector placed 3rd of 14 at 12.87% of all industry-linked chatter with 2,578 mentions. Breach, leak, and ransomware discussion all rose in every period, with breach chatter more than doubling and leak chatter more than tripling across the window, running counter to the declining pattern seen across most other sectors during the same forum disruption. Web exploit mentions surged in the final period to become the sector’s largest single category, coinciding with a dense cluster of high-severity PHP and WordPress plugin disclosures. Firms in this sector run client-facing and marketing sites on those platforms at high rates, frequently outside core IT patch management. DDoS, claimed hacks, and hacktivism all fell sharply and stayed low, a retreat in claim-based activity set against climbing data-focused volumes.
Vulnerabilities (High): The sector ranked 4th of 14 at 6.12% of industry-linked disclosures across 161 mentions, concentrated heavily in the final period with every category rising. Remote code execution more than tripled to become dominant, aligning with the concentrated run of unauthenticated file-upload-to-RCE flaws disclosed across PHP core, WordPress, and widely deployed plugins in the same window. Cross-site scripting and injection both rose several-fold and should be read alongside RCE rather than separately, since the disclosed chains used client-side flaws as entry points to server-side compromise. Privilege escalation appeared for the first time in the final period, representing lateral movement risk following initial web application compromise, which is material in firms holding credentialed access into client environments. The final-period rise is visible across all fourteen industries, so the sector-specific weight rests on the corroborating chatter surge rather than the disclosure count alone.
Ransomware (High): 418 victims, ranking 1st of 14 at 16.09% of all ransomware victims, with volume down marginally from 428 and share falling more notably from 18.92%. Monthly activity has trended upward since October, and August recorded a period high of 174 after a temporary June dip. Corporate Services and Administration and Legal Services together account for close to half of all sector victims, both handling concentrated volumes of confidential client and corporate records. 67 of 99 active gangs recorded victims, a 68% participation rate that is the highest observed in any sector, and the 19.8% average sector share across active gangs indicates deliberate selection across a wide portion of the actor set. Clop, L Group, Everest, Direwolf, and SilentRansomGroup all entered the sector in August as new or returning groups. Country coverage expanded from 44 to 55, the widest recorded.
