
LANDSCAPE · SECTOR LENS
1 July to 30 September 2026, compared with Q2 2026
2026 to date through 31 October · issued 16 November 2026
Written for healthcare CISOs and security leaders · hospitals and health systems, clinics, senior care, pharma and biotech, device makers, laboratories and payers
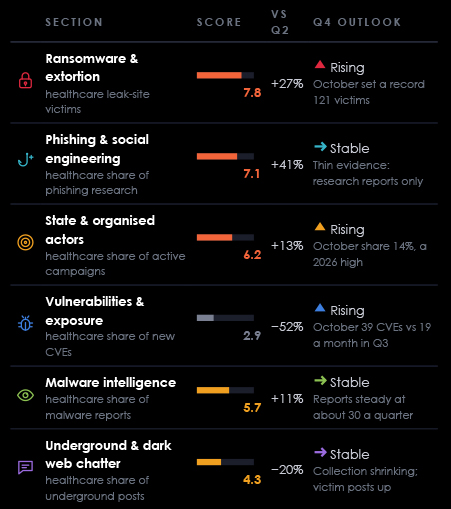
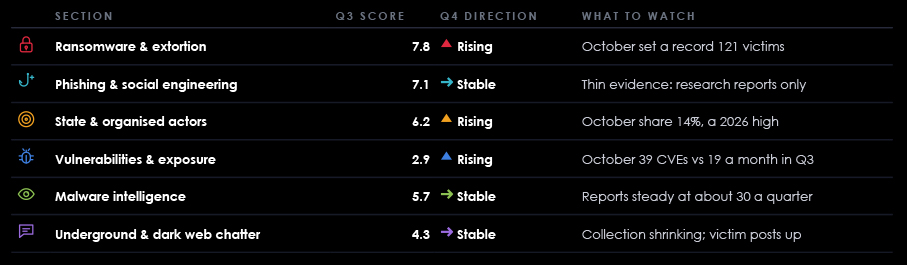
Phishing scored on 17 research reports only: the URL feeds carry no healthcare-labelled URLs (section 04). The vulnerability score is low because total CVE volume rose 79%, not because exposure fell (section 05).
Each panel shows the same measure for Q3 2025, the first three quarters of 2026 and October. Counts are used where collection was steady; shares of the whole dataset are used where collection changed (state actor reporting, CVE volumes, underground and research feeds). The dashed outline on October shows the quarter it would make at the same pace.
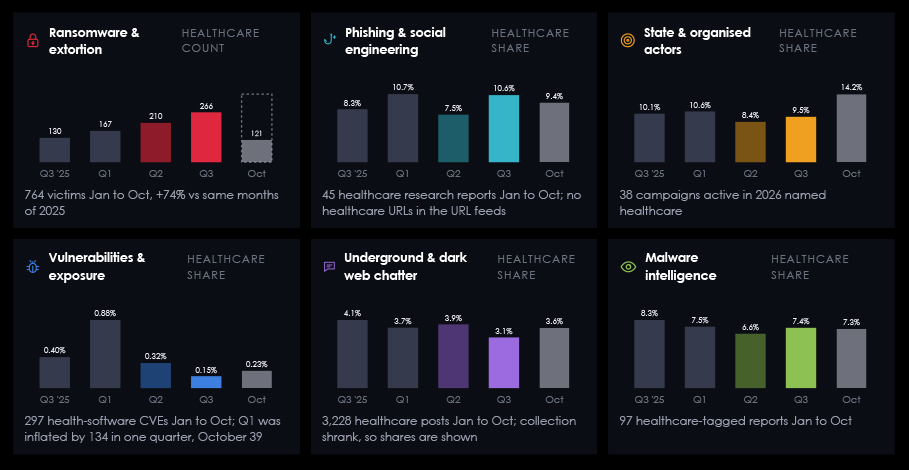
Ransomware against healthcare rose every quarter of 2026 (167, 210, 266) and is already +74% ahead of the same months of 2025. State-actor interest was highest in Q1, dipped in Q2 and partly recovered in Q3 before jumping in October. Health-software vulnerabilities peaked in Q1 (134) and settled near 57 a quarter, while underground chatter about the sector shrank with the collection itself.
October’s 121 healthcare ransomware victims are 36% above the Q3 monthly pace and the highest month we hold. Healthcare’s share of active state-actor campaigns rose to 14%, and 39 health-software CVEs appeared in one month, double the Q3 pace. Malware and phishing research held steady.
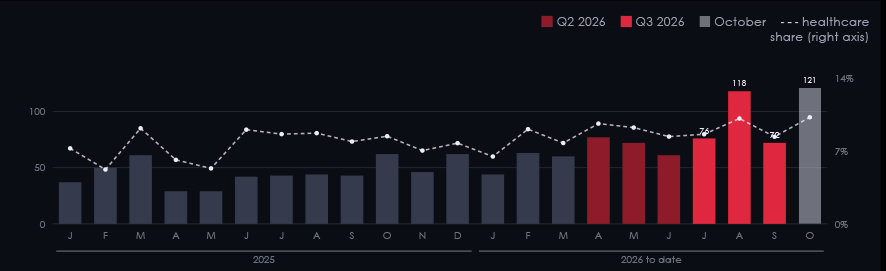
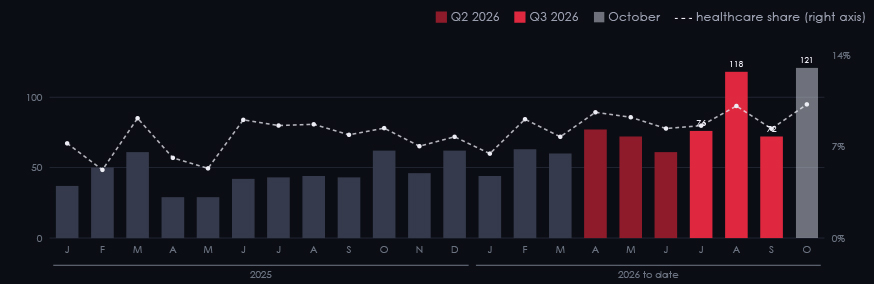
Ransomware groups named 266 healthcare organisations on leak sites in Q3, up from 210 in Q2 and 167 in Q1. August alone posted 118, and every month of Q3 beat every month of 2025.
Healthcare rose with the market, not ahead of it: all sectors grew +26% and healthcare +27%, so its share held at 9.1%. That share makes it the fifth most-listed sector on leak sites.
The quarter was fed by new and small groups: 60 different groups listed healthcare victims (55 in Q2), and 30% of victims came from groups that first posted after 1 April.
October posted 121 healthcare victims, 36% above the Q3 pace of 89 a month and above any earlier month (118). All-sector victims also hit a record 1,184, and healthcare’s share rose to 10.2%.
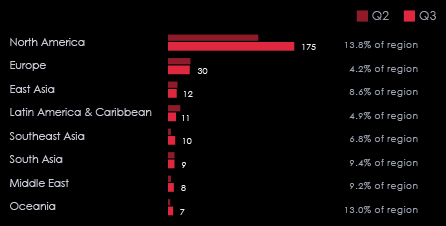
Right: healthcare share of each region’s Q3 victims (worldwide 9.1%). The United States alone accounts for 170 of 266, and North America grew from 125 to 175 while Europe held at about 30. Southeast Asia and Oceania more than doubled from small bases. Africa (4) is not charted.
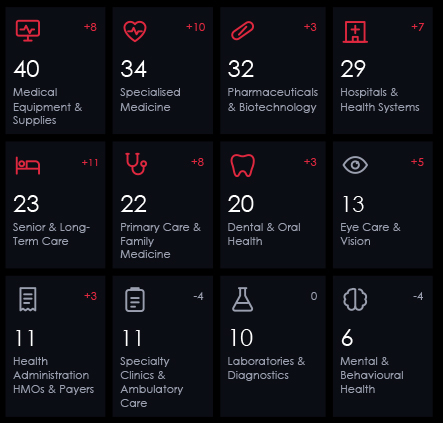
Suppliers are targets too. Medical equipment and supply firms are the most-listed sub-sector (40 victims), ahead of hospitals (29). Senior and long-term care rose from 12 to 23.
groups where healthcare is at least twice the worldwide share (9.1%) of their Q3 victims

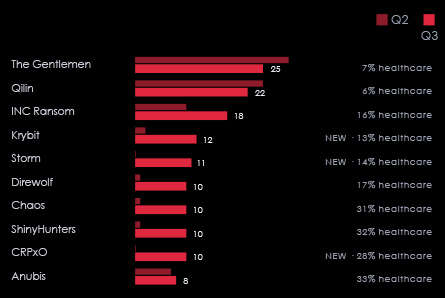
Right: share of the group’s own Q3 victims that are healthcare. NEW = first leak-site post after 1 April 2026.
reports, top 8 groups
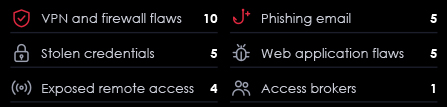
Q3 victims · change vs Q2
| CVE | Product (CISA KEV) | Group | Last Reported |
|---|---|---|---|
| CVE-2026-50751 | Check Point Security Gateway | Qilin | 2026-10 |
| CVE-2026-35273 | Oracle PeopleSoft Enterprise PeopleTools | ShinyHunters | 2026-09 |
| CVE-2024-55591 | Fortinet FortiOS and FortiProxy | Qilin, The Gentlemen | 2026-05 |
| CVE-2023-27532 | Veeam Backup & Replication | Qilin, The Gentlemen | 2026-03 |
| CVE-2025-32463 | Sudo | The Gentlemen | 2026-03 |
| CVE-2024-37085 | VMware ESXi | The Gentlemen | 2026-03 |
| CVE-2024-21762 | Fortinet FortiOS | Qilin | 2025-09 |
Qilin was reported in October using a Check Point Security Gateway flaw (CVE-2026-50751, KEV with known ransomware use). Qilin is a ransomware-as-a-service group; the North Korean group Moonstone Sleet has been reported using it, which does not make Qilin state-run.
▲
Q4 2026 OUTLOOK
RISING
October set a record 121 victims
If October’s pace holds, Q4 ends near 363 healthcare victims, well above Q3. Two things could keep it there: new groups such as Krybit, Storm, CRPxO and Direwolf that already put healthcare above the worldwide share, and the established The Gentlemen, Qilin and INC Ransom (65 victims in Q3).
WHAT TO DO NOW
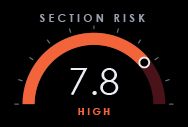
Risk score 7.8 = 35% momentum (healthcare leak-site victims, Q3 vs Q2 +27%, scored 7.1) + 35% level (Q3 vs the Q1 to Q2 average, 1.41x, scored 7.5) + 30% impact weight (9 of 10). Measured as a count. Victims are organisations named on leak sites, dated by post date (not attack date), from CYFIRMA’s curated ransomware log; Q3 classification confidence: 188 high, 76 medium, 2 low.
sparkline: monthly victims Jan to Oct 2026, Q3 shaded
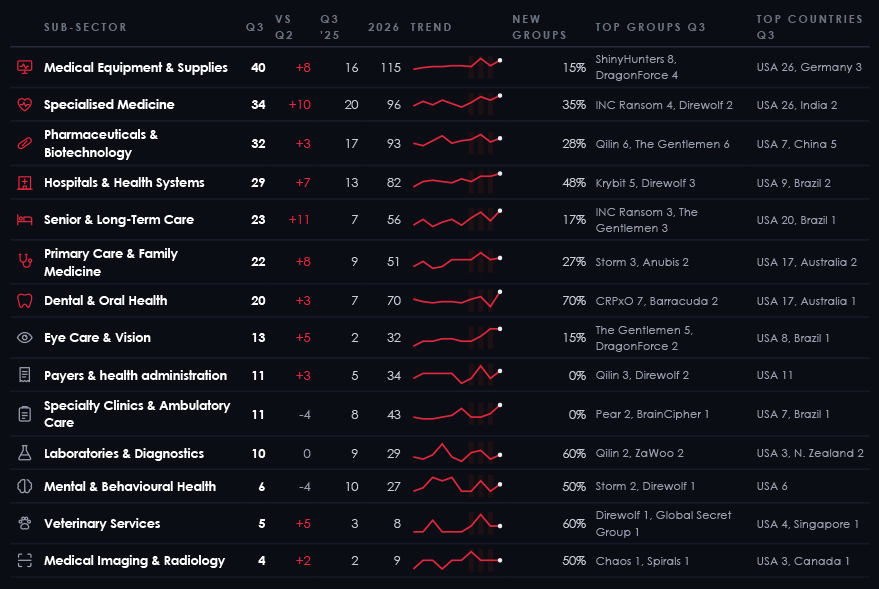
New groups = share of the sub-sector’s Q3 victims posted by groups first seen after 1 April 2026. 2026 = January to October. Counts under 10 are indicative only. Two sub-sectors with fewer than 5 Q3 victims are left out (emergency medical services, alternative and holistic health).
over-representation = healthcare share of the country’s victims ÷ worldwide share (9.1%)
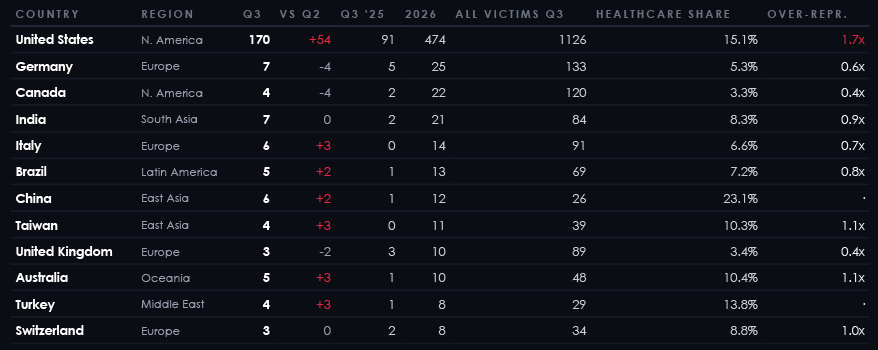
Over-representation shown only where a country posted at least 30 victims of all sectors and 3 healthcare victims in Q3. Above 1.5x (red) healthcare is hit noticeably more often than elsewhere.
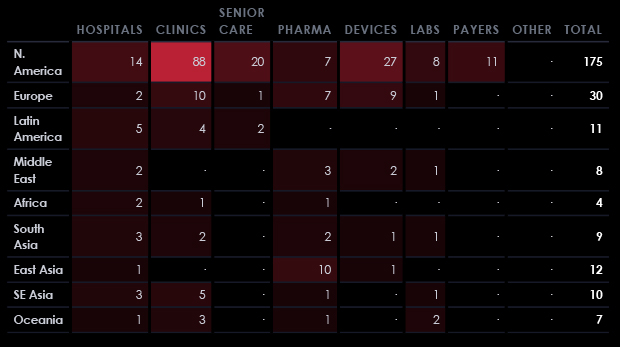
N. AMERICA
The Gentlemen 17 · INC Ransom 12 · Qilin 12
EUROPE
ShinyHunters 5 · Qilin 4 · The Gentlemen 4
LATIN AMERICA
Kazu 2 · Krybit 2 · LockBit 5.0 2
MIDDLE EAST
Black X 1 · Blackwater 1 · Deadlock 1
AFRICA
Krybit 2 · INC Ransom 1 · Orova 1
SOUTH ASIA
Krybit 5 · Global Secret Group 1 · Kazu 1
EAST ASIA
The Gentlemen 3 · Qilin 2 · CRPxO 1 SE ASIA Krybit 2 · Qilin 2 · Coinbase Cartel 1
OCEANIA
INC Ransom 2 · ZaWoo 2 · MedusaLocker 1
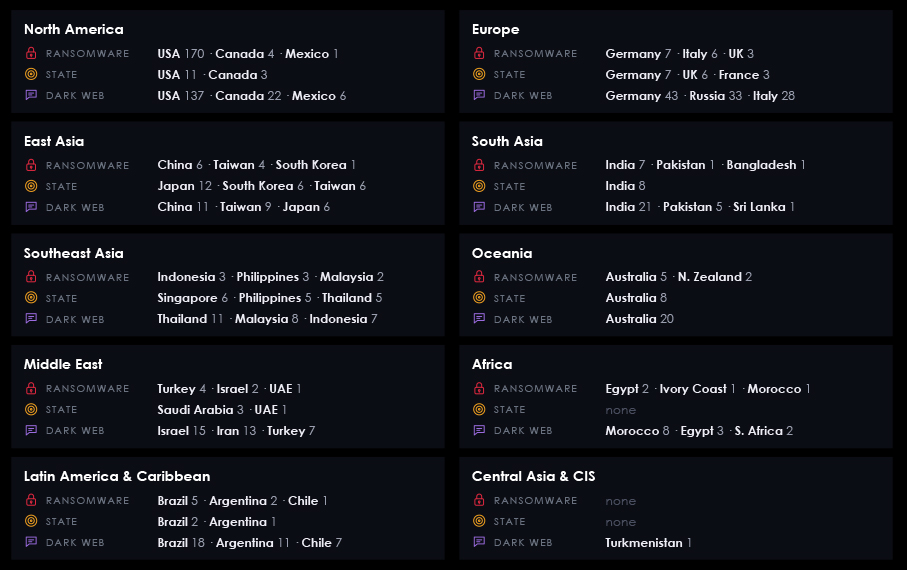
The United States had 170 of 266 healthcare victims (64%), against 39% of all-sector victims there, so healthcare is hit more than average in the US and less in Europe. China and Turkey show a high healthcare share on small numbers.
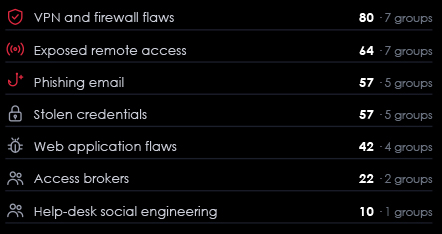
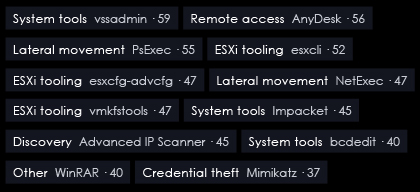
Techniques, tools and access methods reported for the groups that hit healthcare in Q3, weighted by each group’s healthcare victims. Profiles cover 13 of 60 groups (111 of 266 victims, 42%); most small new groups have none yet.
healthcare victims of groups known to use the technique
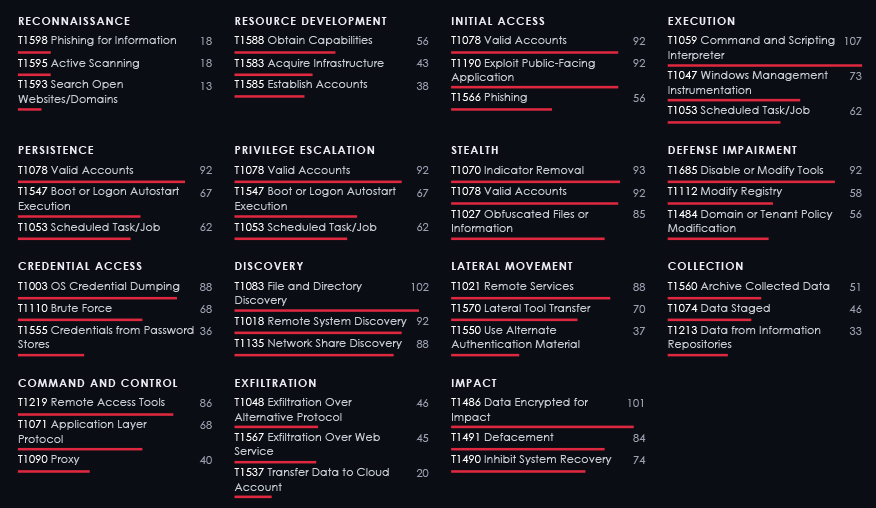
victims · groups
healthcare victims of groups using the tool
Qilin is reported partnering with DragonForce and LockBit 3.0; The Gentlemen are reported to have split from Qilin (a lead for analyst review, not attribution).
LockBit 5.0 continues the LockBit 3.0 family; Lynx is reported as derived from INC Ransom.
What the pattern says. Backup and shadow-copy deletion (vssadmin, bcdedit) appears for groups behind 59 healthcare victims, and ESXi tools (esxcli, vmkfstools) for groups behind 52. Remote-access software (AnyDesk, ScreenConnect) and PsExec are the most common ways to move once inside.
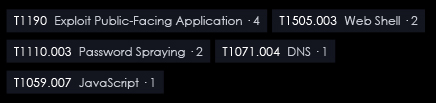
Only 18 of 38 campaigns active in 2026 carry technique detail, so counts are small. Exploiting public-facing applications leads.
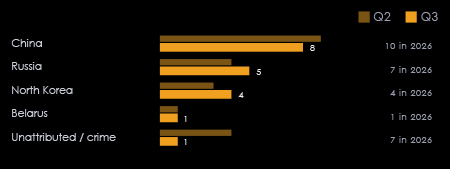
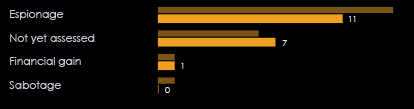
Patient, research and policy data. Espionage is the stated aim of most campaigns that name healthcare: pharma and biotech research, hospital networks and government health bodies. Theft and sabotage are rare in this sector’s campaign record, with one Russian-aligned sabotage campaign starting on 11 October.

▲
Q4 2026 OUTLOOK
RISING
October share 14%, a 2026 high
Healthcare was named in 14% of campaigns active in October, the highest share this year, even as total campaign counts fell with late reporting. Expect China- and Russia-linked espionage against pharma, research and hospital networks to continue, with exploitation of internet-facing applications as the main entry. Totals for recent months will rise as late reports arrive.
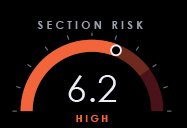
Risk score 6.2 = 35% momentum (healthcare share of active campaigns, Q3 vs Q2 +13%, scored 6.0) + 35% level (Q3 vs the Q1 to Q2 average, 1.00x, scored 5.0) + 30% impact weight (8 of 10). Measured as a share. Campaigns count when active in the quarter. APT reporting is delayed by nature, so recent counts are incomplete; shares are compared. Healthcare is named in few campaigns (19 in Q3), so small changes move the share. 79% of Q3 healthcare campaigns come from CYFIRMA early-warning collection.
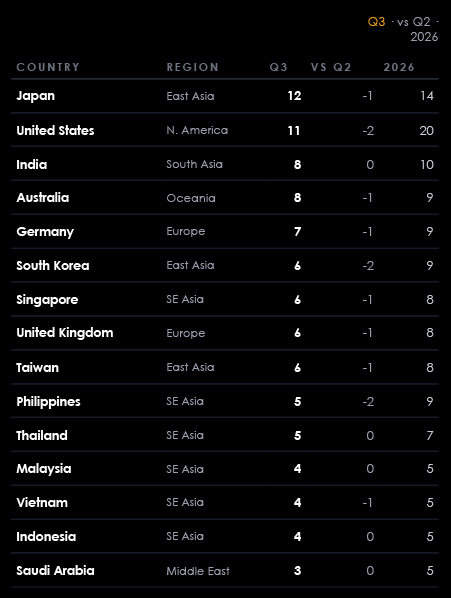
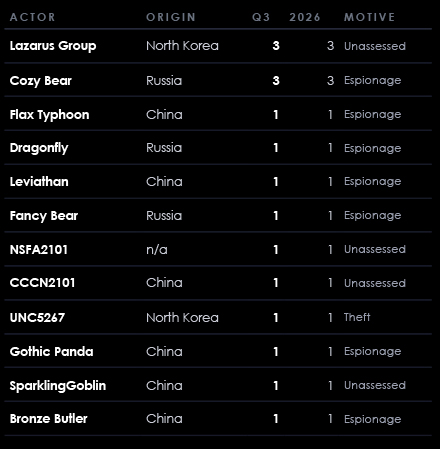
Campaigns active in the period. Lazarus Group and Cozy Bear are linked to 3 healthcare campaigns each in 2026, the most of any actor; no actor stands out, which fits a sector targeted opportunistically for data rather than by specialists.

A campaign that names several regions counts once in each. CYFIRMA early-warning campaigns name about six countries each, which lifts Asia-Pacific counts.
Techniques reported for healthcare campaigns active in 2026 (18 of 38 campaigns have technique detail). Counts are campaigns using the technique.
healthcare victims of groups known to use the technique
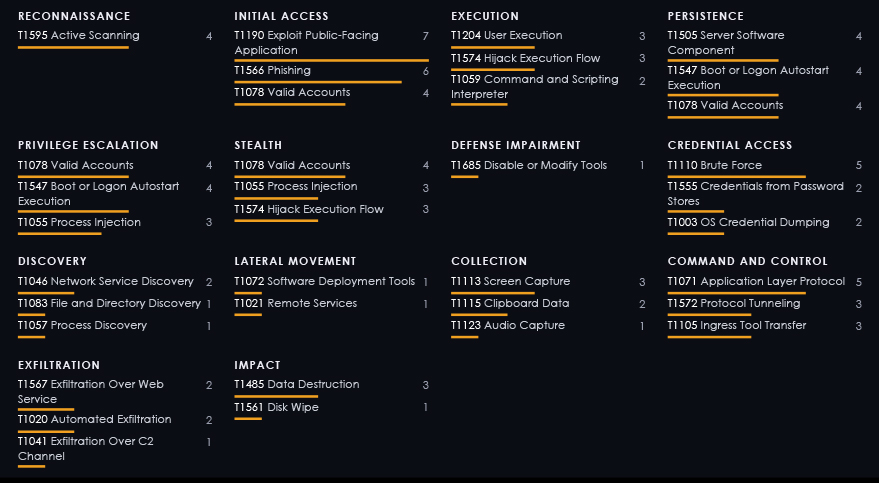
campaigns, 2026
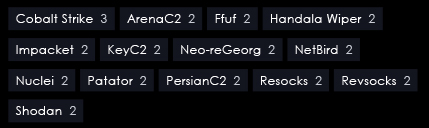
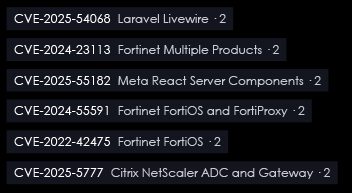
campaigns, 2026
Offensive security tools are everywhere. Cobalt Strike, Impacket, Nuclei, Ffuf and Patator appear alongside custom command-and-control. One October China-linked campaign used the open-source ARTEX AI attack agent against targets in Belgium, the United States and the Philippines.
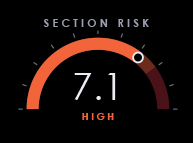
CYFIRMA’s phishing URL feeds classify each URL by the brand it imitates. Banks, telecoms, retailers, technology and logistics brands are in the lists; healthcare brands almost never are, so none of 326,071 URLs this year carries a healthcare label. That absence is a limit of the method, not evidence that healthcare is not phished.
The only phishing signal that names the sector is public threat-sharing research: 17 reports in Q3, 10.6% of 161 phishing reports, up from 11 in Q2. The numbers are small, so the Q2 to Q3 rise (+55%) is a hint, not a trend.
Phishing and stolen credentials each appear as a reported way in for groups behind 57 and 57 healthcare ransomware victims in Q3, close behind VPN and firewall flaws (80). Staff credential phishing, rather than brand-impersonation kits, is the likelier form in this sector.
Score confidence is low. The phishing risk score rests on research-report counts alone. Treat it as an indication until a healthcare brand and portal watchlist feeds the URL data.
→
Q4 2026 OUTLOOK
STABLE
Thin evidence: research reports only
Expect phishing to stay a steady entry route rather than a rising one. Without sector-labelled URLs the quarter-on-quarter change cannot be measured reliably; October’s five reports are in line with the Q3 monthly pace of about six.
WHAT TO DO NOW
Risk score 7.1 = 35% momentum (healthcare share of phishing research, Q3 vs Q2 +41%, scored 8.3) + 35% level (Q3 vs the Q1 to Q2 average, 1.16x, scored 6.0) + 30% impact weight (7 of 10). Measured as a share. Counted from public threat-sharing research pulses that discuss phishing and carry a healthcare tag; the URL feeds contribute no healthcare data.
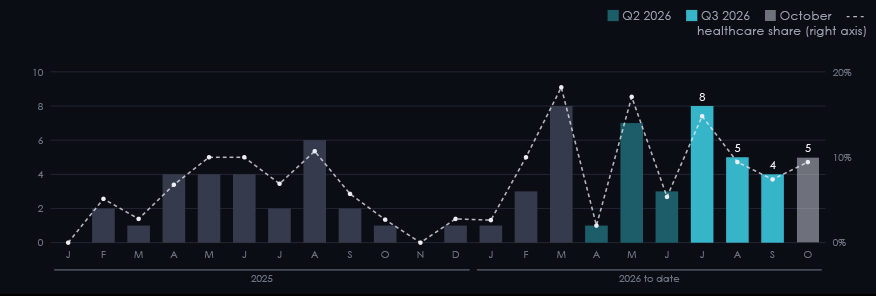
published CVEs per quarter · October ghosted

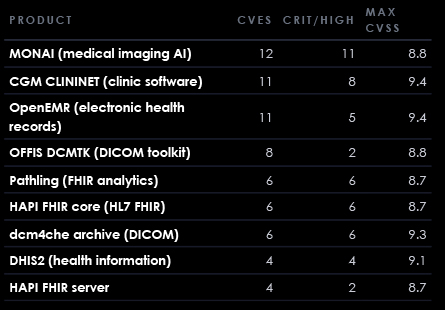
Sector tags come from product and vendor names, so a few false matches are possible; one Oracle database tool matched on the word “health” and is removed.
Open-source health platforms are the pattern. MONAI, OpenEMR, dcm4che, HAPI FHIR and DHIS2 are community projects that hospitals and health ministries run themselves. Patching depends on the operator, not a vendor service.
▲
Q4 2026 OUTLOOK
RISING
October 39 CVEs vs 19 a month in Q3
October already counts 39 health-software CVEs, twice the Q3 monthly pace, and the wider flow of exploited flaws keeps accelerating: CVE-to-exploitation time halved to 5 days. The more important Q4 question is exposure, covered on the next page.
WHAT TO DO NOW
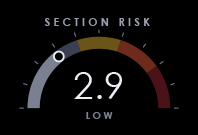
Risk score 2.9 = 35% momentum (healthcare share of new CVEs, Q3 vs Q2 −52%, scored 0.8) + 35% level (Q3 vs the Q1 to Q2 average, 0.26x, scored 0.5) + 30% impact weight (8 of 10). Measured as a share. Healthcare CVEs are tagged by CYFIRMA from vendor and product names (high-confidence tags only). CISA KEV figures cover all sectors.
A snapshot of internet-facing systems that identify themselves as clinical or healthcare-named, from CYFIRMA internet exposure monitoring (single snapshot, 2026-11-12; aggregate counts only). Detection is by banner, page title and organisation name, so the counts are a floor, and sums across rows overlap.
| System | Hosts | Countries | With KEV Flaw |
|---|---|---|---|
| DICOM imaging servers | 7,194 | 122 | · |
| OHIF imaging viewers | 850 | 54 | · |
| FHIR servers | 232 | 35 | · |
| Orthanc imaging servers | 114 | 28 | · |
| OpenMRS record systems | 95 | 21 | 1 |
| DHIS2 health information | 94 | 28 | · |
Hosts
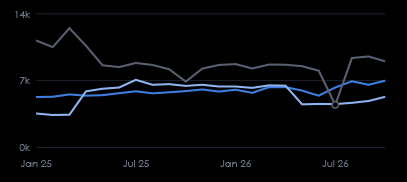
DICOM servers rose from 5,113 to 6,758 (+32%); clinic-named hosts rose by half; hospital-named hosts fell by about a third (35k to 25k); the grey line is NHS-named hosts.
| Signal | Hosts | Countries | With KEV Flaw |
|---|---|---|---|
| .health domains | 50,337 | 113 | 34 |
| Hosts of organisations named hospital | 13,050 | 59 | 7 |
| .nhs hostnames | 9,551 | 45 | 1 |
| Organisations named healthcare | 8,624 | 36 | 3 |
| Organisations named laboratories | 7,837 | 27 | 11 |
| Organisations named medical center | 6,019 | 15 | 9 |
| .hospital domains | 4,447 | 78 | 2 |
| Organisations named clinic | 3,575 | 27 | 1 |
| Country | Hosts |
|---|---|
| United States | 2,044 |
| Germany | 605 |
| India | 441 |
| Taiwan | 409 |
| Brazil | 366 |
| United Kingdom | 226 |
| China | 214 |
DICOM was not designed for the open internet. The protocol carries patient studies with little authentication. 7,194 servers in 122 countries answer; the United States, Germany, India, Taiwan and Brazil hold the most.
hosts of organisations whose name or domain marks them as healthcare
| Product | Healthcare-Named Hosts | Internet-Wide Hosts | Ransomware Use |
|---|---|---|---|
| WordPress Core | 15 | 91,718 | · |
| PHP | 11 | 154,266 | yes |
| Microsoft SharePoint | 7 | 17,910 | yes |
| MongoDB Server | 4 | 37,212 | · |
| Citrix NetScaler Gateway | 3 | 831 | · |
| Citrix NetScaler | 3 | 777 | · |
| Drupal Core | 2 | 1,323 | · |
| MikroTik RouterOS | 1 | 134,438 | · |
Exploited flaws (CISA KEV) tagged on 46 healthcare-named hosts, led by web platforms (WordPress, PHP) and Microsoft SharePoint. The healthcare-named count is small because the name match is narrow; the internet-wide count shows how widely each product is installed.
October 2026 flaws added to CISA’s Known Exploited Vulnerabilities catalogue, grouped by product. These are not healthcare-specific: the same products run in hospitals, clinics and pharma. Flaws in edge, remote-support, backup and hypervisor products are the entry points that ransomware groups use against healthcare (section 02).
| Product | CVEs | Added | CVSS | EPSS | Underground Posts | State Campaigns | Ransomware Links | Healthcare-Named Hosts |
|---|---|---|---|---|---|---|---|---|
| Ivanti Connect Secure | 3 | 10/13 | 8.6 | 89% | 3 | 1 | · | · |
| Ahsay AhsayCBS | 2 | 10/14 | 10.0 | 84% | · | · | · | · |
| PHP | 2 | 10/26 | 9.2 | 100% | 28 | · | · | · |
| Adobe Commerce and Magento | 1 | 10/27 | 9.3 | 47% | 1 | · | · | · |
| Atlassian multiple products | 1 | 10/15 | 9.3 | 100% | 2 | · | · | 2 |
| BeyondTrust Remote Support | 1 | 10/16 | 9.3 | 79% | · | 1 | · | · |
| Broadcom VMware ESXi | 1 | 10/28 | 2.7 | 1% | · | · | · | · |
| Cisco Secure Email Gateway | 1 | 10/14 | 9.8 | 6% | 1 | · | · | · |
| Cisco Secure Firewall ASA | 1 | 10/29 | 8.6 | 1% | · | · | · | · |
| Citrix NetScaler | 1 | 10/04 | 8.7 | 11% | · | · | · | 6 |
| Fortinet FortiMail | 1 | 10/01 | 9.8 | 5% | 2 | · | · | · |
| Fortinet multiple products | 1 | 10/16 | 5.4 | 1% | · | 1 | · | · |
| Palo Alto Networks PAN-OS | 1 | 10/14 | 8.6 | 2% | · | · | · | · |
EPSS = modelled probability of exploitation in the next 30 days. Underground posts, state campaigns and ransomware links: most mentions for any flaw of the product in CYFIRMA data; ‘·’ means none yet, as link tables lag by months. Healthcare-named hosts: name match on known-exploited flaws, a floor.
PHP2Shell (CVE-2026-109618 and -109619), CVSS 9.2. Published 21 October, added to KEV five days later. 805 exploit repositories on GitHub from 18 October, 29 underground posts across 8 channels from 20 to 29 October. PHP runs patient portals, WordPress sites and many clinical web front ends; version banners suggest up to 1.6 million PHP hosts internet-wide (an upper bound); a healthcare-named count is not available for this flaw.
Edge and remote access again. 10 of October’s flaws are in Ivanti, Citrix, Palo Alto Networks, Fortinet, Cisco and BeyondTrust products, plus AhsayCBS backup and VMware ESXi. These are the products that appear in healthcare ransomware access reports, and the two Ivanti Connect Secure flaws added on 30 October need first attention.
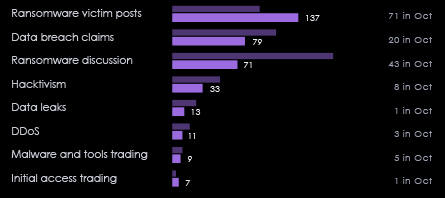
Posts per category; a post can carry several. Posts with no country are not shown below.
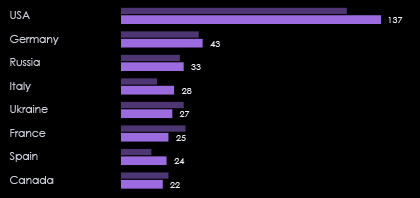
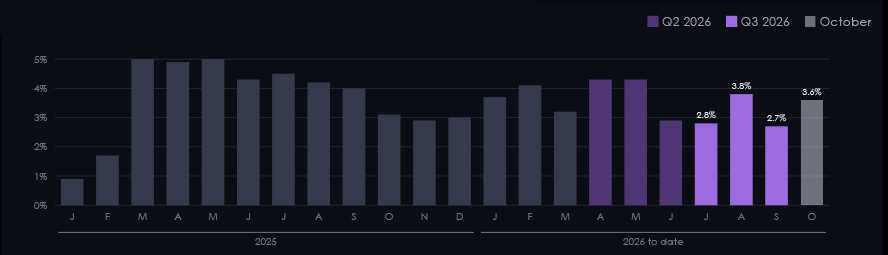
Shares, not totals. All-sector posts fell from 82,757 in Q3 2025 to 22,270 in Q3 2026 as the monitored channel set shrank, so the healthcare count falls with it. Israel-tagged healthcare posts dropped from 70 to 15 after a busy Q2.
→
Q4 2026 OUTLOOK
STABLE
Collection shrinking; victim posts up
Leak-site victim posts, the most actionable category, rose 44% and reached 71 in October alone, matching the ransomware record. Expect victim posts to keep rising, while general chatter stays flat as collection stays narrow. Underground discussion of PHP2Shell (29 posts in ten days across the whole dataset) shows how quickly new flaws are traded.
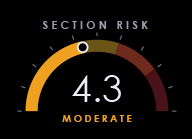
Risk score 4.3 = 35% momentum (healthcare share of underground posts, Q3 vs Q2 −20%, scored 3.4) + 35% level (Q3 vs the Q1 to Q2 average, 0.82x, scored 3.9) + 30% impact weight (6 of 10). Measured as a share. Posts are unique underground and dark web messages with a healthcare tag, after removing junk. Collection of the whole dataset fell during 2026, so shares are compared.
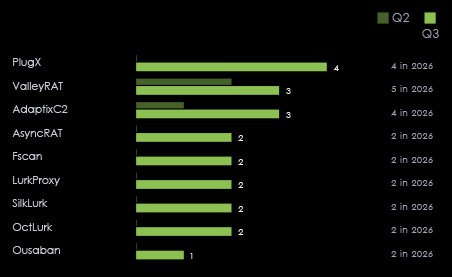
Public research reports tagged healthcare, by malware named. A report can name several families; counts are small.
share of new indicators, all sectors
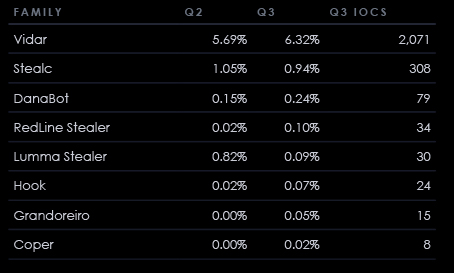
Indicator collection changed between Q2 and Q3, so shares are compared. Credential stealers feed account takeover and initial access for ransomware; they are not specific to healthcare.
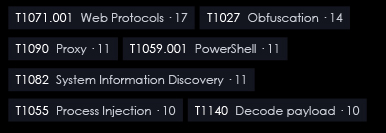
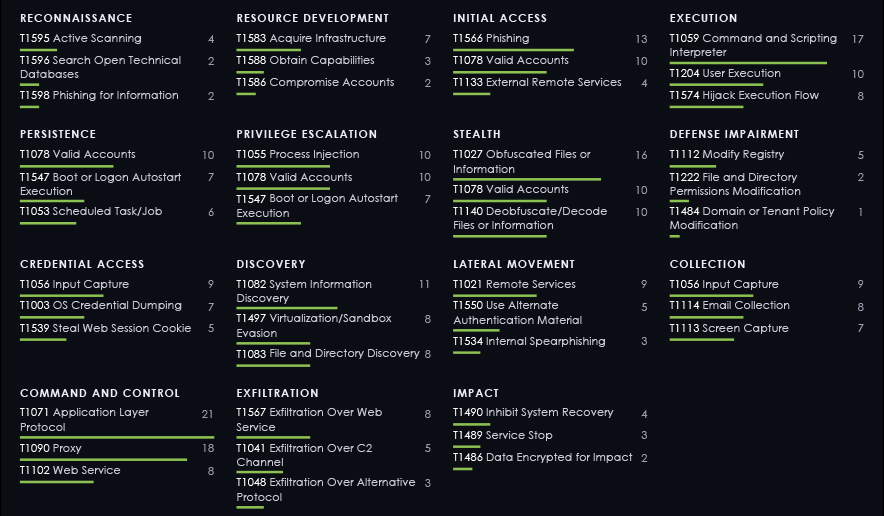
techniques in Q3 healthcare reports
Why this matters for healthcare. Remote-access trojans (PlugX, ValleyRAT, AsyncRAT) and command-and-control frameworks (AdaptixC2) give long-term access to clinical and research networks, the pattern state-linked espionage uses. Stealers collect the staff credentials that ransomware groups report as a top way in.
→
Q4 2026 OUTLOOK
STABLE
Reports steady at about 30 a quarter
Healthcare’s share of malware reporting is steady at about 7%. Expect remote-access trojans and proxy tooling to keep appearing in espionage-linked reports, and stealer families to keep rotating.
WHAT TO DO NOW
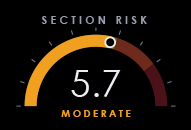
Risk score 5.7 = 35% momentum (healthcare share of malware reports, Q3 vs Q2 +11%, scored 5.9) + 35% level (Q3 vs the Q1 to Q2 average, 1.04x, scored 5.2) + 30% impact weight (6 of 10). Measured as a share. Research reports are public threat-sharing pulses tagged with the healthcare sector; IOC figures are new indicators from malware feeds, capped per family and week.
healthcare research reports, Q3
C2 servers, snapshot
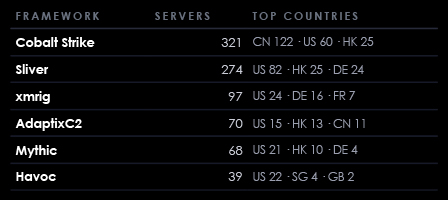
Command-and-control servers identified by banner, all sectors. AdaptixC2, named in three Q3 healthcare reports, has 70 live servers.
reports naming malware for each platform
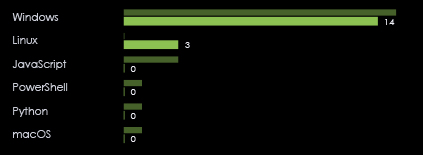
Many reports do not state a platform; Windows dominates where one is named. Linux malware appears in three Q3 reports after none in Q2.
actors reported using the family

Families seen in healthcare reports this quarter that state actors also use, so a hit can mean either crime or espionage.
Healthcare sub-sectors grouped into seven segments, Q3 2026 with the change from Q2. Sub-sector detail exists for ransomware, state campaigns and CVEs; underground posts, phishing research and malware reports name the sector but rarely the sub-sector. A campaign or CVE can cover several segments.
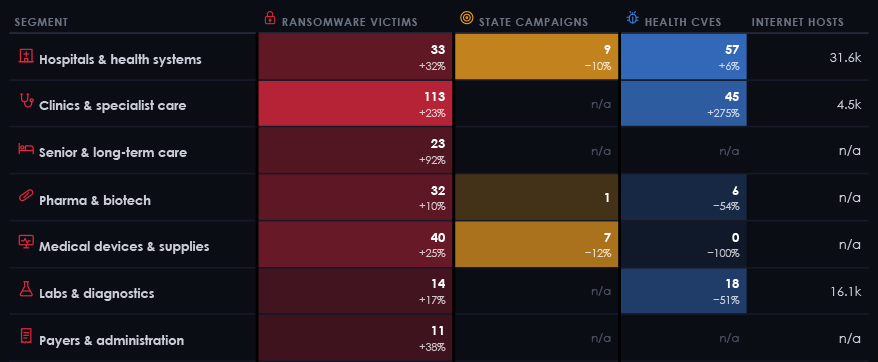
State campaigns: 8 further campaigns name healthcare without a sub-sector. Veterinary services sit in clinics. Internet hosts: single snapshot of named hosts, available for three segments only (hospital and NHS names, clinic, dental and medical-group names, laboratory and imaging systems).
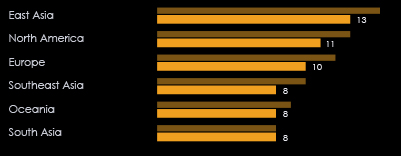
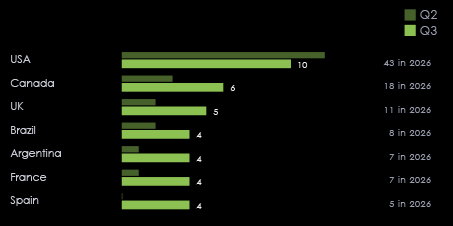
Healthcare-related activity per region in Q3 2026 across four datasets, with the change from Q2 where the base is large enough. Colour depth is relative within each column. A campaign, post or report can name several regions. Phishing is left out because the URL feeds carry no healthcare label.
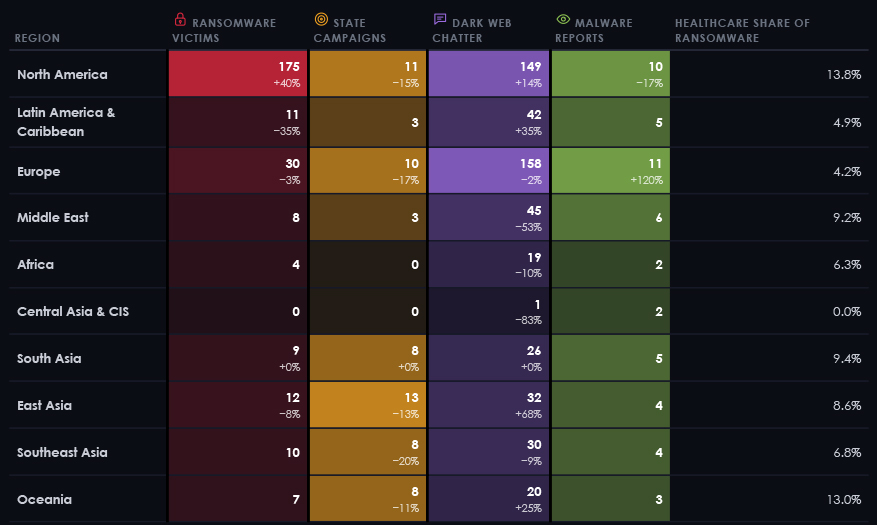
North America
Most ransomware victims (175, +40%) and the second-most underground chatter. Healthcare is 14% of the region’s leak-site victims, above the worldwide share.
East and South Asia
East Asia has the most state campaigns of any region (13, South Asia 8), with Japan, India and South Korea named most; leak-site victims stay low (12 and 9).
Europe
Flat ransomware (31 to 30) and a low healthcare share (4% of victims). German, Russian and Italian underground posts dominate chatter; state campaigns name Germany, the UK and France.
Southeast Asia and Oceania
Ransomware grew from small bases (4 to 10 in Southeast Asia, 3 to 7 in Oceania), alongside steady state interest in Australia, Singapore and the Philippines.
Latin America
Ransomware eased (17 to 11), but underground posts naming Brazil rose from 4 to 18.
Middle East and Africa
Small numbers. Underground posts naming Israel fell from 70 to 15; Morocco and Egypt lead African mentions.
The three countries with the most healthcare-related activity in each region in Q3 2026: ransomware victims, state campaigns naming the country, and underground posts naming the country with healthcare.
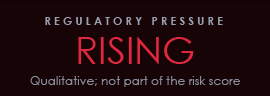
The regulatory picture for healthcare split in Q3. In the EU, the Cyber Resilience Act turned on its reporting duties for product makers on 11 September, the Health Data Space is being phased in, and NIS2 already covers hospitals and pharma. In the US, HHS pushed its HIPAA Security Rule rewrite out to mid-2027. The UK is legislating for supply-chain resilience, with the NHS in focus.
HIPAA Security Rule overhaul pushed back
HHS proposed mandatory MFA, encryption, asset inventories and 72-hour restoration in January 2025. The regulatory agenda now puts final action no earlier than July 2027, so the existing Security Rule stays in force.
FDA cybersecurity rules for medical devices
Manufacturers of connected ‘cyber devices’ must give the FDA a vulnerability plan and a software bill of materials with premarket submissions (section 524B).
CIRCIA final rule still not published
Until CISA’s rule takes effect, the proposed 72-hour incident and 24-hour ransom-payment reports are not required (status as checked in November 2026).
Cyber Resilience Act reporting duties start
Manufacturers of products with digital elements must report actively exploited vulnerabilities and severe incidents through ENISA’s platform: early warning in 24 hours, notification in 72 hours. Most other duties apply from 11 Dec 2027. Devices under the MDR and IVDR are largely outside the CRA; record systems, gateways and other software around them are not.
European Health Data Space in force
Regulation (EU) 2025/327 applies in stages from 2027, with secondary-use rules from 2029; implementing acts are due by March 2027. It sets security and interoperability duties for electronic health record systems.
NIS2 covers health
Hospitals, laboratories, pharma and critical-device makers are essential or important entities with 24-hour early warning and 72-hour incident reporting.
Cyber Security and Resilience Bill
Introduced to widen cyber regulation to more services and supply chains, with a focus on the NHS. In the Lords as of October 2026; not yet law.
NHS Data Security and Protection Toolkit
Mandatory self-assessment for organisations with access to NHS patient data, moved onto the NCSC Cyber Assessment Framework from 2024. NHS England’s supplier charter expects suppliers to reach at least ‘Standards Met’.
INCIDENT NOTIFICATION CLOCKS HEALTHCARE MUST MEET
| Regime | Deadline | What |
|---|---|---|
| EU · NIS2 | 24h / 72h | early warning, then incident notification, for essential and important entities |
| EU · Cyber Resilience Act | 24h / 72h | manufacturers: actively exploited vulnerabilities and severe incidents (from 11 Sep 2026) |
| EU / UK · GDPR | 72 hours | personal data breaches to the supervisory authority |
| US · HIPAA breach rule | 60 days | notice to individuals and HHS after discovery of a breach of unsecured health information |
| Australia · Cyber Security Act | 72 hours | ransomware payments reported by covered businesses (in force since 30 May 2025) |
| US · SEC | 4 business days | material incidents of listed companies, including pharma and device makers (Form 8-K) |
| US · CIRCIA | pending | proposed 72 hours, ransom payments 24 hours |
Simplified; scope, triggers and thresholds differ by rule and by country. A multinational group hit by ransomware may face several clocks, and the 24-hour ones, before triage is finished. HIPAA’s 60 days is an outer limit; HHS expects notice without unreasonable delay.
Checked on 16 November 2026 against published sources: HHS HIPAA Security Rule notice of proposed rulemaking (6 January 2025) and the Unified Agenda entry reported by trade press (Fierce Healthcare, GovInfoSecurity); Cyber Resilience Act reporting guidance from law firms and national cyber agencies (11 September 2026); European Commission health data space pages and Regulation (EU) 2025/327; NHS England, UK Government and NHS Digital pages on the Data Security and Protection Toolkit and the Cyber Security and Resilience Bill. FDA section 524B, NIS2, GDPR, HIPAA breach-notification, Australian and SEC items reflect the rules as generally applied and were not re-checked this quarter; confirm each entity’s scope. Regulation varies by country; a dedicated regulatory tracking dataset is recommended for future editions.
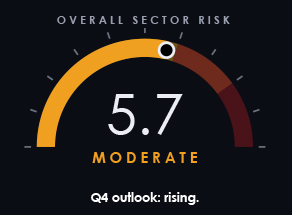
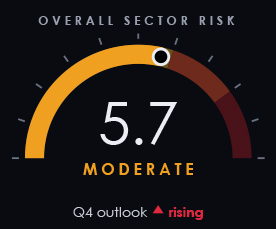
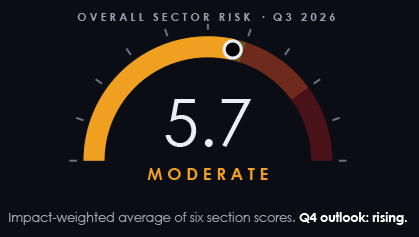
We expect Q4 risk to rise. Ransomware against healthcare ended Q3 at a record and October went higher still (121 victims), while the wider flow of exploited flaws and edge-device attacks keeps accelerating. Healthcare’s share of state campaigns reached its 2026 high in October. The Q3 composite score of 5.7 understates this: the vulnerability score is held down by a sharp rise in total CVE volume, and phishing is scored on thin research data. Expect imaging and record servers on the internet to stay the largest avoidable exposure.
P1 now · P2 this quarter · P3 next · number = report section
02 · 05
Patch internet-facing gateways and remote access within days
VPN and firewall flaws (groups behind 80 victims) and exposed remote services (64) lead the access reports; October added Ivanti, Citrix, PAN-OS, Cisco ASA and BeyondTrust flaws.
05
Take imaging and record servers off the open internet
7,194 DICOM servers answer publicly (12 Nov); the monthly count is up 32% since January 2025. Put DICOM, FHIR, OpenEMR and viewer interfaces behind VPN and authentication.
02
Make backups and hypervisors ransomware-resilient
Backup deletion tools appear for groups behind 59 victims and ESXi tooling behind 52. Keep offline copies and test restores, including clinical systems.
02 · 04
Lock down remote tools and stolen-credential routes
AnyDesk (groups behind 56 victims), ScreenConnect and PsExec are the common ways to move; stolen credentials (57) and phishing (57) are the reported ways in.
02 · 09
Hold suppliers and device makers to account
Device and supply makers are the most-listed sub-sector (40 victims). Ask for SBOMs, patch SLAs and incident-notice terms.
02
Track new ransomware groups
30% of Q3 healthcare victims came from groups new since April; senior-care and clinic victims rose fastest.
09
Plan clinical downtime and notification
Rehearse paper-based care, diagnostics fallback and who files which regulatory notice; clocks run from 24 hours (NIS2, CRA) to 60 days (HIPAA).
03
Protect research and trial data
Espionage is the main state motive; segment research networks, watch for web shells and password spraying, and review exposed remote-access gateways.
These priorities reflect the intelligence available at 31 October 2026 and are subject to each organisation’s own controls and monitoring.
PERIODS
Last quarter = Q3 2026 (1 July to 30 September), compared with Q2 2026 (1 April to 30 June). Context: Q1 2026, Q3 2025 and October 2026. Data cut-off 31 October 2026; extracted 16 November 2026 from the CYFIRMA threat warehouse.
RISK SCORES
Each section score (0 to 10) = 35% momentum (Q3 vs Q2), 35% level (Q3 vs the average of Q1 and Q2) and 30% impact weight for the threat type. Momentum score = 5 + 8 x change; level score = 5 + 6 x (ratio − 1), both capped at 0 and 10. Counts are used for ransomware; shares of the whole dataset are used elsewhere. The overall score is the impact-weighted mean. Bands: 8 and above critical, 6 to 8 high, 4 to 6 moderate, below 4 low. The method matches the Finance edition so sectors can be compared.
| Section | Measure | Impact | Mom. | Level | Score |
|---|---|---|---|---|---|
| Ransomware | healthcare leak-site victims | 9 | 7.1 | 7.5 | 7.8 |
| State | share of active campaigns | 8 | 6.0 | 5.0 | 6.2 |
| Vulnerabilities | share of new CVEs | 8 | 0.8 | 0.5 | 2.9 |
| Phishing | share of phishing research | 7 | 8.3 | 6.0 | 7.1 |
| Underground | share of underground posts | 6 | 3.4 | 3.9 | 4.3 |
| Malware intelligence | share of malware reports | 6 | 5.9 | 5.2 | 5.7 |
OUTLOOKS
Q4 outlooks are analyst judgments based on the October reading against the Q3 pace and on the qualitative evidence in each section.
DATA SOURCES
READ WITH CARE
