
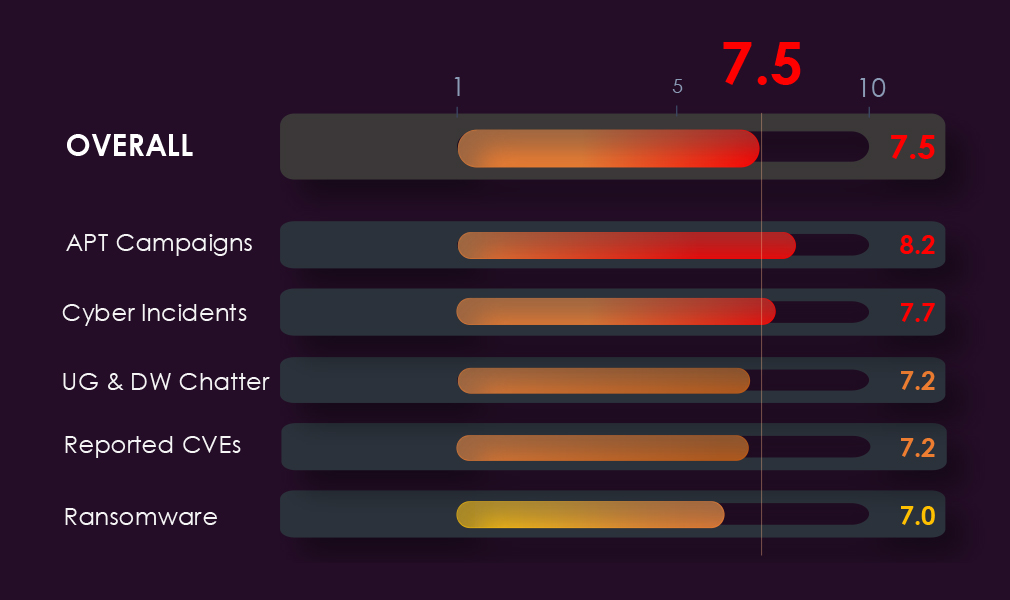
APT Campaigns – 8.2
55 of 130 campaign updates (42%), a five-fold rise from 11, with share broadly sustained at 46%. MISSION2074, Lazarus Group and FIN7 lead, placing espionage, DPRK activity and financial crime in the top tier simultaneously. Two Ivanti, two Citrix NetScaler and three Fortinet products among targeted technologies. PowerShell, WMI, SMB, SSH and RDP in the data indicate campaigns progressing into hands-on post-exploitation.
Cyber Incidents – 7.7
78 incidents, 2nd of 14, absorbing a wider range of threat types than any other sector. Iranian PLC exploitation drew repeated CISA, FBI and EPA advisories, with water utility disruption reaching a dozen states. Ransomware hit municipal, national and federal bodies, with Romania’s land registry stalling a property market and a Latvian breach prompting ministerial resignations.
Dark Web Chatter – 7.2
5,011 mentions, 6th of 14 at 10.80%, with the flattest trajectory of any sector. Breach and leak rise steadily in every period without spiking, indicating continuous baseline activity rather than campaign-driven interest. Identity records hold durable value since they cannot be reissued like payment cards, sustaining demand independent of campaign cycles.
Vulnerabilities – 7.2
116 mentions, 6th of 14, with the most concentrated profile in the report. RCE accounts for roughly four-fifths of final-period volume and rose more than fivefold. Public sector patch cycles are constrained by procurement and service availability, and legacy systems past vendor support turn a disclosure into permanent exposure.
Ransomware – 7.0
142 victims, down 3.4% Q-on-Q, with share falling from 6.44% to 5.32% and country coverage contracting from 41 to 38. 41% gang participation is the lowest in recent reporting. Municipal & Local Governments and NGOs account for close to half of victims. Nasirsecurity directs 75% of its victims here, and five groups entered in August, carrying into September.
The CYFIRMA Industry Report delivers original cybersecurity insights and telemetry-driven statistics of global industries, covering one sector each week for a quarter. This report focuses on the government & civic sector, presenting key trends and statistics in an engaging infographic format.
Welcome to the CYFIRMA infographic industry report, where we delve into the external threat landscape of the government & civic industry over the past three months. This report provides valuable insights and data-driven statistics, delivering a concise analysis of attack campaigns, public reports, underground & dark web chatter, vulnerabilities, and ransomware incidents targeting government & civic organizations.
We aim to present an industry-specific overview in a convenient, engaging, and informative format. Leveraging our cutting-edge platform telemetry and the expertise of our analysts, we bring you actionable intelligence to stay ahead in the cybersecurity landscape.
CYFIRMA delivers pre-emptive cybersecurity, cyber threat intelligence, and external threat landscape management through its platforms, DeCYFIR and DeTCT. These platforms have been purpose-built over many years to continuously collect, correlate, and analyse large volumes of external threat data, combining proprietary intelligence automation with deep, hands-on cyber threat research.
For the purpose of this report, the analysis draws on intelligence generated from CYFIRMA’s platforms. The data referenced has been processed through automated correlation and enrichment mechanisms, informed and validated by human-led research and investigative expertise, and sourced from both structured and unstructured external intelligence channels.
While this report contains data collected and processed by our in-house AI and ML, all charts, statistics, and analyses are done by human CYFIRMA CTI analysts to ensure the highest quality and provide accurate insights.
Government & civic organizations did feature in 55 out of the 130 campaign activity updates, which is a presence in 42% of all activity. This is a significant jump from the previous period, where government & civic organizations were present in 11 out of 24 campaigns. However, a sustained presence compared to the previous 46%.
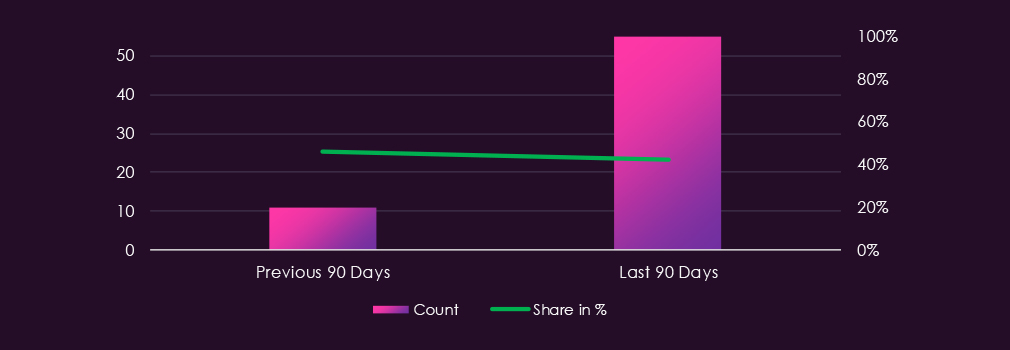

APT activity targeting the government & civic industry has been continuous and accelerating. Monthly campaign counts rose sharply across June, July, and August, with September already recording the highest count despite being a partial month at the time of this report.
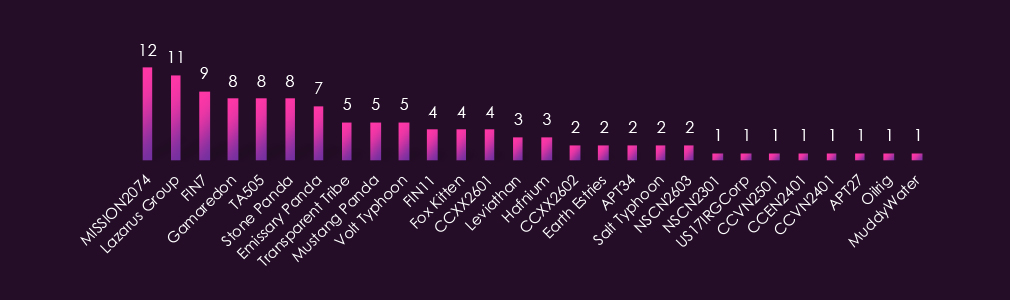
Observed APT campaigns show broad actor representation, spanning state-sponsored, financially motivated, and regional cybercriminal groups. China-linked MISSION2074 records the highest campaign count, followed closely by the North Korea-associated Lazarus Group. Stone Panda, Emissary Panda, Mustang Panda, Volt Typhoon, Leviathan, Earth Estries, Hafnium, Salt Typhoon, and APT27 provide further China-aligned representation.
Financially motivated actors feature heavily, with FIN7 ranking third overall alongside TA505 and FIN11. Russia-linked Gamaredon records a high campaign count, with Pakistan-linked Transparent Tribe also prominent. Iran-linked Fox Kitten, OilRig, and MuddyWater all appear. Several regional cybercriminal groups are also recorded, reflecting a threat landscape in which government and civic organizations face pressure from espionage, criminal monetization, and regionally motivated actors simultaneously.
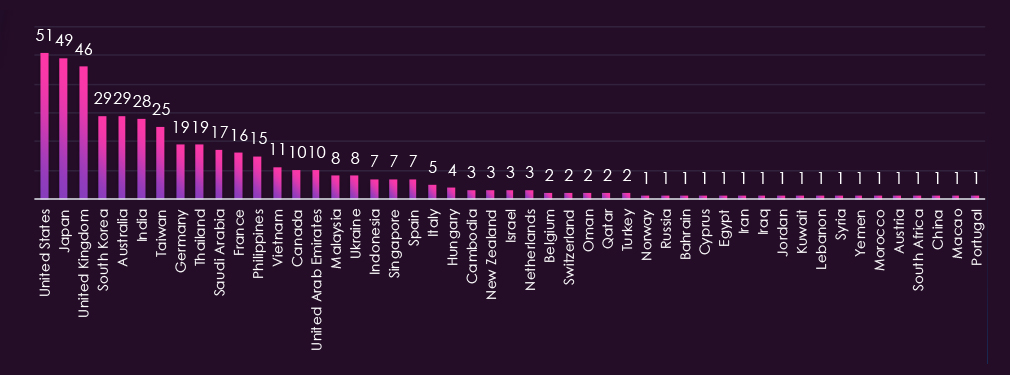
Victim distribution spans 49 countries, the widest geographic footprint recorded in this period. The United States, Japan, and the United Kingdom record the highest victim counts by a wide margin, followed by South Korea, Australia, India, and Taiwan.
Germany and Thailand lead the next tier, with Saudi Arabia, France, and the Philippines also recording significant counts. European representation is broad, covering Germany, France, Ukraine, Spain, Italy, Hungary, the Netherlands, Belgium, Switzerland, Austria, Norway, and Portugal.
Middle Eastern presence is unusually wide, spanning Saudi Arabia, the UAE, Israel, Oman, Qatar, Bahrain, Kuwait, Jordan, Lebanon, Iran, Iraq, Syria, and Yemen. This regional breadth is consistent with the Iranian actor presence observed this period and with cross-border government targeting across the region. Southeast Asian representation covers Thailand, the Philippines, Vietnam, Malaysia, Indonesia, Singapore, and Cambodia.
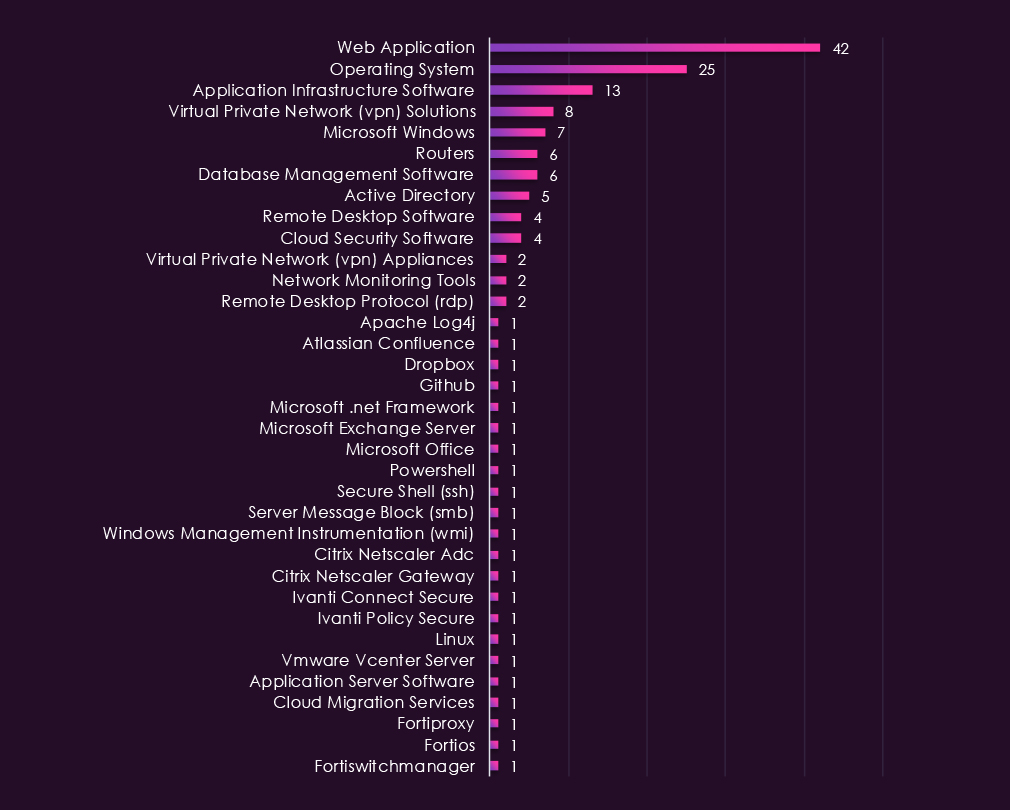
Web applications account for the highest number of observed attacks by a wide margin, followed by operating systems and application infrastructure software. VPN solutions, routers, and network monitoring tools feature across multiple campaigns, alongside Active Directory and database management software, pointing to a targeting pattern focused on perimeter access followed by lateral movement through identity infrastructure.
Edge appliance targeting is pronounced. Two Ivanti products, two Citrix NetScaler products, and three Fortinet products all appear among targeted technologies, alongside VPN appliances. Microsoft Exchange Server, VMware vCenter Server, Atlassian Confluence, and Apache Log4j also feature, reflecting exploitation of widely deployed enterprise software with known vulnerability histories.
Post-exploitation tooling, including PowerShell, Windows Management Instrumentation, Server Message Block, SSH, and RDP, is also recorded, indicating campaigns progressing beyond initial access into hands-on activity within compromised environments.
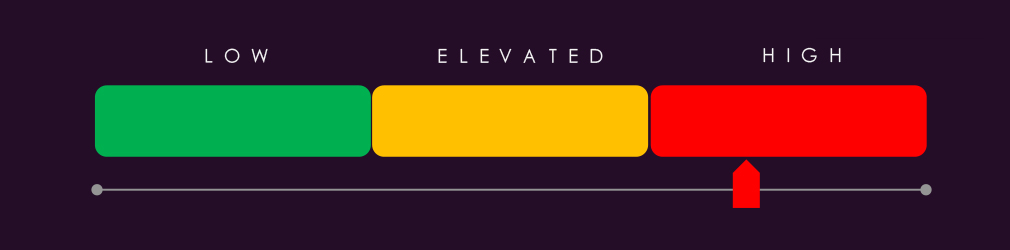
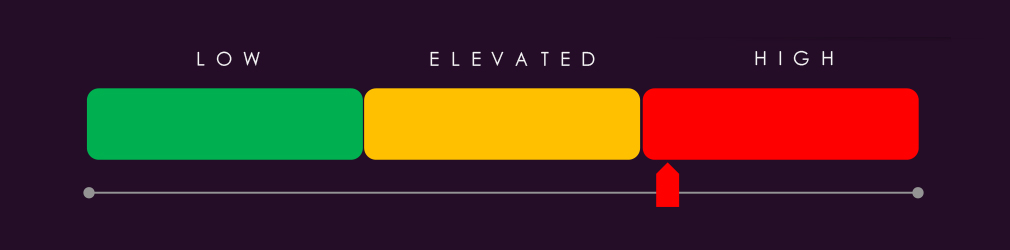
Based on observed trajectory across the two reporting periods, the government and civic sector external threat landscape is expected to remain at High through the next 90 days. Campaign presence grew five-fold in absolute terms from 11 to 55, while holding a sustained share of 42% against 46% previously. Monthly counts rose consistently across the period, with September already the highest month despite being partial at publication, indicating accelerating rather than plateauing targeting.
Dominant actor continuity: MISSION2074 and Lazarus Group recorded the highest campaign counts and show no indicators of reduced tempo. FIN7 ranking third places a financially motivated actor inside the leading tier, indicating that government and civic organizations face criminal monetization pressure alongside sustained state-sponsored espionage.
Edge appliance and identity exposure: Two Ivanti products, two Citrix Netscaler products, three Fortinet products, and VPN appliances all appear among targeted technologies, alongside Active Directory and network infrastructure. Organizations running unpatched perimeter appliances or exposed directory services face the highest immediate risk. The presence of Microsoft Exchange Server, VMware vCenter Server, Atlassian Confluence, and Apache Log4j indicates continued exploitation of known vulnerabilities in widely deployed enterprise software.
Hands-on intrusion activity: PowerShell, WMI, SMB, SSH, and RDP appearing in the targeting data points to campaigns progressing past initial access into interactive post-exploitation activity. Detection strategies focused solely on perimeter exploitation will miss this stage.
Geographic targeting: The United States, Japan, and the United Kingdom lead in victim count, with 49 countries represented overall. The unusually wide Middle Eastern footprint, spanning thirteen countries including Iran, Iraq, Syria, Yemen, and Lebanon, is expected to persist given the Iranian actor presence and the regional pattern of cross-border government targeting.
Multi-origin threat profile: China-linked, North Korean, Russian, Iranian, and Pakistani state actors feature alongside three major financially motivated groups and several regional cybercriminal actors. Defenders should prioritize TTP-based detection over actor-specific IOC tracking given the breadth of actor representation and the heavy overlap in targeted edge infrastructure across otherwise unrelated groups.
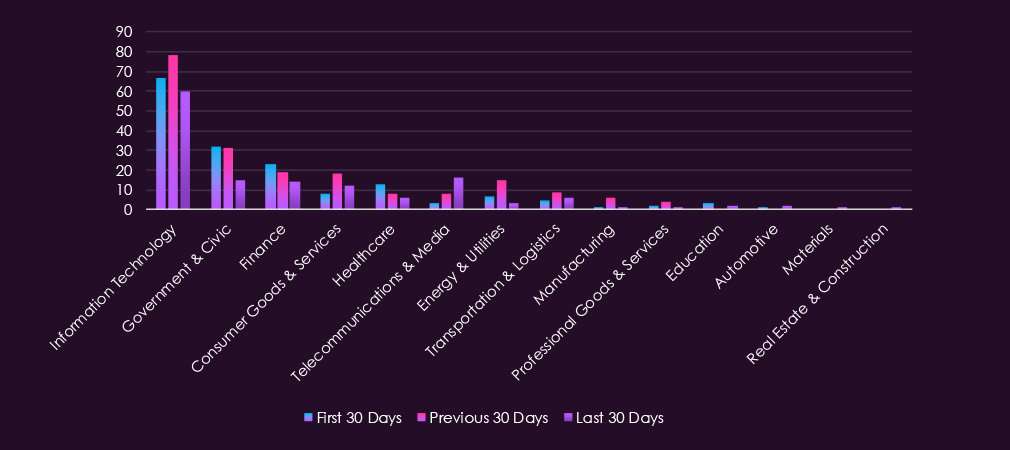
Over the past 90 days, DeCYFIR and DeTCT platforms tracked 674 cyber incidents reported publicly. We could identify the industry for 501 of these incidents (74.3%).
Government & civic industry was detected in 78 incidents, which equals 15.57% of the incidents where we knew the industry, ranking 2nd out of 14 industries.
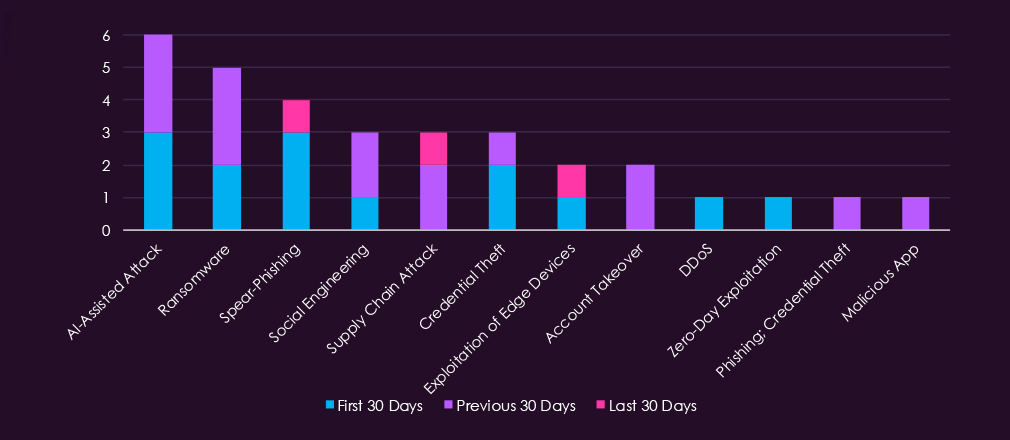
AI-assisted attacks and ransomware were the most frequently identified techniques, both appearing across the first and previous 30 days with no reporting in the last 30 days (notable reporting gap, not aligned with our ransomware section in this same report). Spear-phishing appeared in the first and last 30 days, while social engineering and supply chain attacks were distributed across the previous and last 30 days. Credential theft appeared twice in the first 30 days. Exploitation of edge devices appeared in the first and last 30 days. Account takeover, DDoS, zero-day exploitation, phishing combined with credential theft, and malicious app each appeared once. The decline in technique identification in the last 30 days is notable given that incident volume remained relatively consistent, reflecting the broader limitation that public reporting on government incidents frequently omits technical detail.
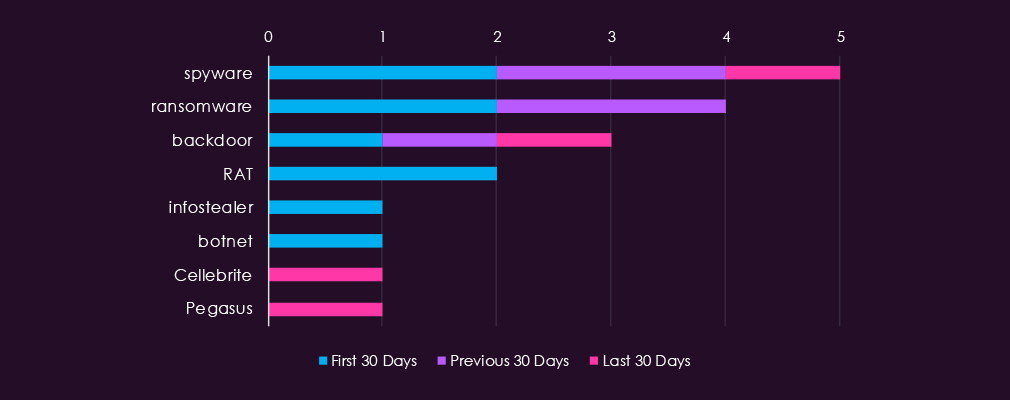
Spyware was the most frequently identified tool, appearing across all three periods and the only tool with consistent presence throughout the reporting window. Ransomware appeared across the first and previous 30 days. Backdoor was distributed evenly across all three periods. RAT appeared twice in the first 30 days only. Infostealer and botnet each appeared once in the first 30 days. Cellebrite and Pegasus each appeared once in the last 30 days, consistent with the commercial spyware activity noted against political targets in this sector.
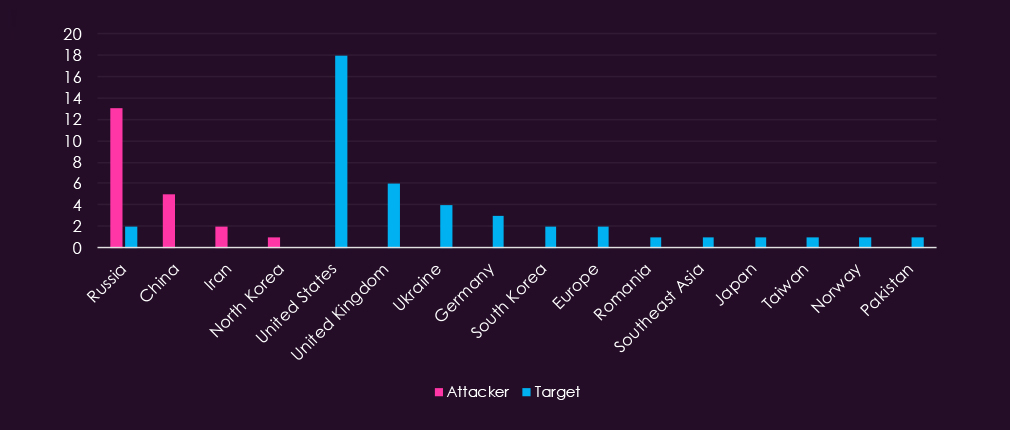
Russia was the most frequently identified attacking country by a significant margin, appearing in 13 incidents, followed by China with 5 and Iran with 2. North Korea appeared once. Victim attribution was substantially more complete, with the United States as the primary target at 18 incidents, followed by the United Kingdom at 6 and Ukraine at 4. Germany, South Korea, and Europe each recorded isolated cases, with further single incidents across Romania, Southeast Asia, Japan, Taiwan, Norway, and Pakistan. The geographic spread of victims across NATO and partner states, alongside Russian and Chinese dominance of attacker attribution, reflects the geopolitical character of government sector targeting this quarter.
Reporting volume held steady through the quarter with no sustained escalation, but the shape of the threat changed.
Software supply chain compromise remained the leading technique, driven by worm campaigns spreading through the npm and PyPI package registries. Close behind sits a cluster of social engineering, credential theft, phishing, and data extortion that now rivals it. Attackers are converging on identity as the entry point, whether stolen through a package, a help-desk call, or a phishing page.
The most significant change is AI. AI-assisted attack has risen to one of the most frequently recorded techniques, and LLM exploitation has separated out as a category in its own right. This is no longer speculative: agentic tooling ran an espionage operation end to end, AI-generated tooling was flagged by US agencies in attacks on industrial controllers, and a major AI vendor publicly caught state-linked operators using its models in live intrusions.
Attribution remains lopsided. ShinyHunters, a financially motivated actor, accounts for several times more incidents than any other, running mass credential extortion across every sector. Beneath it the field is fragmented across Russian, Iranian and Chinese state clusters and a rotating cast of ransomware brands. Russia leads attacker attribution, followed by China and Iran. Edge infrastructure remained the preferred route in, most visibly through the Zimbra zero-click campaign and mass credential exposure on internet-facing firewalls that was later converted into ransomware access.
Government & Civic
Government was the second most affected sector after information technology, and absorbs a wider range of threat types than any other.
State espionage was persistent and openly attributed. Russian operators ran a zero-click campaign against Zimbra webmail that drew a coordinated international advisory, phished EU officials over messaging apps, posed as recruiters to reach Ukrainian IT workers, and targeted a Ukrainian agency managing seized Russian assets. Chinese clusters were active across Central and Southeast Asia, with SilkParasite notable for AI-assisted malware and Jewelbug combining espionage with cryptocurrency theft. Iranian activity spanned dissident surveillance abroad, a fake national alert app deploying Android spyware, and a US indictment over a long campaign against agencies and universities.
Critical infrastructure was the sharpest operational concern. Iran-linked actors drew repeated joint advisories from CISA, the FBI and the EPA over ongoing exploitation of programmable logic controllers, with water utilities the visible consequence: coordinated disruption across dozens of Minnesota systems spread to incidents in a dozen states. Agencies separately warned that AI-generated tooling was being used against industrial controllers. Port and transport operations were also hit.
Ransomware reached government at every level. Berlin suffered a Rhysida attack, refused to pay and then saw stolen credentials published. A US federal firearms agency confirmed a major incident after Qilin claims, with exposed systems holding investigation targets. Local governments across several states lost services, Romania’s land registry disruption stalled its property market, and Latvian officials resigned after a breach exposed data on much of the population.
Citizen data proved both attractive and poorly protected. Driver licence and motor vehicle databases were breached in more than one US state, in Florida through credentials stolen from a police officer’s personal device, a reminder that government data loss often begins outside government systems. Police records, court records, traveller records and a diplomatic training system were all exposed, the last after nine months of undetected access.
Commercial spyware against political targets continued as a distinct problem, involving a European Parliament member investigating the issue, Serbian opposition figures, and a UK court rejecting a state immunity claim.
The sector’s own capacity became part of the story. CISA staffing cuts drew calls for investigation while the agency planned hiring, Germany moved to grant its intelligence services hacking and sabotage powers, the White House engaged private firms for offensive operations and banned foreign-made power generation equipment over backdoor concerns, and Ukraine appointed a new cyber coordination chief.
State Espionage as Persistent Baseline. Russian operators demonstrated sustained, multi-vector targeting across the period, including zero-click Zimbra campaigns, phishing of EU officials, and targeting of agencies managing seized Russian assets. Chinese clusters maintained active operations across Central and Southeast Asia. Neither thread shows signs of contraction given current geopolitical conditions.
Critical Infrastructure as Primary Operational Target. Iranian-linked exploitation of programmable logic controllers drew repeated joint advisories from CISA, the FBI, and the EPA. Water utilities bore the most visible consequences, with coordinated disruption spreading across multiple US states. AI-generated tooling being used against industrial controllers marks a qualitative shift in this threat. Port and transport operations were separately hit. These are not isolated incidents; they reflect a deliberate campaign against government-adjacent physical infrastructure.
Ransomware Reaching Every Level of Government. Berlin, a US federal firearms agency, multiple US state and local governments, Romania’s land registry, and Latvia all confirmed ransomware incidents within the period. The Rhysida and Qilin groups both demonstrated confirmed government sector reach. The pattern of refusing payment followed by credential publication, as seen in Berlin, is likely to become more common as a secondary pressure mechanism.
Citizen Data as a Standing Target. Driver license databases, court records, police records, traveller records, and a diplomatic training system were all exposed during the period. Data loss frequently originated outside government systems themselves, through credentials stolen from personal devices or third-party platforms. This attack surface is structurally difficult to close and is likely to continue generating incidents.
Commercial Spyware Against Political Targets. Cellebrite and Pegasus both appeared in the last 30 days, consistent with the broader pattern of commercial surveillance tools being deployed against elected officials, opposition figures, and civil society. A UK court rejecting a state immunity claim and a European Parliament member investigating the issue signal this is moving toward legal and regulatory response, but deployment will continue in the near term.
Over the past 90 days, CYFIRMA’s telemetry has identified 5,011 mentions of government & civic organizations out of a total of 46,365 industry-linked mentions. This is from a total of 300k+ posts across various underground and dark web channels and forums.
Government & civic organizations landed in 6th place out of 14 industries in the last 90 days, with a share of 10.80% of all detected industry-linked chatter.
Below is a breakdown by 30-day periods of all mentions.
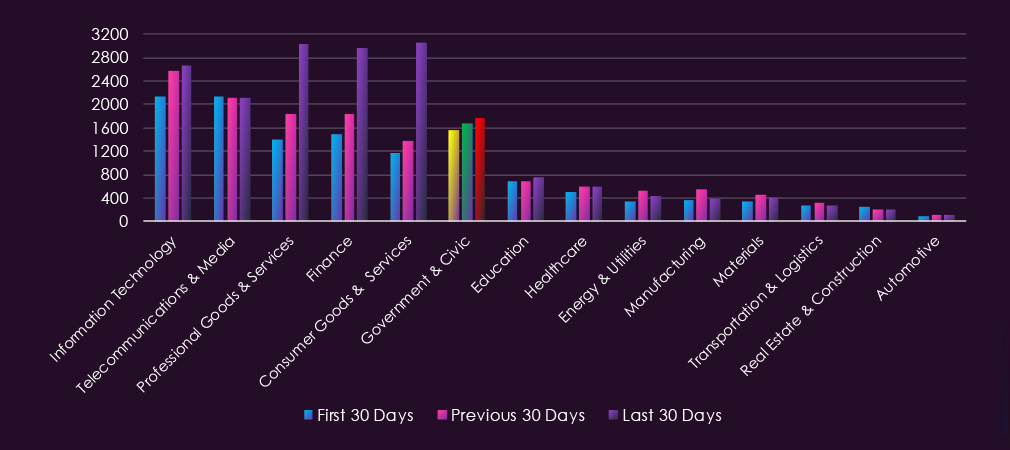
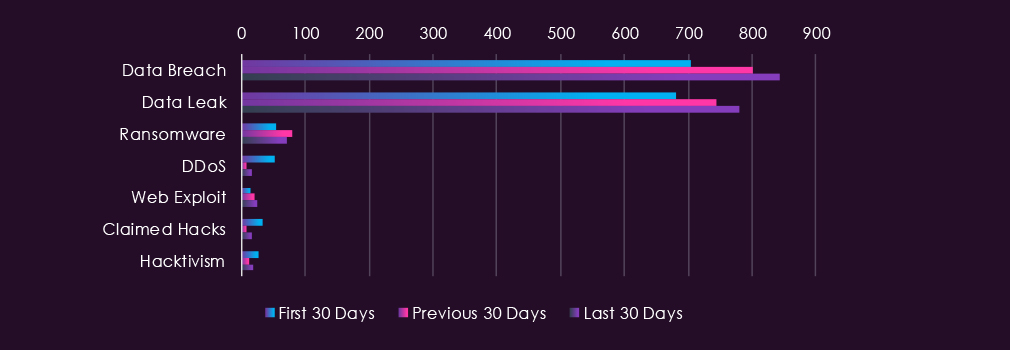
Underground & dark web chatter related to the government & civic sector over the last 90 days is dominated by data breach and data leak discussions, both of which rise steadily in each period without the sharp escalation seen in other sectors. Ransomware mentions rise, then ease back slightly at modest levels. Web exploit volumes increase consistently but remain low. DDoS, claimed hacks, and hacktivism all fall sharply after the first period and remain well below their opening levels.
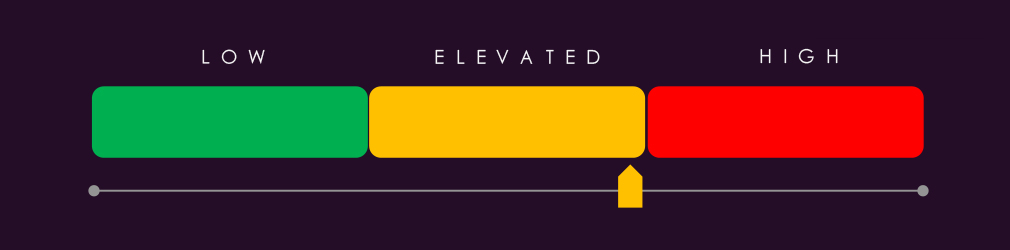
Government & civic carries sustained elevated chatter volume with the flattest trajectory of any sector in this report, growing modestly and consistently rather than spiking. Breach and leak discussion account for almost the entire volume and rise in every period. The score reflects persistent baseline targeting rather than an acute event, which is the characteristic risk profile for this sector.
Data Breach and Data Leak: Both rise in each period at a steady rate, together accounting for the large majority of sector chatter. Government and civic bodies hold citizen identity records, benefits and tax data, licensing information, and internal administrative credentials. This data has durable rather than perishable value, since identity records cannot be reissued the way payment cards can, which sustains demand independent of campaign cycles.
Absence of Volatility as the Finding: Where most sectors in this report show sharp final-period movement tied to forum disruption, leak-site publication, or disclosure clusters, this sector shows none. Incremental growth across all three periods indicates continuous baseline activity rather than campaign-driven interest, and it means the current volume is more likely to persist than to correct downward.
DDoS, Hacktivism and Claimed Hacks: All three fall sharply after the first period. This is notable because government is the conventional primary target for ideologically motivated disruption and public intrusion claims, so their retreat in this sector is more significant than the equivalent decline elsewhere. The pattern is consistent with a shift from visible disruption toward quiet data acquisition, though these categories can escalate within days on a geopolitical trigger and their current low base should not be read as structural.
State-Linked Activity Against Public Infrastructure: Joint advisories during the period identified Iranian exploitation of programmable logic controllers in US critical infrastructure and Russian targeting of communications and energy providers through edge devices. State-linked activity of this type is positioning and collection oriented, generates little underground chatter by design, and therefore sits almost entirely outside what this dataset measures.
Web Exploit: Rises consistently across all three periods from a low base. The only category other than breach and leak showing uninterrupted growth, indicating gradually increasing probing of public-facing civic portals, service platforms and administrative interfaces.
Ransomware: Rises then eases slightly, remaining modest relative to breach and leak volume. Municipal and local government bodies remain structurally exposed given constrained security budgets and low tolerance for service interruption, and low chatter volume in this category understates the operational consequence when incidents do occur.
Over the past 90 days, CYFIRMA’s telemetry has identified 116 mentions of government & civic organizations out of a total of 2,632 industry mentions. This is from over 10k CVEs reported and updated in the last 90 days.
Government & civic organizations ranked 6th out of 14 industries in the last 90 days, with a share of 4.41% of all detected industry-linked vulnerabilities.
Below is a breakdown by 30-day periods of all mentions.
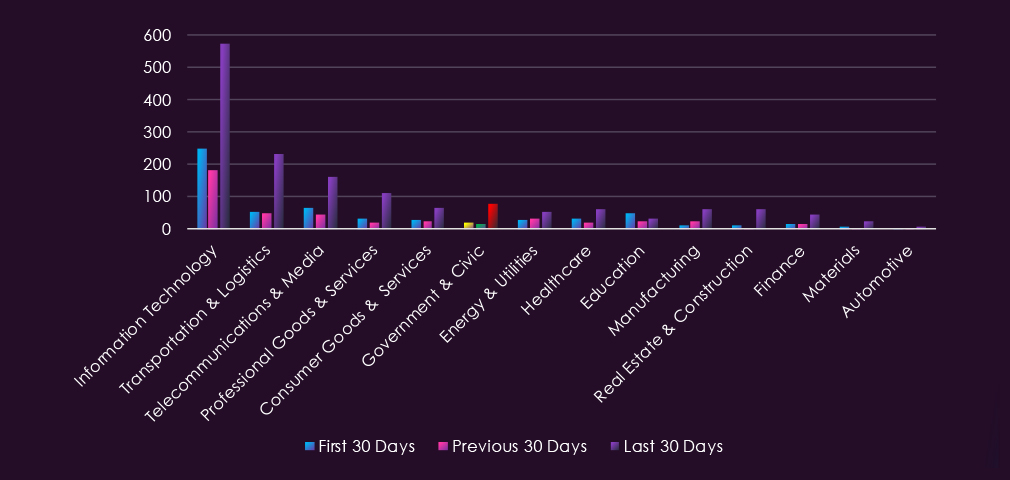
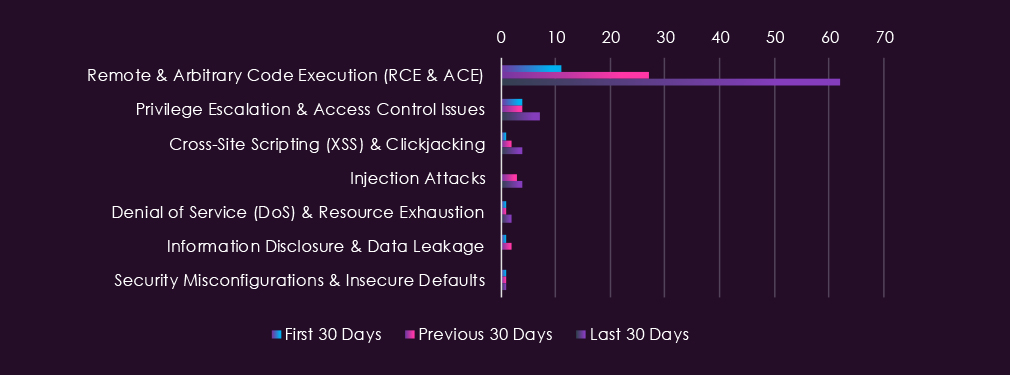
Reported CVEs in the government & civic sector over the last 90 days are dominated by remote and arbitrary code execution vulnerabilities, which rise sharply in each period and account for the large majority of final-period volume. Privilege escalation increases modestly in the final period. Cross-site scripting and injection attacks rise from near zero but remain minimal. Denial of service, information disclosure, and security misconfigurations stay at negligible levels throughout.
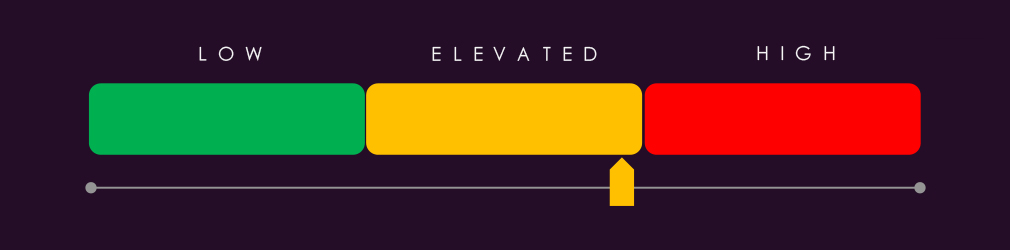
Government & civic shows a highly concentrated vulnerability profile, with remote code execution accounting for roughly four-fifths of final-period volume and rising more than fivefold across the window. This concentration, combined with the operational consequences of compromise in public service delivery, drives the high score.
Remote & Arbitrary Code Execution: Rises in every period and dominates the sector profile. Government environments run large estates of internet-facing citizen service portals, case management systems, remote access gateways and file transfer platforms, all of which are standing targets for unauthenticated code execution. Public sector patch cycles are typically constrained by procurement, change control and service availability requirements, which extends the exposure window well beyond the disclosure date.
Privilege Escalation: The only other category with a discernible upward trend, rising in the final period. Combined with sustained code execution exposure, this is the lateral movement risk after initial compromise, and it is consequential in environments where a single administrative account can reach citizen identity records across multiple systems.
Divergence from the Chatter Profile: The sector’s underground chatter is flat and broadly distributed, while its vulnerability profile is steep and narrow. The two datasets are not measuring the same thing here. Disclosure volume reflects exposure in deployed technology, while chatter reflects criminal interest in data already taken, and the gap suggests exposure is growing faster than underground activity currently reflects.
State-Linked Exploitation of Public Infrastructure: Joint advisories during the period identified Iranian exploitation of programmable logic controllers in US critical infrastructure and Russian targeting of communications and energy providers through edge devices. Edge and gateway devices are the recurring entry point in this activity, and they fall within the same code execution category dominating this dataset. Exploitation of this type is oriented toward persistence and collection rather than immediate disruption, so successful compromise may produce no observable incident for an extended period.
Legacy Estate as a Structural Multiplier: Public sector technology estates carry longer replacement cycles than commercial equivalents, with systems remaining in service past vendor support. A disclosure affecting an unsupported product produces permanent rather than temporary exposure, and this sector carries more of that category than most.
Remaining Categories: Cross-site scripting, injection attacks, denial of service, information disclosure, and security misconfigurations all remain minimal across the window and do not currently shape the sector’s risk profile.
In the past 90 days, CYFIRMA has identified 142 verified ransomware victims in government & civic organizations. This accounts for 5.32% of all 2,669 ransomware victims during the same period, placing this sector 7th out of 14 industries.
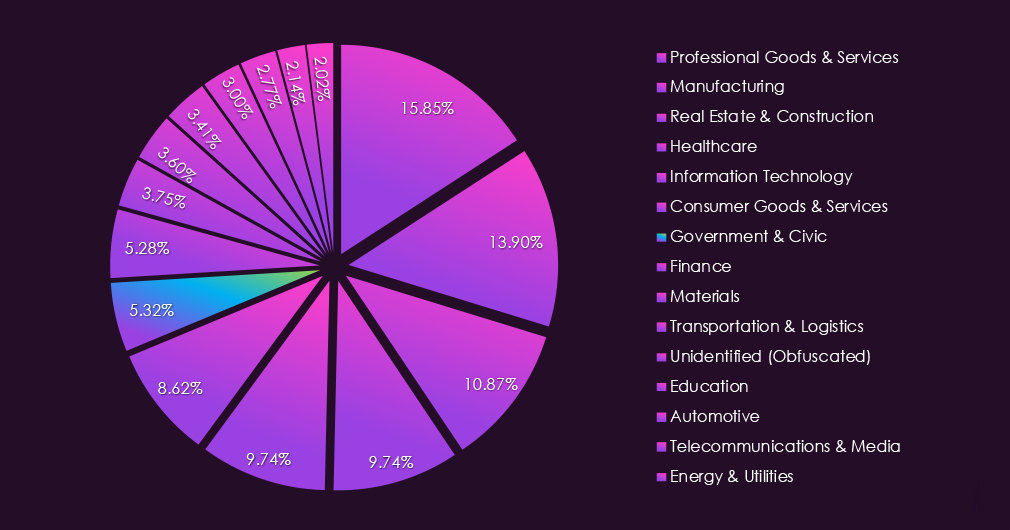
Furthermore, a quarterly comparison shows that the number of victims in government & civic organizations has been sustained. It went down slightly from 147 to 142 victims, a -3.4% decline. However, the overall interest, represented by share, has declined more significantly, going from 6.44% to 5.32% of all identified victims.
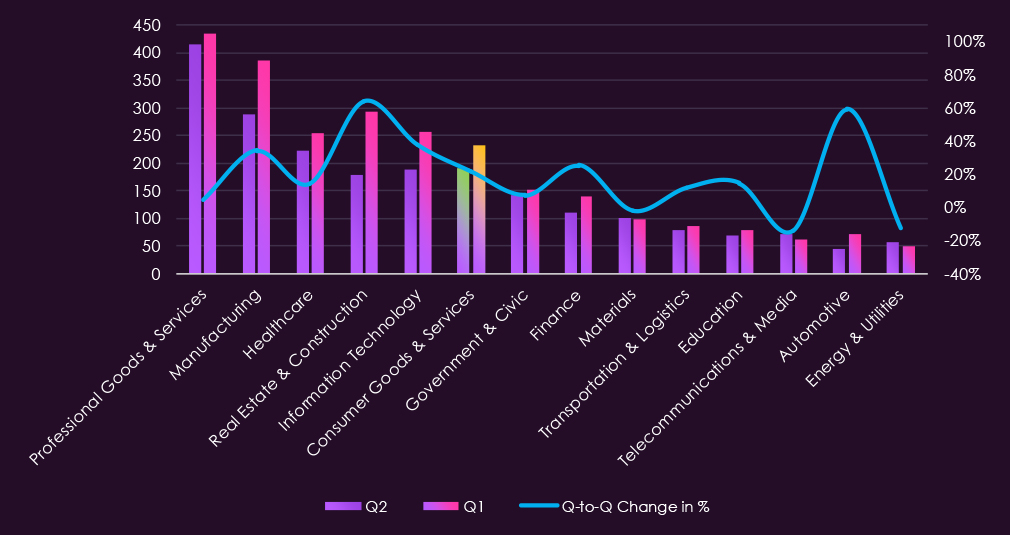
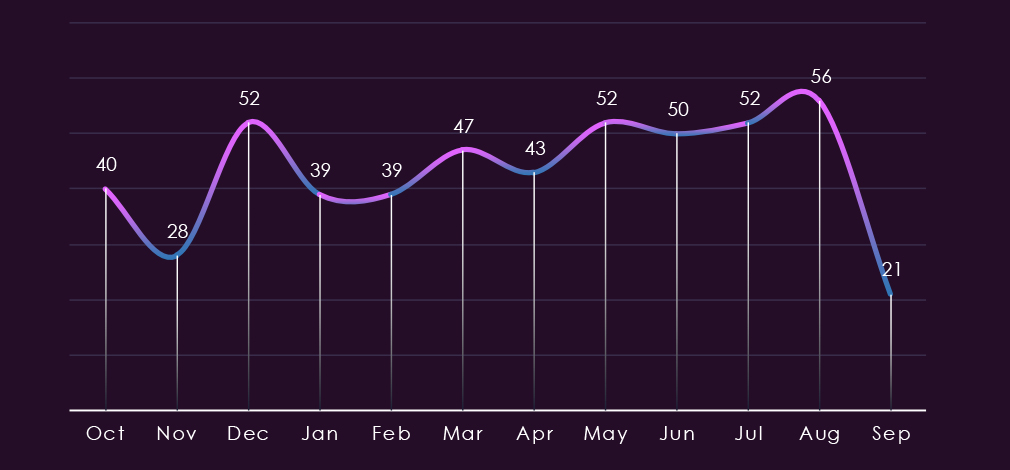
Monthly activity has oscillated with a mild upward trend from January towards August. Activity climbed steadily from the January and February low of 39 through to a period high of 56 in August. September only accounts for the first half so far.
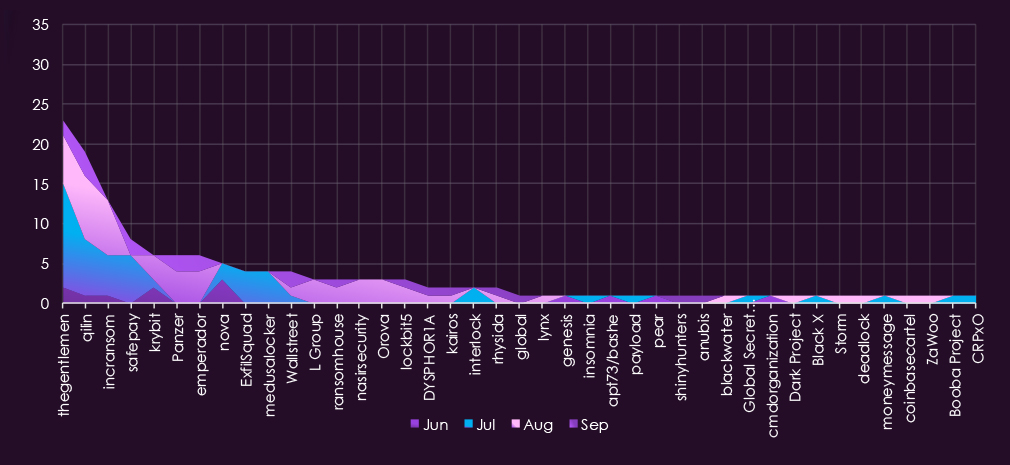
Thegentlemen and Qilin dominated the period, together accounting for roughly a third of all sector victims. Thegentlemen peaked sharply in July with 13 victims before falling back in August, while Qilin escalated steadily from a single June victim to eight in August and remained active into September.
The wider actor set turned over substantially across the period. ExfilSquad and Medusalocker concentrated their activity entirely in July, while Panzer, Emperador, L Group, Nasirsecurity, and Orova recorded their first sector victims in August. Several of these groups remained active into September, indicating the newly entered actors are sustaining rather than abandoning sector focus.
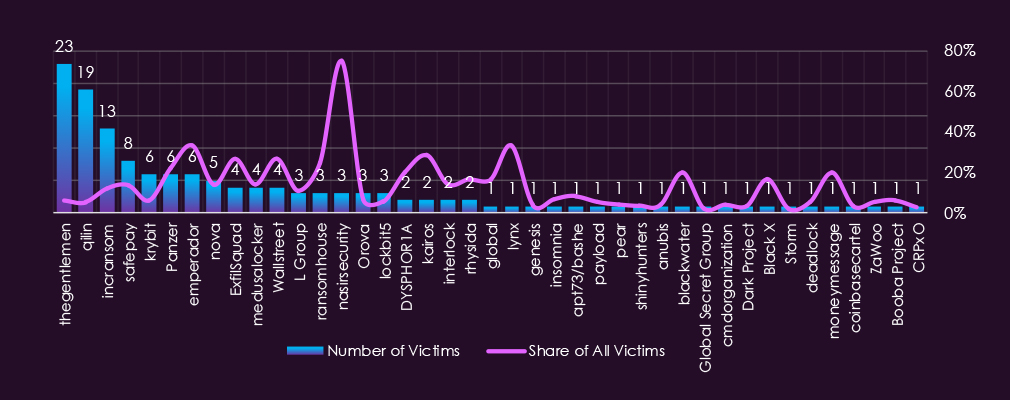
Out of the 99 gangs, 41 recorded victims in the government & civic industry in the last 90 days, representing a 41% participation rate.
Thegentlemen and Qilin had the highest numbers of victims by a wide margin, though both recorded low shares of their overall activity in this sector, at 6.3% and 5.4%, respectively.
Nasirsecurity stands out with 75.0% of its victims in this sector, followed by Emperador (33.3%), Lynx (33.3%), and Kairos (28.6%). ExfilSquad and Wallstreet both recorded 26.7%, indicating deliberate sector focus among a subset of mid-volume groups.
On average, gangs active in this industry recorded a 13.7% share of their victims from this industry. That is about 1 in 7 victims.
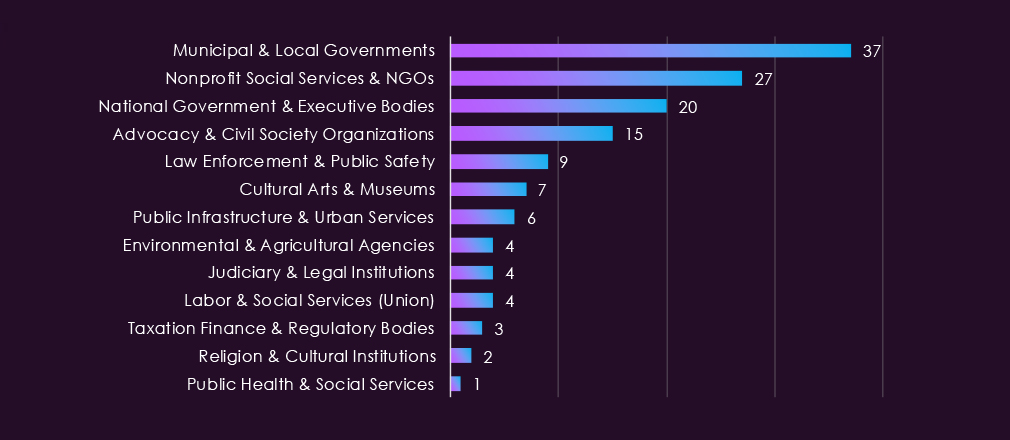
Municipal & Local Governments and Nonprofit Social Services & NGOs accounted for the largest share of victims by a wide margin, together representing close to half of all sector victims. Both operate with constrained security budgets while holding sensitive citizen and beneficiary records, and both face acute public pressure when service delivery is disrupted.
National Government & Executive Bodies and Advocacy & Civil Society Organizations formed a substantial second tier, with law enforcement and cultural institutions also recording meaningful activity. Victims were recorded across all 13 tracked subsectors, from judiciary and regulatory bodies through to public health services, confirming that no part of the public and civic vertical was untouched.
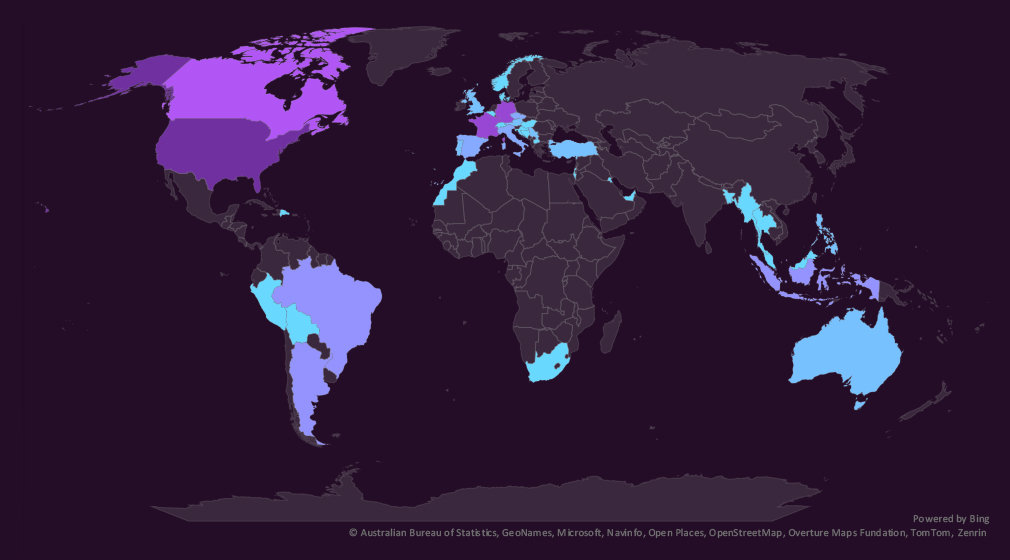
The geographic distribution heatmap underscores the widespread impact of ransomware, highlighting the countries where victims in this industry have been recorded.
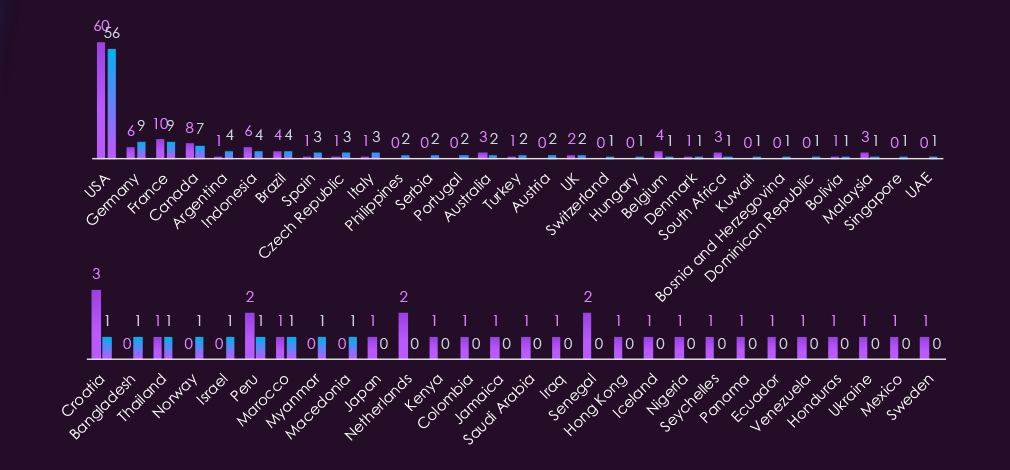
Government & civic victimology shows the USA is the most targeted, accounting for 41% of all victims.
Remaining activity is distributed among 37 countries for 81 victims.
Germany and Argentina recorded the highest elevations in the last 90 days, followed by Spain, the Czech Republic, Italy, and the Philippines.
Belgium, Indonesia, and South Africa saw the largest declines.
In the last 90 days, 38 countries recorded government & civic victims, 3 fewer than the 41 countries in the previous period.
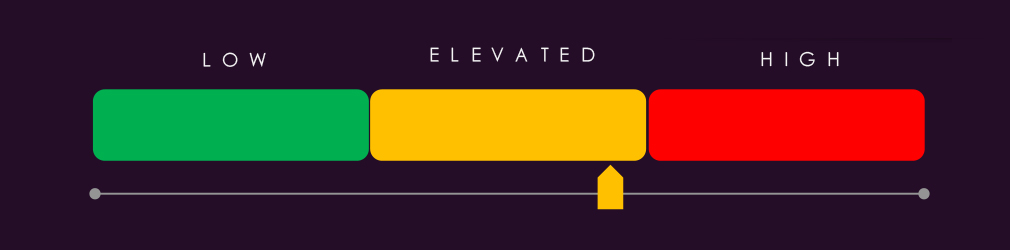
The Government & Civic sector threat landscape is expected to remain highly elevated through the next 90 days. Victim volume held broadly steady quarter-on-quarter, declining marginally from 147 to 142, while the sector’s share of all ransomware victims fell from 6.44% to 5.32%. The sector ranks 7th of 14 industries. Stable absolute volume against a growing overall victim pool indicates consistent rather than intensifying interest, though the consequence profile of public service disruption sustains the high rating independent of volume.
Volume outlook: The last seven months trended upward to an August high of 56. A baseline of 140 to 160 victims over the next 90 days is the most plausible outcome, with the upper end contingent on whether the groups that entered in August maintain their current tempo.
Actor behaviour: 41 of 99 active gangs recorded government & civic victims, a 41% participation rate that is moderate relative to commercial sectors and indicates this vertical is not a universal target. Thegentlemen and Qilin lead by volume while devoting a small fraction of overall activity here, consistent with opportunistic selection. Panzer, Emperador, L Group, Nasirsecurity, and Orova all entered in August with no prior sector history and several carried into September, suggesting the newly active set is establishing rather than testing sector presence.
Specialist targeting risk: Nasirsecurity directs 75.0% of its victims at this sector, the clearest specialist signal in the current actor set. Emperador, Lynx, Kairos, ExfilSquad, and Wallstreet each exceed 25%. The average sector share across active gangs is 13.7%, roughly one in seven victims. Groups with this level of proportional focus warrant monitoring as the most likely sources of sustained targeting.
Geographic targeting: Country coverage contracted slightly from 41 to 38, with activity concentrating rather than dispersing. The USA remains dominant at 41% of victims despite a small absolute decline. Germany and Argentina recorded the sharpest elevations, while Belgium, Indonesia, South Africa, Malaysia, and Croatia all fell. European coverage strengthened as coverage across Africa and parts of Asia-Pacific thinned.
Subsector risk: Municipal & Local Governments represent the highest-risk subsector by a clear margin. Local authorities combine weak security resourcing with direct responsibility for services whose interruption is immediately visible to the public, creating extortion leverage disproportionate to the size of the organisations involved. Nonprofit and NGO targeting carries a secondary concern, as beneficiary records frequently contain data on vulnerable individuals.
APT Campaigns (High): Government & civic featured in 55 of 130 campaign activity updates (42%), a five-fold increase from 11, with share broadly sustained at 46%. MISSION2074 recorded the highest count, followed closely by Lazarus Group, with FIN7 third. That top tier places China-linked espionage, DPRK activity and financially motivated crime alongside one another, meaning the sector faces espionage, criminal monetisation and regionally motivated pressure simultaneously. Edge appliance targeting is pronounced, with two Ivanti, two Citrix NetScaler and three Fortinet products recorded alongside Exchange, vCenter, Confluence and Log4j. The most consequential detail is PowerShell, WMI, SMB, SSH and RDP appearing in the targeting data, indicating campaigns progressing past initial access into hands-on activity inside compromised environments. Perimeter-focused detection will miss that stage. Victims span 49 countries, the widest footprint recorded this period.
Reported Cyber Incidents (High): 78 incidents recorded, ranking 2nd of 14, with the sector absorbing a wider range of threat types than any other. State espionage was persistent and openly attributed, with Russian operators running a zero-click Zimbra campaign that drew a coordinated international advisory, phishing EU officials, and targeting a Ukrainian agency managing seized Russian assets, while Chinese clusters operated across Central and Southeast Asia and Iranian activity spanned dissident surveillance and a fake national alert app deploying spyware. Critical infrastructure was the sharpest operational concern, with Iran-linked exploitation of programmable logic controllers drawing repeated joint advisories from CISA, the FBI and the EPA, and water utility disruption spreading across a dozen states. Ransomware reached every level of government, from Berlin refusing payment and then seeing credentials published, to Romania’s land registry stalling its property market, to Latvian officials resigning after a breach exposed data on much of the population.
Underground & Dark Web Chatter (Elevated): The sector placed 6th of 14 at 10.80% of industry-linked chatter with 5,011 mentions, carrying the flattest trajectory of any sector in this report. Breach and leak discussion account for almost the entire volume and rise steadily in every period without the sharp escalation seen elsewhere. That absence of volatility is the finding. Incremental growth across all three periods indicates continuous baseline activity rather than campaign-driven interest, meaning current volume is more likely to persist than to correct downward. Government data carries durable rather than perishable value, since identity records cannot be reissued the way payment cards can. DDoS, hacktivism, and claimed hacks all fell sharply after the first period, notable given government is the conventional target for ideological disruption, though these can escalate within days on a geopolitical trigger.
Vulnerabilities (Elevated): The sector ranked 6th of 14 at 4.41% of industry-linked disclosures across 116 mentions, with the most concentrated profile in the report. Remote and arbitrary code execution accounts for roughly four-fifths of final-period volume and rose more than fivefold across the window. Government environments run large estates of internet-facing citizen service portals, case management systems, and remote access gateways, all standing targets for unauthenticated code execution, while public sector patch cycles are constrained by procurement, change control, and service availability requirements that extend the exposure window well beyond disclosure. Legacy systems remaining in service past vendor support convert a disclosure into permanent rather than temporary exposure. Privilege escalation was the only other category trending upward, representing lateral movement risk where one administrative account can reach citizen records across multiple systems.
Ransomware (Elevated): 142 victims, down marginally from 147, ranking 7th of 14, with share falling from 6.44% to 5.32% against a growing victim pool. Monthly activity trended upward through the final months to an August high of 56. Municipal & Local Governments and Nonprofit Social Services & NGOs account for close to half of all sector victims, both operating with constrained security budgets while holding sensitive citizen and beneficiary records, and both facing acute public pressure when services are disrupted. 41 of 99 active gangs recorded victims, a 41% participation rate that is moderate relative to commercial sectors, with Thegentlemen and Qilin leading by volume while devoting small fractions of their activity here. Nasirsecurity directs 75.0% of its victims at this sector, the clearest specialist signal in the current actor set. The rating rests on consequence rather than volume, since public service interruption is immediately visible and creates extortion leverage disproportionate to organisation size.
