

The CYFIRMA Industry Report delivers original cybersecurity insights and telemetry-driven statistics of global industries, covering one sector each week for a quarter. This report focuses on the government & civic, presenting key trends and statistics in an engaging infographic format.
Welcome to the CYFIRMA infographic industry report, where we delve into the external threat landscape of the government & civic industry over the past three months. This report provides valuable insights and data-driven statistics, delivering a concise analysis of attack campaigns, phishing telemetry, and ransomware incidents targeting governments, municipal services, law enforcement and other civic organizations.
We aim to present an industry-specific overview in a convenient, engaging, and informative format. Leveraging our cutting-edge platform telemetry and the expertise of our analysts, we bring you actionable intelligence to stay ahead in the cybersecurity landscape.
CYFIRMA delivers pre-emptive cybersecurity, cyber threat intelligence, and external threat landscape management through its platforms, DeCYFIR and DeTCT. These platforms have been purpose-built over many years to continuously collect, correlate, and analyse large volumes of external threat data, combining proprietary intelligence automation with deep, hands-on cyber threat research.
For the purposes of this report, the analysis draws on intelligence generated from CYFIRMA’s platforms. The data referenced has been processed through automated correlation and enrichment mechanisms, informed and validated by human-led research and investigative expertise, and sourced from both structured and unstructured external intelligence channels.
While this report contains data collected and processed by our in-house AI and ML, all charts, statistics, and analyses are done by human CYFIRMA CTI analysts to ensure the highest quality and provide accurate insights.
Government & civic organizations featured in 11 out of the 20 observed campaigns, which is a presence in 55% of all campaigns. This is an increase from the previous period where government & civic organizations were present in 4 out of 5 campaigns, however, a decline from 80% presence.
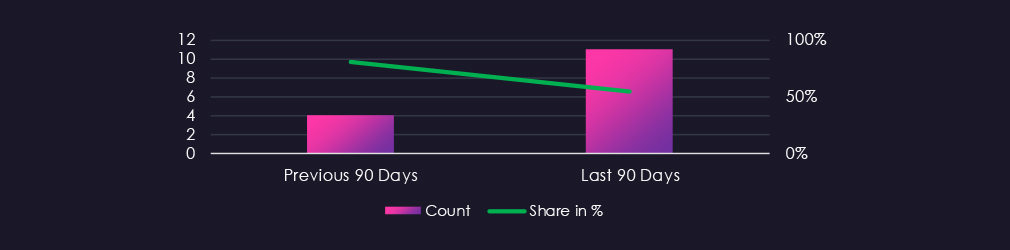

APT activity against government & civic organizations has been declining over months. January observed five campaigns, February one less, and March declined down to two campaigns. April so far has not seen a campaign.
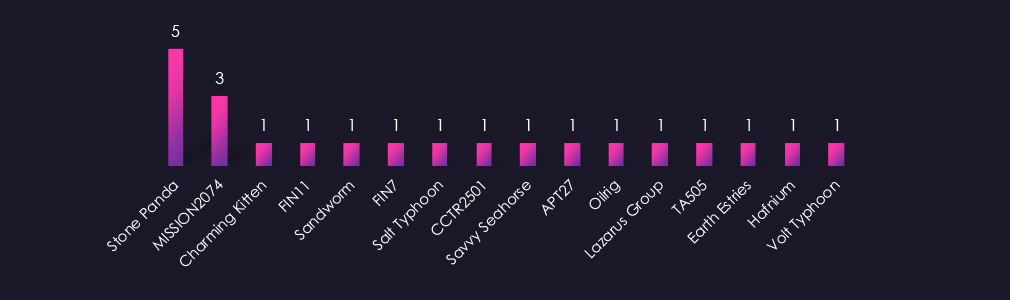
Observed APT campaigns are again dominated by suspected China-linked, state-sponsored actors. Stone Panda leads with the highest number of observed campaigns, followed by MISSION2074, with additional China-aligned representation from Salt Typhoon, APT27, Earth Estries, Hafnium, and Volt Typhoon.
Russia-linked Sandworm appears as the sole Russian state actor this period, notable given its known focus on destructive campaigns targeting government infrastructure. Iran-linked OilRig and Charming Kitten both feature, while North Korea-associated Lazarus Group also appears. Financially motivated actors FIN11, FIN7, and TA505 are present alongside Turkish-speaking cybercriminal group CCTR2501 and suspected Russian-speaking Savvy Seahorse.
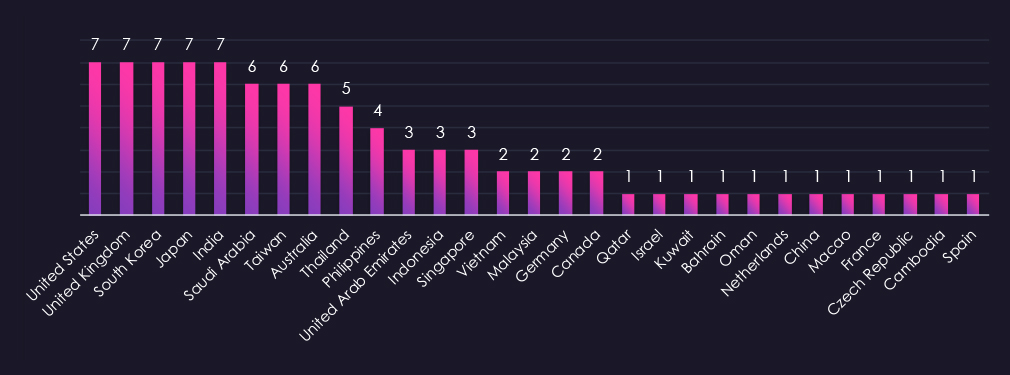
Victim distribution is concentrated in the Asia-Pacific region, consistent with the dominant China-linked actor profile observed this period. Notably, the top tier is unusually even, with the United States, United Kingdom, South Korea, Japan, and India all recording identical victim counts. Saudi Arabia, Taiwan, and Australia follow closely.
Southeast Asian countries including Thailand, the Philippines, Indonesia, Singapore, and Vietnam also appear regularly, consistent with the geographic focus of several observed threat actors. Middle Eastern presence is most notable in Saudi Arabia and the UAE, with Gulf states including Qatar, Kuwait, Bahrain, and Oman also recording victims. Remaining cases are spread across continental Europe and isolated instances in East Asia and Latin America.
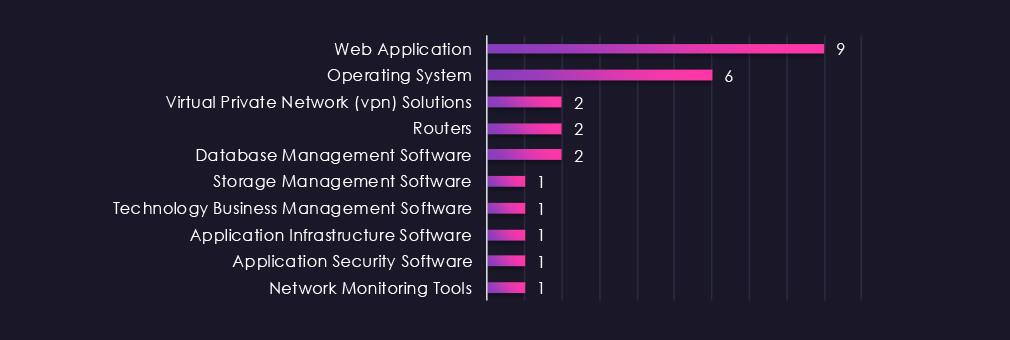
Web applications and operating systems account for the majority of observed attacks, consistent with patterns seen across other sectors this period. VPN solutions and routers each recorded multiple instances alongside database management software, reflecting threat actor interest in both network-level access and data collection objectives.
The remaining targeted technologies, including storage management, application infrastructure, application security software, and network monitoring tools, each recorded single instances. The presence of VPNs, routers, and network monitoring tools is particularly notable in a government sector context, consistent with the infrastructure access and persistent surveillance techniques associated with state-sponsored actors observed during this period.

Over the past 90 days, the government & civic industry has been moderately impacted by advanced persistent threat (APT) campaigns.
11 out of 20 observed APT campaigns recorded victims in this industry. That is 55% presence in observed campaigns.
That is an increase from the previous 90-day period, during which 4 out of 5 campaigns targeted this industry; however, there was a decline in the overall share from the previous 80%.
Monthly Trends
Monthly trends show a decline in APT activity against government & civic organizations over the months. In January, five campaigns were observed, one less in February, and further declining to two campaigns in March. As of April, no campaigns have been observed.
Key Threat Actors
Campaigns show a concentration of suspected China-linked threat actors, with Stone Panda recording the highest number of observed campaigns, followed by MISSION2074. Additional China-linked TAs include Salt Typhoon, APT27, Earth Estries, Hafnium, and Volt Typhoon. Russia-linked Sandworm appears as the sole Russian state actor. Iran-linked OilRig and Charming Kitten both feature, alongside the North Korea-associated Lazarus Group. Financially motivated actors FIN11, FIN7, and TA505 are also present.
Geographical Impact
Victim distribution spans 29 countries, with the top tier notably even across the United States, United Kingdom, South Korea, Japan, and India, suggesting broad deliberate targeting rather than concentration on specific nations. Saudi Arabia, Taiwan, and Australia follow closely. Southeast Asian countries, including Thailand, the Philippines, and Indonesia, appear regularly, with Gulf states also recording victims. Remaining cases are spread across continental Europe and isolated instances in East Asia.
Targeted Technologies
Web applications and operating systems account for most of the observed attacks. VPN solutions and routers each feature across multiple campaigns alongside database management software, reflecting interest in both network-level access and data collection. The presence of VPNs, routers, and network monitoring tools is consistent with infrastructure access and persistent surveillance techniques associated with state-sponsored actors observed in this period.
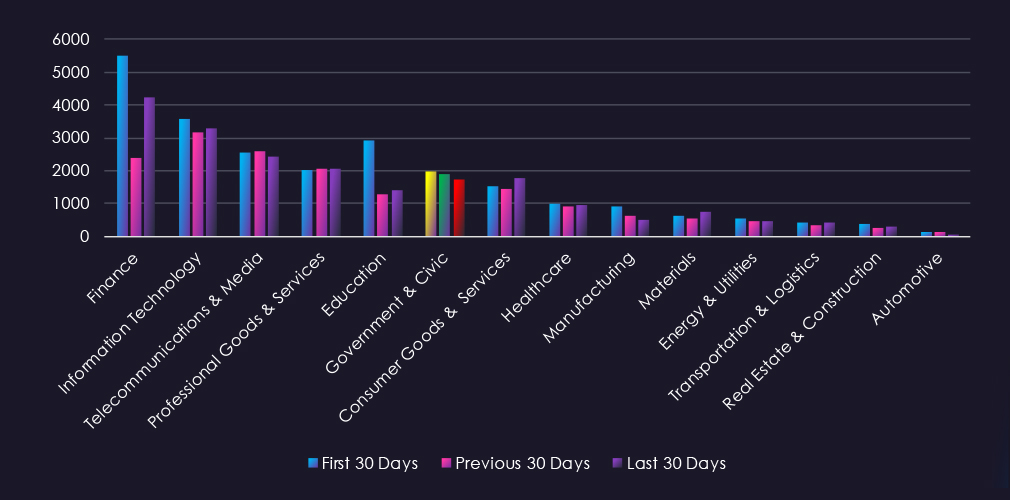
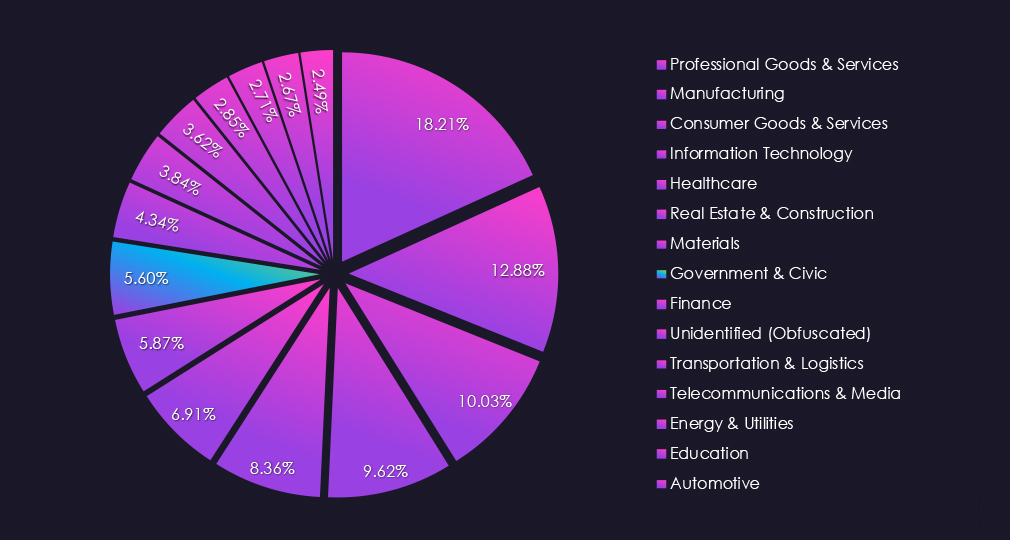
Over the past 90 days, DeCYFIR and DeTCT platforms tracked 724 cyber incidents reported publicly. We could identify the industry for 443 of these incidents (60.5%).
Government & civic was detected in 90 incidents, which equals 12.43% of the incidents where we knew the industry, ranking 2nd out of 14 industries.
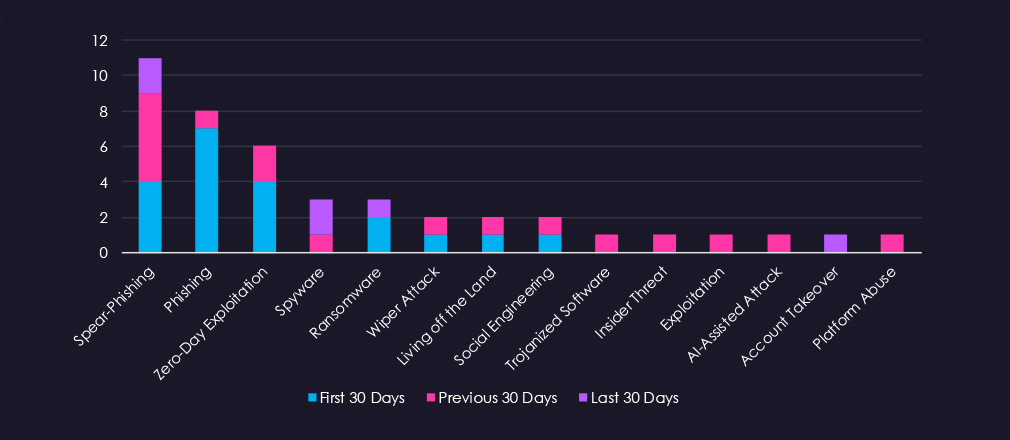
Phishing-based attacks dominated the period, with spear-phishing and phishing accounting for the majority of observed activity. Spear-phishing peaked in the previous 30 days before declining in the last 30 days. Zero-day exploitation was the second most common technique, concentrated in the first 30 days. Spyware appeared in the last 30 days, suggesting a potential shift toward information gathering. Ransomware, wiper attacks, living off the land, social engineering, and trojanized software each appeared sporadically. Emerging techniques, including AI-assisted attacks and insider threats, appeared once each, indicating limited adoption. The overall pattern reflects a sustained focus on credential compromise and initial access rather than post-exploitation or data destruction.
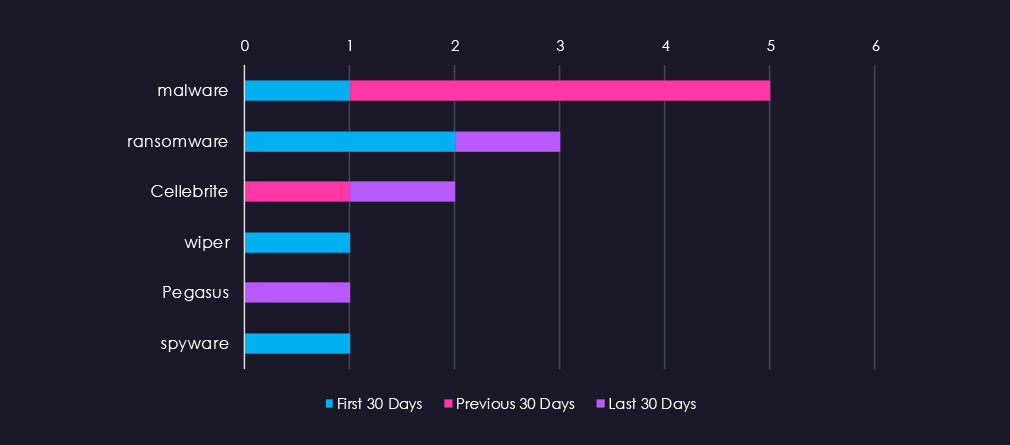
Malware identification was limited across Government & Civic incidents. Ransomware appeared most frequently across two periods. Generic malware and spyware classifications each appeared once, while Cellebrite and Pegasus appeared once each.
Wiper malware was identified once in the first 30 days. The diversity of tools and limited frequency of individual detections suggest varied attack approaches rather than reliance on specific malware families.
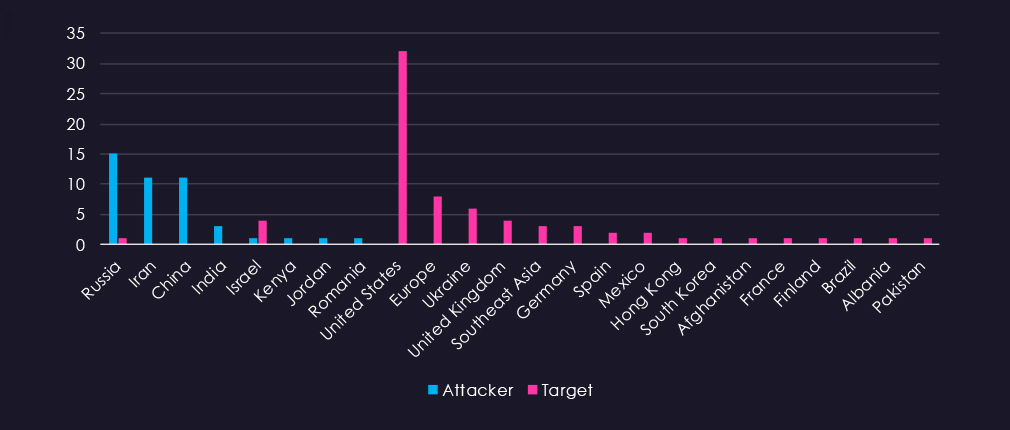
Attacking countries showed strong state-linked patterns, with Russia, Iran, and China each identified in multiple incidents, suggesting coordinated state-sponsored activity. Israel appeared once as both attacker and target. Victim attribution was substantially more complete than attacker data, with the United States accounting for the majority of targets, followed by Europe, Ukraine, and the United Kingdom.
Targeting extended globally across Southeast Asia, Germany, Spain, Mexico, and other regions, reflecting the broad geographic scope of activity against government entities. This disparity between attacker and victim attribution reflects public reporting patterns, where victim countries are more frequently disclosed than attacking nations.

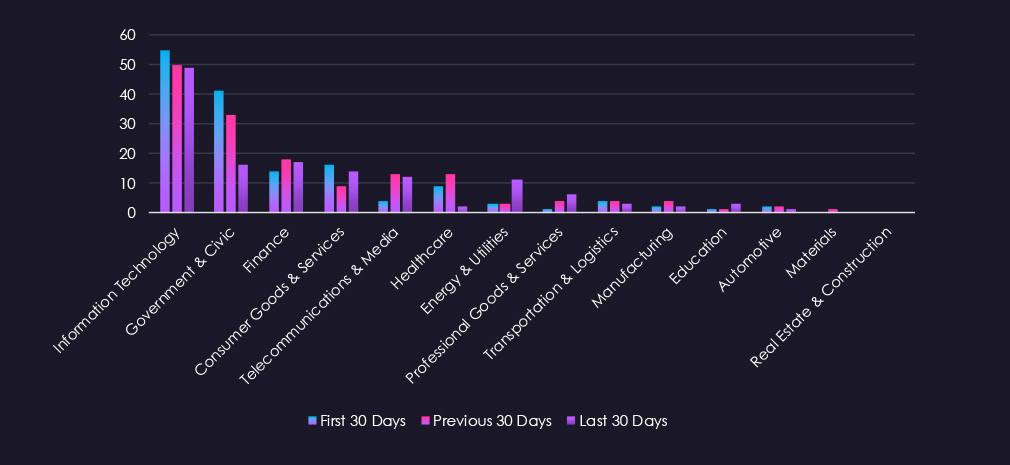
Over the past 90 days, the government & civic organizations has been significantly impacted by cyber incidents.
90 out of 443 of industry-linked cyber incident reports were against government & civic organizations. That is a 12.43% presence, ranking 2nd out of 14 industries.
Monthly Trends
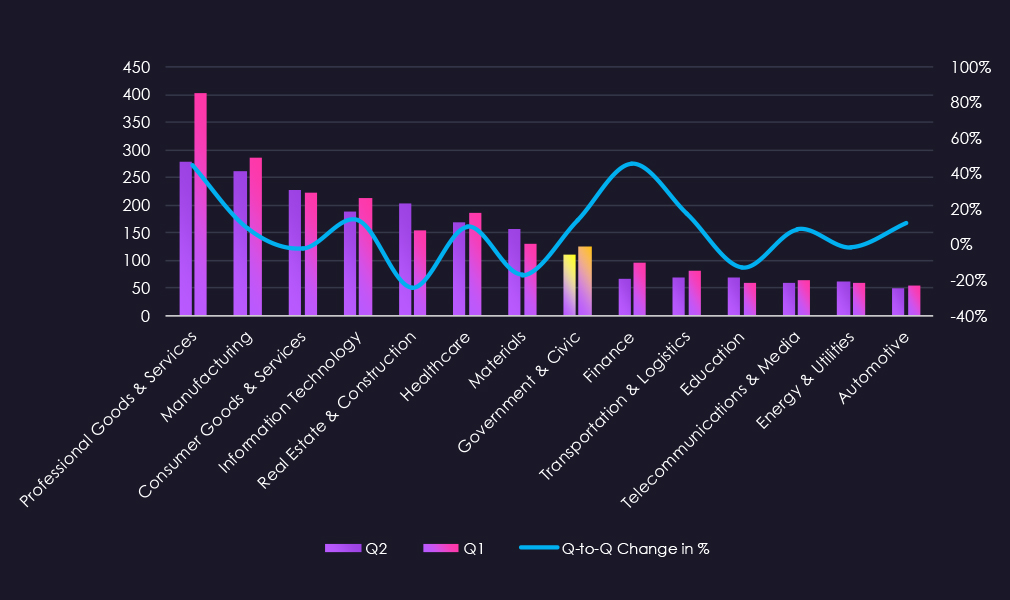
Activity was gradually declining in the first 60 days, from 41 to 33 incidents. Then during the last 30 days sharply falling to 16 incidents.
Attack Techniques
Phishing-based attacks dominated the period, with spear-phishing and phishing as primary vectors. Spear-phishing peaked in the previous 30 days before declining in the last 30 days. Zero-day exploitation was the second most common technique, concentrated in the first 30 days. Spyware appeared in the last 30 days, suggesting a shift toward information gathering. Ransomware, wiper attacks, and social engineering each appeared sporadically. AI-assisted attacks and insider threats appeared once, indicating limited adoption. The overall pattern reflects focus on credential compromise and initial access.
Malware/Tools used
Malware identification was limited. Ransomware appeared most frequently. Cellebrite, Pegasus, and wiper malware each appeared once. The diversity of tools suggests varied attack approaches rather than reliance on specific malware families.
Geographical Impact
Attacking countries showed state-linked patterns, with Russia, Iran, and China identified in multiple incidents. Victim attribution was substantially more complete, with the United States as the primary target, followed by Europe, Ukraine, and the United Kingdom. Targeting extended globally across Southeast Asia, Germany, Spain, and Mexico, reflecting a broad geographic scope. This disparity between attacker and victim attribution reflects public reporting patterns.
Over the past 90 days, CYFIRMA’s telemetry has identified 5,593 mentions of government & civic organizations out of a total of 62,498 industry-linked mentions. This is from a total of 300k+ posts across various underground and dark web channels and forums.
Government & civic organizations placed 6th out of 14 industries in last 90 days with share of 8.95% of all detected industry-linked chatter.
Below is a breakdown by 30 day periods of all mentions.
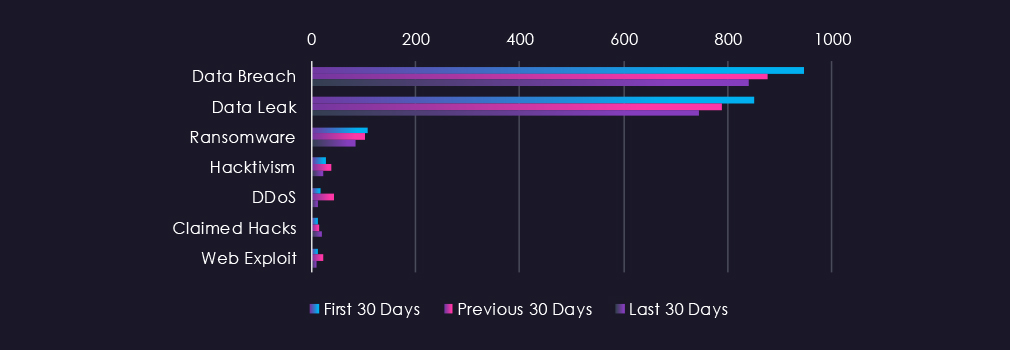
Underground & dark web chatter related to the government & civic sector over the last 90 days is dominated by data breach and data leak discussions, which remain consistently elevated but show a downward trend across all three 30-day periods. Data breaches declined from 948 to 841, and data leaks from 850 to 746. Ransomware mentions decrease consistently from 107 to 85. DDoS activity shows a significant mid-period elevation followed by a sharp decline to 13 mentions. Hacktivism and web exploits show variable activity with overall downward trajectories, while claimed hacks remain at comparatively lower volumes with a modest increase in the final period.

In total, government & civic organizations comprise 8.95% of all detected industry underground and dark web chatter in the last 90 days. And ranking 6th out of 14 industries.
Below are observed key trends across 90 days:
Data Breach
948 → 876 → 841. Consistent decline across all periods. Government and civic entities remain significant targets due to sensitive citizen data, infrastructure credentials, and classified information, though the downward trend suggests fewer newly surfaced large-scale compromises in dark web discussions.
Data Leak
850 → 789 → 746. Steady decline across all periods. Indicates continued circulation of government and civic-related data such as citizen records, credentials, and operational documentation, though leak postings are less frequent in the final period.
Ransomware
107 → 102 → 85. Consistent decline across all periods. Ransomware targeting of government and civic infrastructure is decreasing, potentially reflecting heightened security postures or reduced perceived return on investment in this sector.
Hacktivism
28 → 37 → 22. Mid-period elevation followed by a decline in the final period. Reflects variable ideological targeting of government and civic infrastructure with reduced emphasis recently.
DDoS
17 → 42 → 13. Sharp mid-period spike followed by a significant decline. Indicates episodic rather than sustained emphasis on disruption-based attacks against government entities.
Claimed Hacks
13 → 14 → 20. A modest increase in the final period. Suggests growing publicly claimed intrusions or access sales involving government and civic entities.
Web Exploit
12 → 22 → 9. Mid-period elevation followed by a decline. Reflects variable probing of government web portals, civic platforms, and administrative systems with reduced activity recently.
Over the past 90 days, CYFIRMA’s telemetry has identified 153 mentions of government & civic organizations out of a total of 3,925 industry mentions. This is from over 10k CVEs reported and updated in the last 90 days.
Government & civic organizations ranked 10th out of 14 industries in the last 90 days, with a share of 3.90% of all detected industry-linked vulnerabilities.
Below is a breakdown by 30-day periods of all mentions.
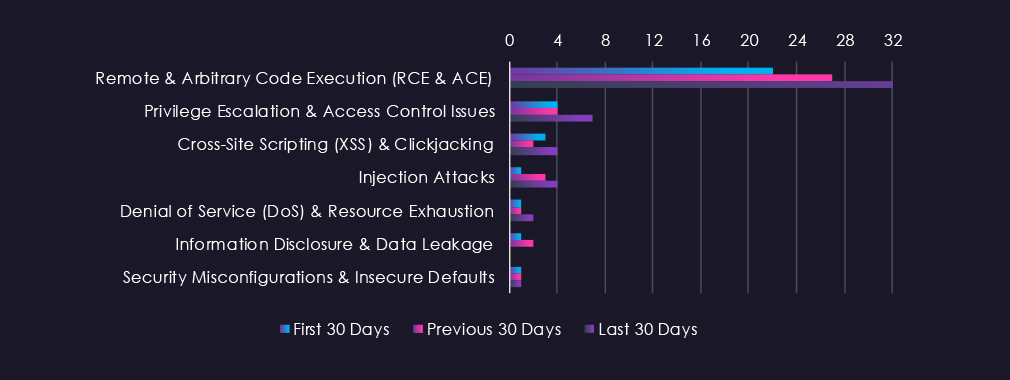
Reported CVEs in the government & civic sector over the last 90 days are dominated by remote and arbitrary code execution vulnerabilities, which show a sharp increase in the final period, more than doubling from initial levels. Privilege escalation and access control issues show modest increases across periods. Cross-site scripting and injection attack vulnerabilities remain at low levels with variable activity. Denial of service vulnerabilities remain minimal, while information disclosure and security misconfiguration disclosures show negligible activity.

In total, info government & civic organizations comprise of 3.90% of all detected industry-linked vulnerabilities in the last 90 days. And ranking 10th out of 14 industries.
Below are observed key trends across 90 days:
Remote & Arbitrary Code Execution (RCE & ACE)
22 → 27 → 62. Sharp and escalating increase across all periods, more than doubling in the final period. RCE and ACE vulnerabilities represent the highest-impact threats to government and civic infrastructure due to direct system compromise potential and access to critical systems.
Privilege Escalation & Access Control Issues
4 → 4 → 7. A modest increase in the final period. Reflects growing disclosures of vulnerabilities enabling lateral movement and privilege advancement in government systems.
Cross-Site Scripting (XSS) & Clickjacking
3 → 2 → 4. Minimal fluctuation across all periods. Reflects limited client-side vulnerability disclosures affecting government web applications.
Injection Attacks
1 → 3 → 4. Gradual increase across periods. Reflects slowly growing volume of vulnerabilities targeting application logic in government systems.
Denial of Service (DoS) & Resource Exhaustion
1 → 1 → 2. Minimal and stable activity across periods. Represents negligible disclosure volume of DoS-enabling vulnerabilities.
Information Disclosure & Data Leakage
1 → 2 → 0. Decline in the final period. Represents minimal and inconsistent disclosure activity.
Security Misconfigurations & Insecure Defaults
1 → 1 → 1. Minimal and stable across all periods. Represents negligible disclosure in this vulnerability category.
In the past 90 days, CYFIRMA has identified 124 verified ransomware victims in government & civic organizations. This accounts for 5.60% of all 2,213 ransomware victims during the same period. Placing this sector 8th out of 14 industries.
Furthermore, a quarterly comparison shows that the number of victims in government & civic organizations has increased. It went from 109 to 124 victims, a 13.8% increase. The overall interest, represented by share, also grew from 9.54% to 10.01% of all victims.
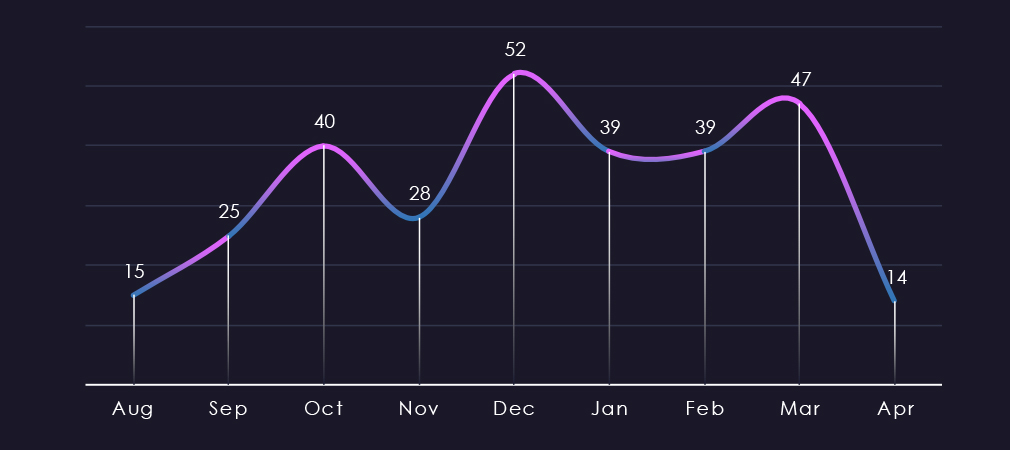
The monthly trendline shows us a sharp increase from the August low to October. November recorded another short-lived dip, followed by a spike to 180 days high during December. Although slightly lower than December, the number has remained elevated since then.
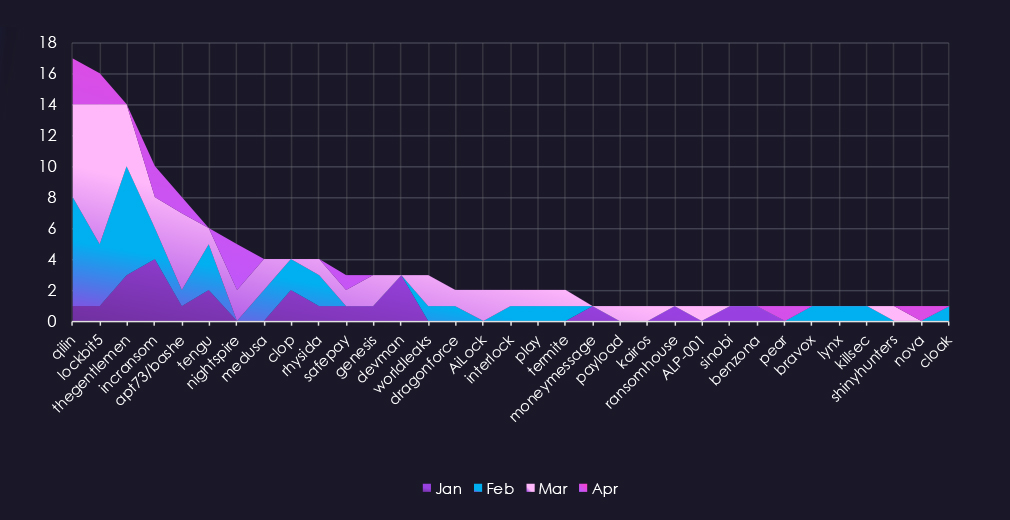
A breakdown of monthly activity per gang reveals which gangs were most active each month. For instance, leading gang Qilin, after a low volume in January, recorded a high number of victims in all the following months.
Furthermore, LockBit5 has been most active during March, whereas TheGentlemen was most active in February.
Lastly, gangs like Devman or AiLock contributed only during a single month.
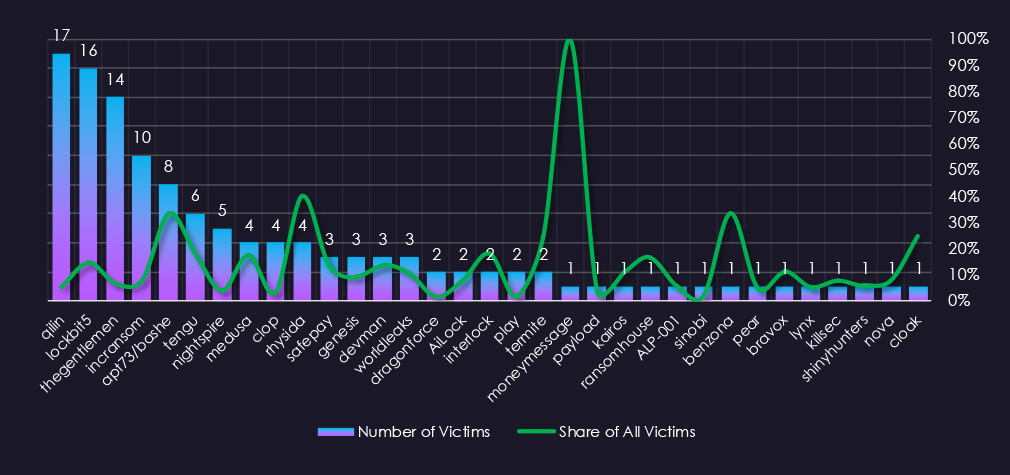
Out of the 71 gangs, 33 recorded victims in the government & civic organizations in the last 90 days, representing a 46% participation.
Qilin had the highest number of victims, but just 5.1% share out of all their 333 victims in this industry.
Some gangs show much more focus on this sector than others. Lockbit5, APT73/Bashe, Tengu, Medusa, and Rhysida have the highest shares from gangs with more than 4 victims.
Among gangs with more than 3 victims, on average, 14%, 1 in 7 of their victims are government & civic organizations.
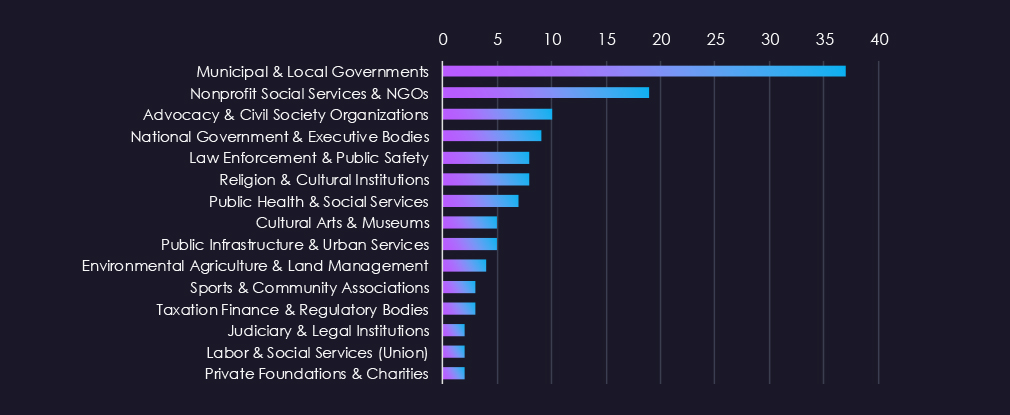
Municipal & Local Governments accounted for the largest share of victims, consistent with their broad attack surface, limited security resources, and the operational pressure ransomware creates for public-facing services. Nonprofit Social Services & NGOs and Advocacy & Civil Society Organizations also recorded notable activity, reflecting the value of sensitive beneficiary and donor data to ransomware operators.
National bodies, law enforcement, and public health services each saw lower but meaningful victim counts, while the remaining subsectors were largely quiet across the period.
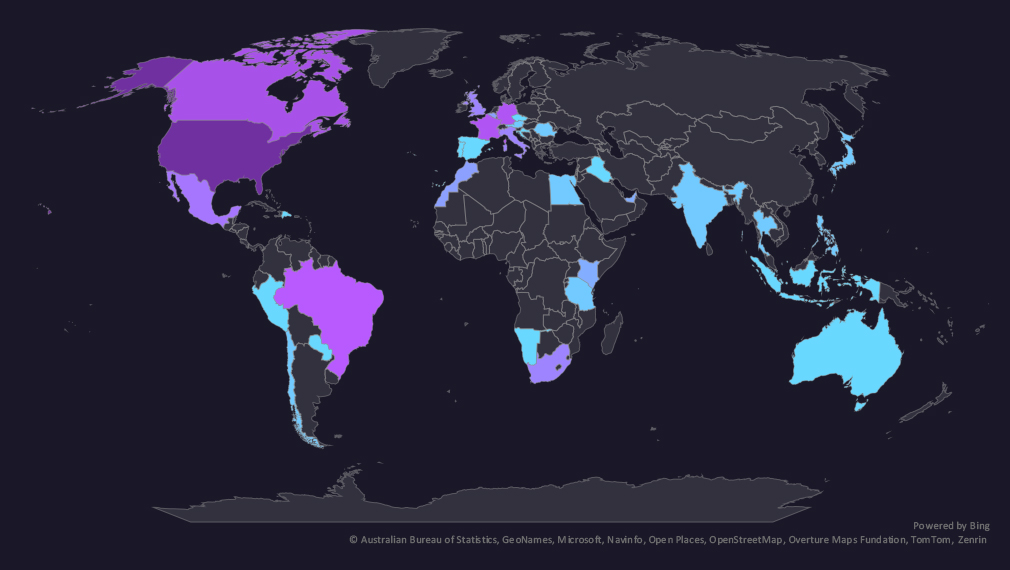
The geographic distribution heatmap underscores the widespread impact of ransomware, highlighting the countries where victims in this industry have been recorded.
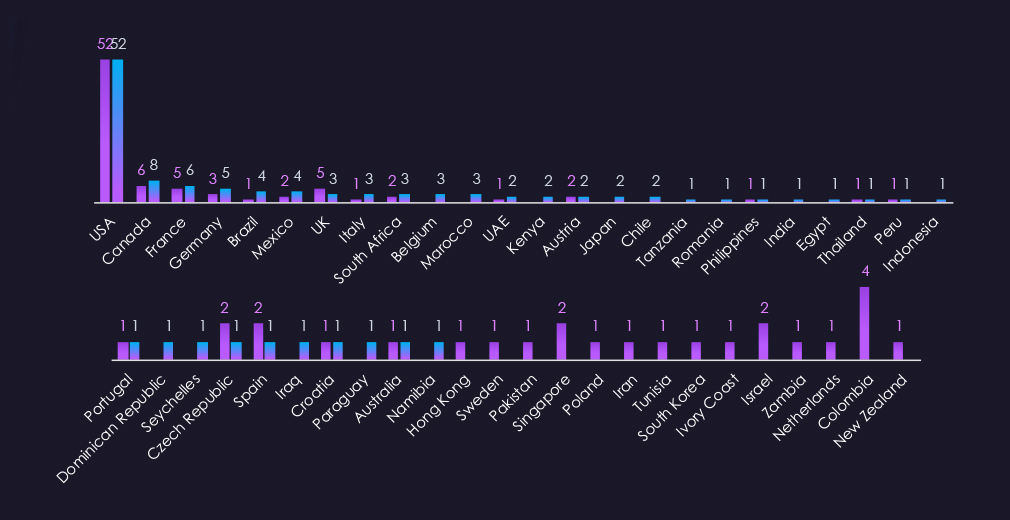
Government & civic victimology shows sustained interest in the USA. Brazil, Italy, Belgium, and Morocco were among the countries with the highest elevations.
Colombia, the UK, Singapore, and Israel, on the other hand, had the largest declines.
In the last 90 days, 34 countries recorded government & civic victims. Just one more than 33 countries in the previous period.
Overall, almost half (43%) of all victims are based in the US. The remaining victims are relatively highly distributed.

Government & civic organizations ranked 8th out of 14 monitored industries, recording 124 victims in the last 90 days, a meaningful increase of 13.8% from the previous 109.
Overall share also grew from 9.54% to 10.01% of all ransomware victims.
Municipal and local governments were the most targeted, followed by nonprofits and civil society organizations. National bodies, law enforcement, and public health services recorded lower but notable activity.
Monthly Activity Trends
The monthly trendline shows us a sharp increase from the August low to October. November recorded another short-lived dip, followed by a spike to 180 days high during December. Although slightly lower than December, the number has remained elevated since then.
Ransomware Gangs
A total of 33 out of 71 active ransomware groups targeted this sector in the past 90 days. That is 46% participation.
Qilin: Continuously the most active gang with 333 victims across industries in the last 90 days. 17 were from this sector (5.1%).
LockBit5, APT73/Bashe, Tengu, Medusa, Rhysida: Recorded the highest shares of victims among gangs with a higher number of victims, suggesting a focus on this industry.
The average share among groups with more than 3 victims was 14%. That is 1 in 7 of their victims were from government & civic organizations.
Geographic Distribution
The geographic distribution of ransomware victims is relatively high, and spread across 34 countries, up by one from 33 in the previous period.
The USA recorded 43% of all victims.
Brazil, Italy, Belgium, and Morocco recorded the highest elevations.
Colombia, the UK, Singapore, and Israel, on the other hand the largest declines.
For a comprehensive, up-to-date global ransomware tracking report, please refer to our new monthly “Tracking Ransomware” series here.
APT Campaigns (Moderate): Government & civic organizations saw 55% of observed APT campaigns record victims in this period, though the overall share declined from 80% prior as the campaign pool expanded. China-linked actors dominate, with Stone Panda and MISSION2074 leading, and an unusually broad roster including Salt Typhoon, Volt Typhoon, and Earth Estries. Russia’s Sandworm appears as the sole Russian state actor. Activity declined steadily month-on-month, with no campaigns observed in April so far. VPN and router targeting alongside web applications points to persistent surveillance and infrastructure access as primary objectives.
Reported Cyber Incidents (High): Government & civic ranked 2nd across all industries. Phishing and spear-phishing dominated as the primary attack vectors, with zero-day exploitation concentrated in the first 30 days and spyware emerging in the final period, suggesting a shift toward sustained information gathering. Russia, Iran, and China were the most identified attacking entities. The United States was the primary victim country, with targeting extending broadly across Europe, Southeast Asia, and beyond. Activity declined sharply in the final 30 days.
Underground & Dark Web Chatter (Moderate): The sector ranked 6th at 8.95% of detected chatter. Breach, leak, ransomware, and DDoS mentions all declined across the period, suggesting reduced threat actor discussion of government targets in open underground forums. The one counter-trend is claimed hacks, which rose in the final period, indicating growing public claims of access or intrusion against government and civic entities despite the broader decline.
Vulnerabilities (Moderate): The sector ranked 10th in disclosure volume, but RCE vulnerabilities more than doubled in the final period to 62 — a sharp escalation given the sensitivity of government systems to direct compromise. Privilege escalation disclosures also grew in the final period. Overall volume remains lower than in the commercial sectors, though the RCE trajectory is the primary concern for critical government infrastructure.
Ransomware (Moderate): 124 victims, up 13.8% from 109 prior, with victim count remaining elevated since a December spike. Municipal and local governments were the most targeted, followed by nonprofits and civil society organizations. LockBit5, APT73/Bashe, Tengu, Medusa, and Rhysida all show notable sector focus. Victim spread reached 34 countries, with Brazil, Italy, Belgium, and Morocco recording the largest increases this period.