
FINANCE Q2 I 2026 : INDUSTRY REPORT
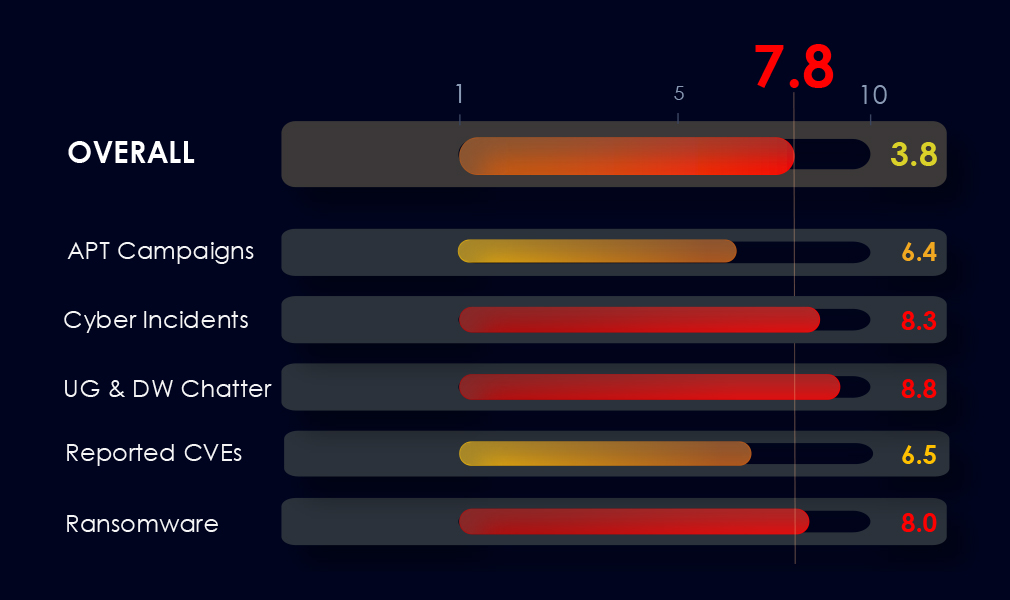
APT Campaigns – 6.4 →
Finance featured in 14 of 23 campaigns (61%), the same share as last period but across a much larger campaign set. Activity is exclusively state-sponsored. MISSION2074 leads with 7 appearances; Lazarus Group doubled from 2 to 5 campaigns. Web application targeting is present in 12 of 14 campaigns, and geographic reach has expanded to 32 victim countries.
Cyber Incidents – 8.3 ↑
65 incidents, ranked 3rd of 14 industries. Aggregate losses exceed USD 850 million, driven by North Korean crypto theft via Lazarus Group and BlueNoroff/UNC1069. Final 30-day window saw increased sophistication: AI-augmented social engineering, ClickFix macOS lures, and NFC-skimming malware. ATM jackpotting emerged as a distinct physical infrastructure threat.
Dark Web Chatter – 8.8 ↑
Finance ranked 2nd of 14 industries with 8,721 mentions (15.88%). Data breach and leak discussions dominated but declined sharply in the final period. Web exploit chatter is trending down, more likely signalling established footholds than reduced interest. Activity follows a campaign-cycle oscillation pattern, with the next elevated window probable around July-August.
Vulnerabilities – 6.5 ↑
100 CVEs (2.52%), ranked 12th of 14 industries. RCE vulnerabilities escalated every month from 8 CVEs in February to 23 in April, with no plateau. Cross-site scripting spiked in the final period. Customer-facing web applications and exposed financial application servers are the highest-priority remediation surface.
Ransomware – 8.0 ↑
114 victims (4.38%), ranked 9th of 14 industries. Up 46.2% quarter-on-quarter (78 to 114), with both count and sector share rising. Financial Advisory and Wealth Management recorded the highest sub-sector victim count. ShinyHunters directs 26% of all its victims to finance. The USA accounts for 54% of all victims.
The CYFIRMA Industry Report delivers original cybersecurity insights and telemetry-driven statistics of global industries, covering one sector each week for a quarter. This report focuses on the finance industry, presenting key trends and statistics in an engaging infographic format.
Welcome to the CYFIRMA infographic industry report, where we delve into the external threat landscape of the finance industry over the past three months. This report provides valuable insights and data-driven statistics, delivering a concise analysis of attack campaigns, phishing telemetry, and ransomware incidents targeting banks, insurance, brokers, and other financial organizations.
We aim to present an industry-specific overview in a convenient, engaging, and informative format. Leveraging our cutting-edge platform telemetry and the expertise of our analysts, we bring you actionable intelligence to stay ahead in the cybersecurity landscape.
CYFIRMA delivers pre-emptive cybersecurity, cyber threat intelligence, and external threat landscape management through its platforms, DeCYFIR and DeTCT. These platforms have been purpose-built over many years to continuously collect, correlate, and analyse large volumes of external threat data, combining proprietary intelligence automation with deep, hands-on cyber threat research.
For the purpose of this report, the analysis draws on intelligence generated from CYFIRMA’s platforms. The data referenced has been processed through automated correlation and enrichment mechanisms, informed and validated by human-led research and investigative expertise, and sourced from both structured and unstructured external intelligence channels.
While this report contains data collected and processed by our in-house AI and ML, all charts, statistics, and analyses are done by human CYFIRMA CTI analysts to ensure the highest quality and provide accurate insights.
Finance organizations featured in 14 out of the 23 observed campaigns, which is a presence in 61% of all campaigns, an increase from the previous period, where finance organizations were present in 8 out of 13 campaigns. However, an identical share of 61% of campaigns was observed.
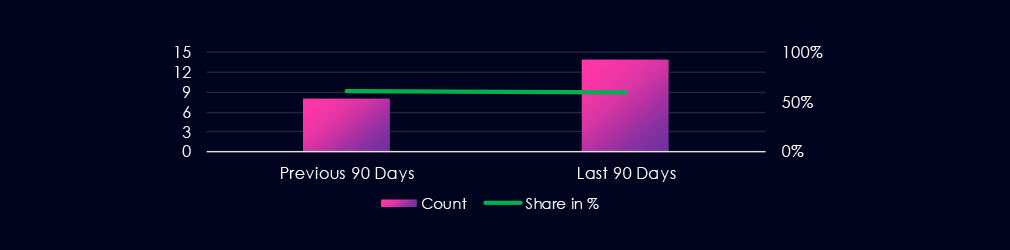

The current period shows a distinct pattern with moderate activity in February, a dip in March, followed by a sharp escalation in April. May 2026 shows 1 campaign recorded at the time of this report.
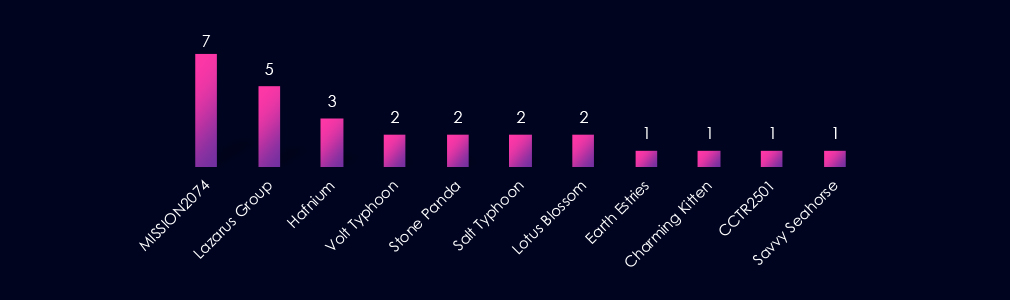
MISSION2074 leads attribution with 7 campaign appearances, up from 4 in the previous period. Its presence spans multi-actor campaigns as well as solo attributions, reinforcing its role as the most operationally active entity in this dataset.
Lazarus Group increased from 2 to 5 campaign appearances, marking a notable escalation and the largest growth among continuing actors.
Hafnium, Volt Typhoon, Stone Panda, Salt Typhoon, and Earth Estries are present in both periods, indicating sustained operational postures toward the finance sector.
Lotus Blossom, Charming Kitten, CCTR2501, and Savvy Seahorse appear for the first time in the current period. These actors represent an expanding set of threats to monitor.
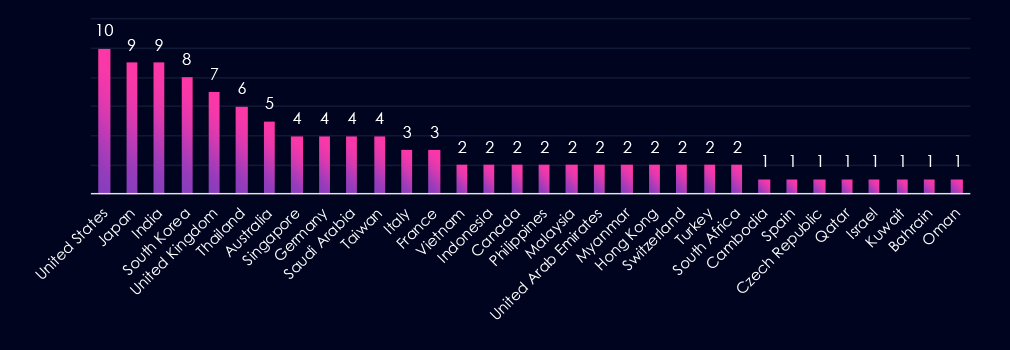
The current period spans 32 unique victim countries, up from 24 in the previous period, reflecting the broader campaign scope of the additional campaigns recorded.
The United States (10), Japan (9), India (9), and South Korea (8) lead victim geography in the current period. All four were top-tier targets in the previous period as well.
The United Kingdom (7) and Australia (5) remain consistently targeted, consistent with their role as major financial hubs in the Western and Pacific orbits.
Saudi Arabia (4) and the United Arab Emirates (2) show continued targeting. Gulf financial institutions and insurance sectors are consistent targets for actors with regional interests.
The current period adds countries, including Myanmar, Hong Kong, Switzerland, Turkey, and South Africa, that were not present in the previous period, reflecting a broader reach by newly active or escalating campaigns.
Thailand (6), Singapore (4), the Philippines (2), Malaysia (2), and Indonesia (2) confirm sustained targeting of Southeast Asian financial infrastructure.
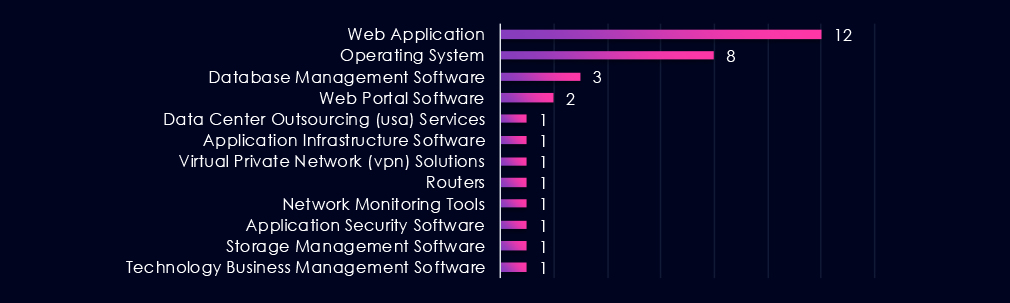
Web Application remains the dominant attack surface, appearing in 12 of 14 campaigns in the current period (up from 8 in the previous period). Operating System-level targeting follows at 8 campaigns, also up from 5 previously. Database Management Software and network infrastructure tools represent a smaller but consistent attack surface, appearing across multi-technique campaigns.

Based on observed trajectory across the two reporting periods, the finance industry external threat landscape is expected to remain at Elevated or higher through the next 90 days. The April escalation, the persistence of dominant threat actors, and the broadening geographic and technology attack surface all support a forward posture of continued high-tempo targeting.
Sustained volume: Campaign volume is unlikely to contract materially in the near term. The April surge and the growing total campaign count indicate an environment of increasing rather than plateauing activity. 14 to 18 finance-sector campaigns over the next 90 days is a plausible baseline estimate.
Dominant actor continuity: The two most active attribution clusters are expected to maintain or increase their operational tempo. Both show trajectory growth from the previous to the current period and are associated with long-running, multi-geography campaigns with no indicators of wind-down.
New actor emergence: Four actors entered the dataset in the current period. A further expansion of the active actor set is probable, given the broader trend of increased total campaign activity across sectors.
Web application threat surface: Web application targeting is expected to remain the primary initial access vector. Finance-sector organisations with unpatched external applications and exposed management interfaces face the highest immediate risk.
Geographic targeting: The Indo-Pacific corridor, North America, and the UK will remain primary target zones. Activity targeting Gulf-region financial institutions and Southeast Asian banking infrastructure is expected to persist.
Multi-actor patterns: The prevalence of campaigns with overlapping actor attributions is expected to continue, complicating attribution and response. Defenders should prioritise TTP-based detection over actor-specific IOC tracking.
Over the past 90 days, DeCYFIR and DeTCT platforms tracked 818 cyber incidents reported publicly. We could identify the industry for 565 of these incidents (69%).
The finance industry was detected in 65 incidents, which equals 7.95% of the incidents where we knew the industry, ranking 3rd out of 14 industries.
The Finance sector faced sustained, high-impact cyber threats across the 90-day window from 10 February to 11 May 2026. A total of 65 attributable incidents were recorded, with losses aggregating well over USD 850 million across crypto platform thefts alone.
The dominant threat actor for the entire period is the North Korean state-sponsored Lazarus Group and its sub-cluster BlueNoroff/UNC1069, responsible for a majority of the largest single-incident losses.
Incident volume peaked in the middle period (25 events, March 10 to April 10), driven by the USD 280 million Drift heist and a surge in phishing and credential-theft campaigns targeting US-based financial institutions.
The most recent 30-day window shows a tactical shift. Volume declined slightly to 18 events, but attack sophistication increased, with Lazarus pivoting to Malicious App delivery, ClickFix lures on macOS, and AI-augmented social engineering via fake Zoom sessions.
Physical payment infrastructure also emerged as a distinct threat vector. ATM jackpotting attacks surged in early 2026, with the FBI reporting over 700 incidents resulting in more than USD 20 million in losses in 2025, with activity continuing into the current reporting period.
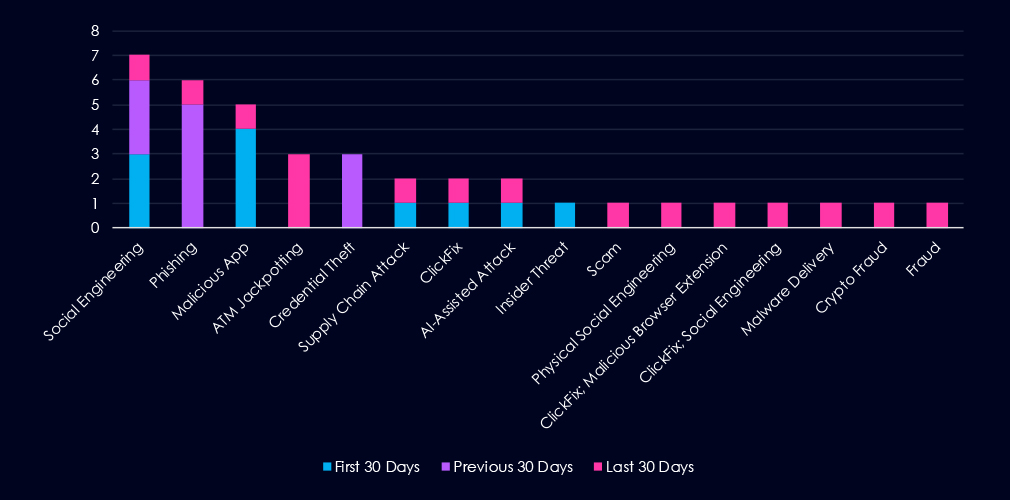
Social Engineering and Phishing collectively account for 13 of 38 technique-attributed incidents, making human manipulation the most prevalent attack category across the period. Mobile malware delivery (Malicious App) is the third most common technique, representing a shift away from desktop-focused delivery.
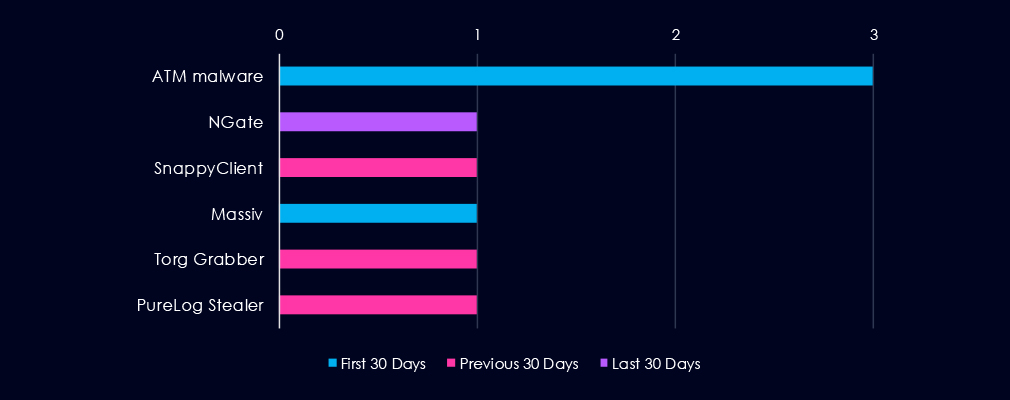
Malware families identified (Finance-specific, 90-day window): ATM malware (3 incidents, US ATM infrastructure), SnappyClient C2 implant (crypto wallet targeting), Massiv Android banking trojan (IPTV app disguise), Torg Grabber infostealer (728 crypto wallets), PureLog Stealer (copyright-lure phishing), NGate Android NFC skimmer (fake payment app). The prevalence of mobile-targeting malware families (Massiv, NGate) in the two most recent periods is a trend requiring monitoring.
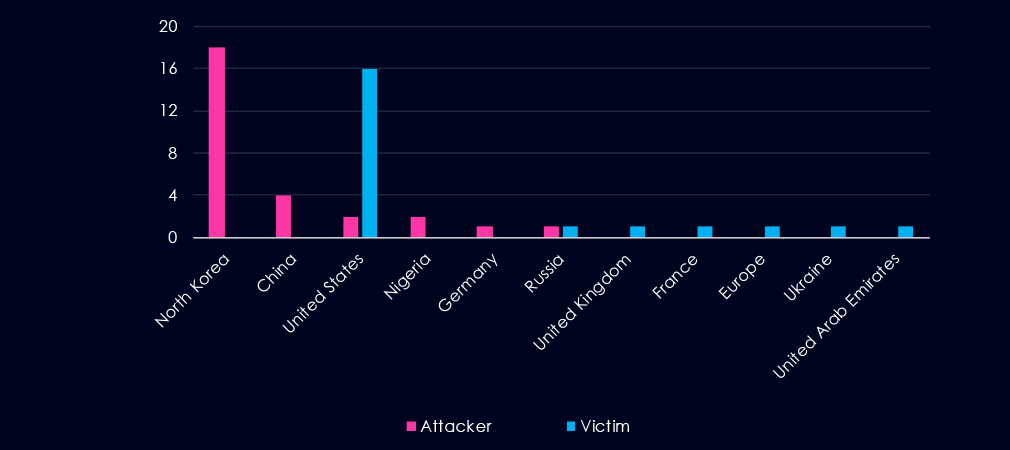
Attacker origin is concentrated in North Korea (18/28, 64%), followed by China (4/28, 14%). The United States (2) represents criminal domestic actors rather than state-sponsored operators. Nigeria (2) and Russia (1) account for the remaining criminal and state-sponsored attributions, respectively.
Victim geography is dominated by the United States (16/22 attributed incidents, 73%). This reflects both the size of the US crypto and financial services sector and its prominence as a target of North Korean crypto-theft operations. European victims include France (data breach), the UK (sanctioned crypto marketplace), Ukraine (central bank contractor breach), and Europe broadly (EU court phishing ruling). Individual victims in the UAE, Philippines, and India indicate a secondary targeting tier across Asia and the Middle East.

The threat level for the finance industry over the next 90 days is assessed as continued high risk.
The following developments are anticipated based on current trends, actor capabilities, and operational patterns:
North Korean Crypto Theft. Lazarus Group tempo will hold or increase. No disruption to infrastructure, BlueNoroff and UNC1069 are actively evolving TTPs. Per-incident theft values are trending up ($280M, $290M in consecutive periods). Expect continued DeFi and crypto exchange targeting, with expanding macOS coverage via ClickFix and fake App Store apps.
Mobile and Payment Fraud. NFC skimming malware (NGate class) is operationally proven and will spread. Android banking trojans (Massiv class) will expand geographically. ATM jackpotting will persist: 700+ US incidents reflect a sustained campaign, not a spike, and physical infrastructure upgrade cycles are too slow to close the gap quickly.
AI-Assisted Social Engineering. AI-generated phishing, vishing, and deepfake video calls are becoming standard across both state-sponsored and criminal actors. Primary targets are employees with access to wire transfers, crypto custody keys, and customer data. The UNC1069 model is likely being replicated across the broader Lazarus structure.
Supply Chain and Regulatory. FINRA’s fusion centre signals increased regulatory scrutiny; expect third-party risk guidance in H2 2026. The Ukraine central bank contractor breach is a concrete reminder that Tier-2 and Tier-3 suppliers carry material risk that perimeter controls do not reach.
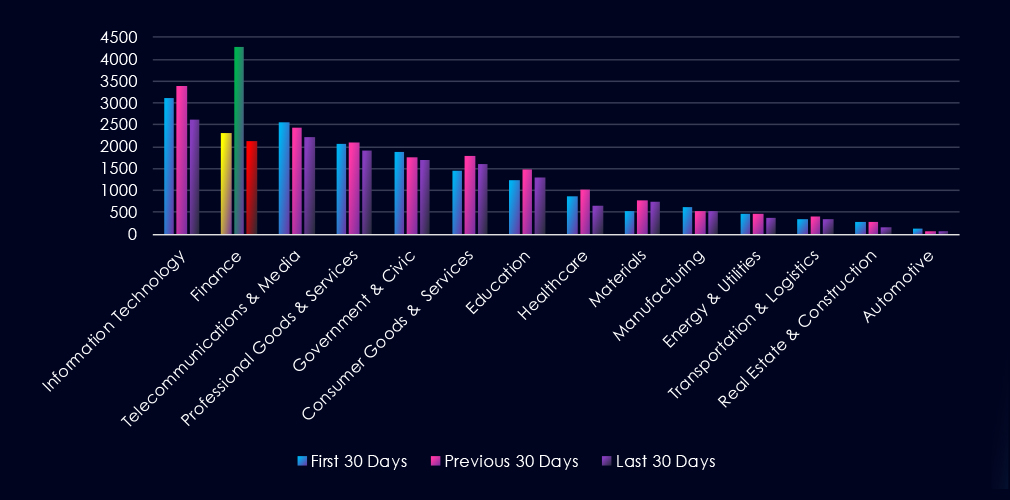
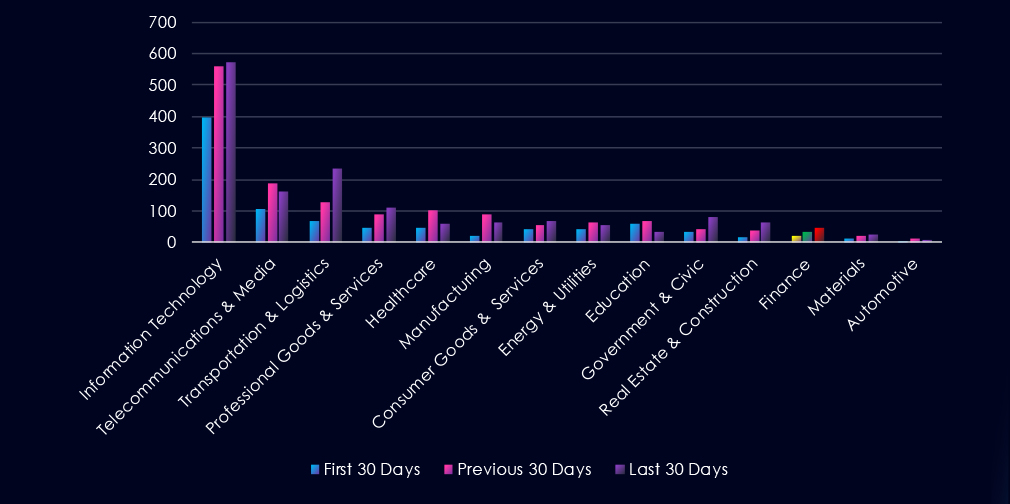
Over the past 90 days, CYFIRMA’s telemetry has identified 8,721 mentions of finance organizations out of a total of 54,903 industry-linked mentions. This is from a total of 300k+ posts across various underground and dark web channels and forums.
Finance organizations placed 2nd out of 14 industries in the last 90 days, with a share of 15.88% of all detected industry-linked chatter.
Below is a breakdown by a 30-day period of all mentions.
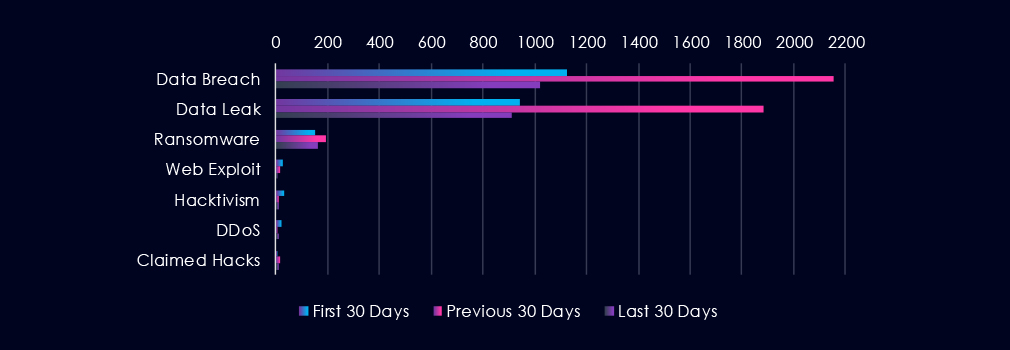
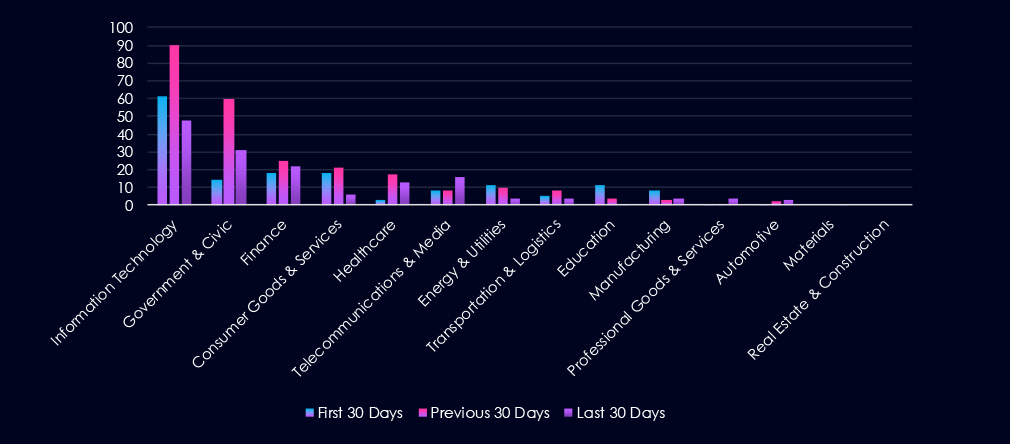
Underground & dark web chatter related to the finance sector over the last 90 days is dominated by data breach and data leak discussions. Both categories show dramatic mid-period elevation followed by a substantial decline in the final period, with data breaches falling from 2,153 to 1,018 and data leaks from 1,882 to 913. Ransomware mentions remain relatively stable across all periods, fluctuating between 152 and 195. Web exploits show a consistent downward trend across all periods. Hacktivism and DDoS activity remain at comparatively lower volumes with variable fluctuation, while claimed hacks show modest increases in the final period.

The 6-month trend shows a repeating oscillation pattern: Feb 2026 peaked at 5,862 mentions, dropped to 2,308 in March, and recovered to 4,279 in April. This back-and-forth pattern suggests activity is tied to campaign cycles, not a steady baseline. The next cycle peak is likely in the July-August window.
Data Breach and Data Leak: Will remain the primary and dominant threat. There is no signal of decline in chatter intent. Expect continued active trading and sharing of financial institution data in underground forums. The most likely sources remain phishing, credential stuffing, and third-party supplier breaches, feeding Finance sector exposure.
Ransomware: Expect continued activity in the 143-207 mention range per month. The December 2025 peak (530 mentions) has not returned in six months, suggesting large-scale coordinated ransomware campaigns against Finance have pulled back. However, targeted attacks on mid-size financial institutions remain probable.
Web Exploit: Declining chatter does not mean zero risk. It more likely means initial access brokers have already established footholds and are operating quietly. Watch for internal lateral movement indicators rather than perimeter alerts.
DDoS and Hacktivism: Not a priority threat for Finance in the near term based on current chatter. Could escalate quickly if a geopolitical trigger event occurs, but no current signal supports that.
Sectors feeding Finance risk: Information Technology (7,213 mentions) is the top chatter sector, and Finance is directly dependent on IT infrastructure. A breach or exploit campaign against IT vendors frequently becomes a Finance sector incident within weeks.
Over the past 90 days, CYFIRMA’s telemetry has identified 100 mentions of finance organizations out of a total of 3,959 industry mentions. This is from over 10k CVEs reported and updated in the last 90 days.
Finance organizations ranked 12th out of 14 industries in the last 90 days, with a share of 2.52% of all detected industry-linked vulnerabilities.
Below is a breakdown by 30-day periods of all mentions.
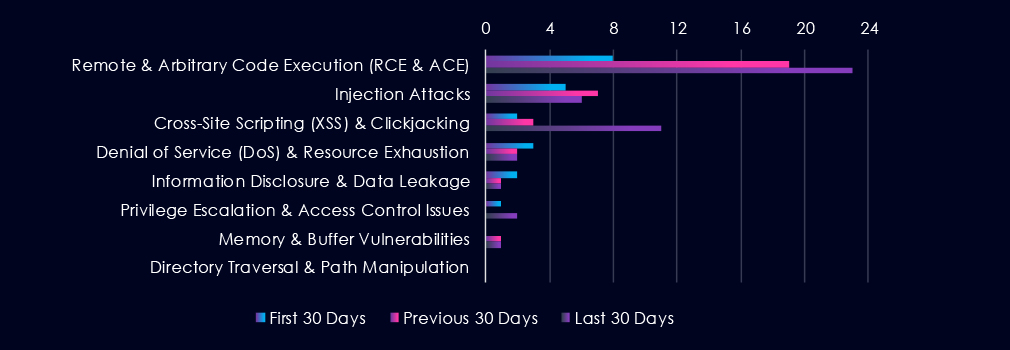
Reported CVEs in the finance sector over the last 90 days show escalating activity in code execution and cross-site scripting vulnerabilities. Remote and arbitrary code execution vulnerabilities increase consistently from 8 to 23 across all periods. Cross-site scripting vulnerabilities show a sharp spike in the final period to 11 mentions. Injection attacks remain stable at low levels. Denial of service, information disclosure, and privilege escalation vulnerabilities show minimal activity with variable fluctuation, while memory vulnerabilities and directory traversal remain at negligible levels.

Sustained volume. CVE volume in the Finance sector is unlikely to contract in the near term. Each of the three sub-periods in the current window recorded more vulnerabilities than the last, and there is no sign of the trend reversing. 150 to 164 Finance CVEs over the next 90 days is a plausible baseline estimate, roughly 50 to 55 per month. This would represent a 50–64% increase over the current period.
RCE dominance. Remote Code Execution vulnerabilities are expected to remain the primary and growing risk category. RCE has increased every month in the dataset without exception, from 8 CVEs in February to 23 in April. On the current trajectory, RCE could account for 80 to 100 of the projected next-period CVEs, meaning the majority of Finance vulnerabilities reported in the forward window will carry direct system compromise potential. Finance organisations with unpatched externally accessible systems and financial application servers face the highest immediate exposure.
Web application surface. The April spike in Cross-Site Scripting vulnerabilities (11 reported, up from 2–3 in prior months) is the most significant unresolved signal entering the forward period. Web application targeting, specifically customer-facing portals and online banking interfaces, is expected to remain an active vulnerability surface. If May XSS volumes stay above 8, the Finance sector web application exposure is broader than the prior trend indicated, and the forward risk indicator should be revised upward. Organisations should treat unpatched customer-facing web applications as the highest-priority remediation target in this period.
Vulnerability composition shift. The proportion of high-severity CVEs within Finance sector disclosures is increasing. In November–January, the Finance CVE mix included a higher share of Injection and DoS vulnerabilities, which carry lower direct exploitation potential. The shift toward RCE as the dominant category over the current period means the average Finance CVE in the forward window is expected to be more dangerous than the average Finance CVE six months ago, even if the total count were to hold flat.
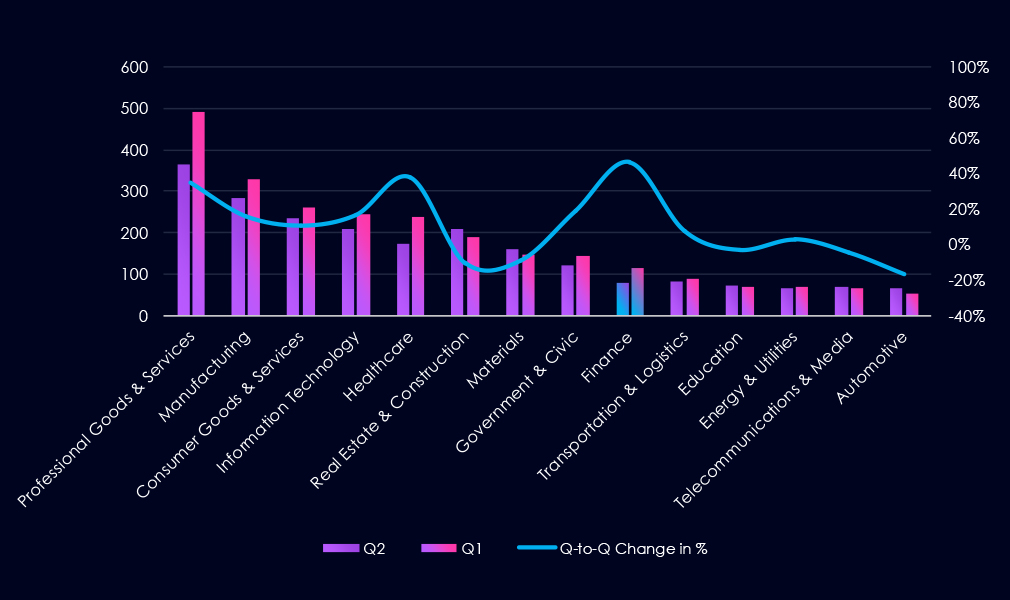
In the past 90 days, CYFIRMA has identified 114 verified ransomware victims in finance organizations. This accounts for 4.38% of all 2,600 ransomware victims during the same period, placing this sector 9th out of 14 industries.
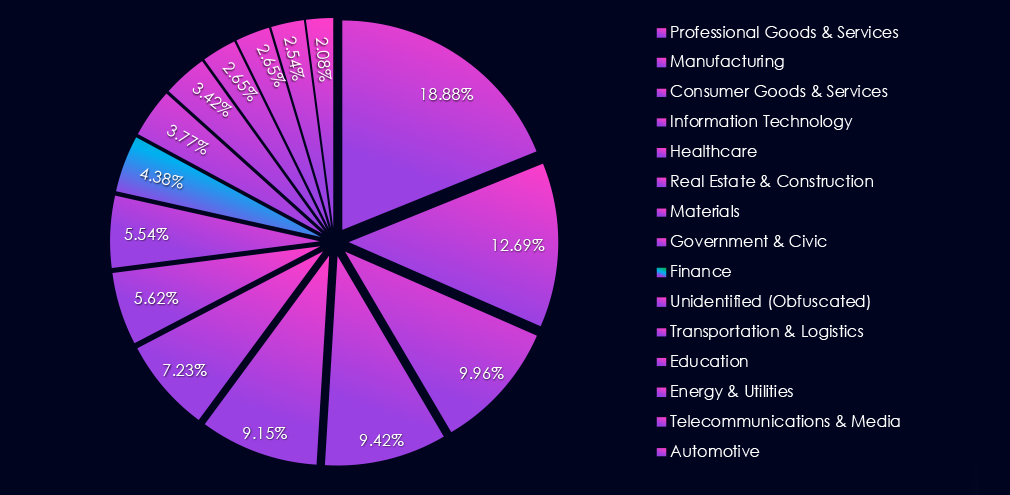
Furthermore, a quarterly comparison shows that the number of victims in finance organizations has significantly increased. It went from 78 to 114 victims, a 46.2% jump. The overall interest, represented by share, also rose from 3.43% to 4.38% of all victims.
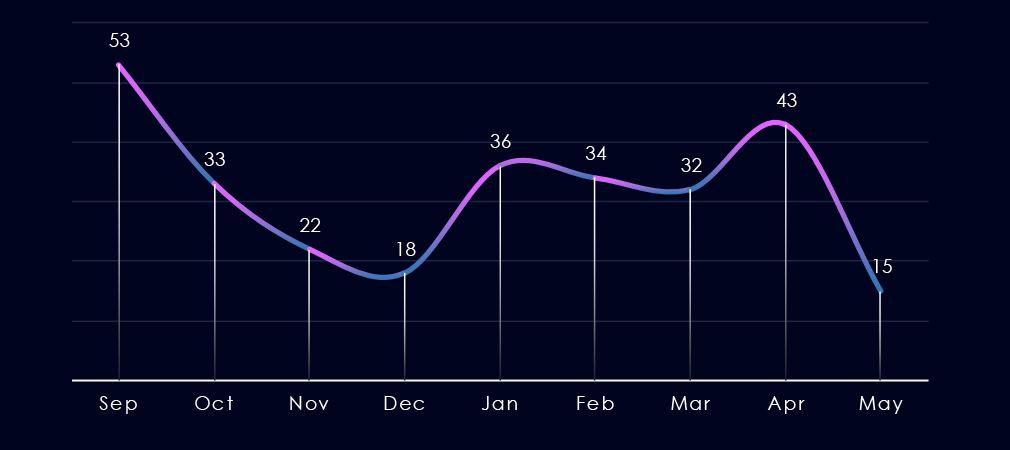
The monthly trendline shows us a major decline since the September high of 53 victims to the December low, with only 18 victims. January jumped to 36 victims, and the victim count stayed flat until a minor spike in April to 43. The start of May is already halfway to the 2026 monthly average.
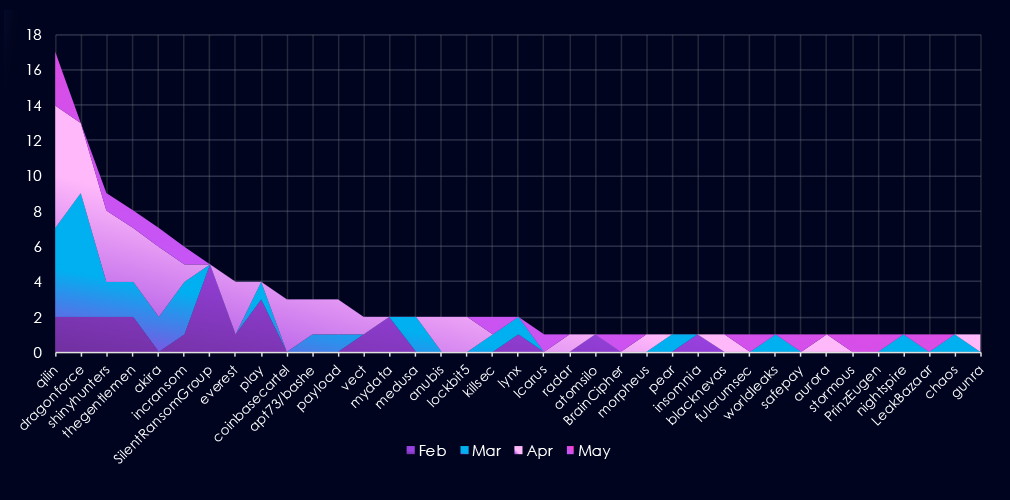
A breakdown of monthly activity per gang reveals which gangs were most active each month. For instance, the leading gang Qilin was highly active during March and April and was already adding victims in May.
On the other hand, SilentRansomGroup has not recorded new victims in this industry since February.
Lastly, gangs like Akira, Everest, Coinbasecartel, and Anubis highly contributed to April’s elevation.
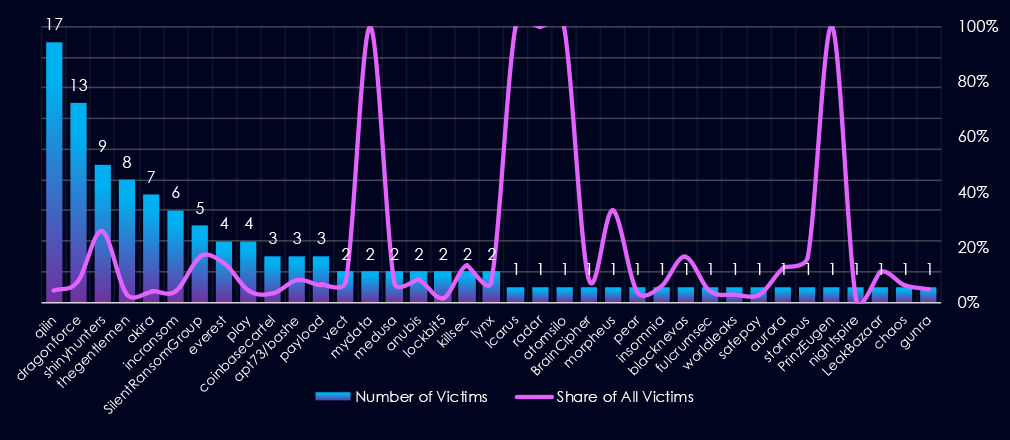
Out of the 83 gangs, 37 recorded victims in finance organizations in the last 90 days, representing a 45% participation.
Qilin had the highest number of victims, but only 4.4% share out of all their 388 victims in this industry.
ShinyHunters stand out as the gang with the highest share (26%) of their victims from this industry. Other gangs with at least 4 victims and a high share are SilentRansomGroup and Everest with 17% and 14% respectively.
Among gangs with more than 3 victims, on average 8.4%, share of their victims are from this industry. That is about 1 in 12 victims.
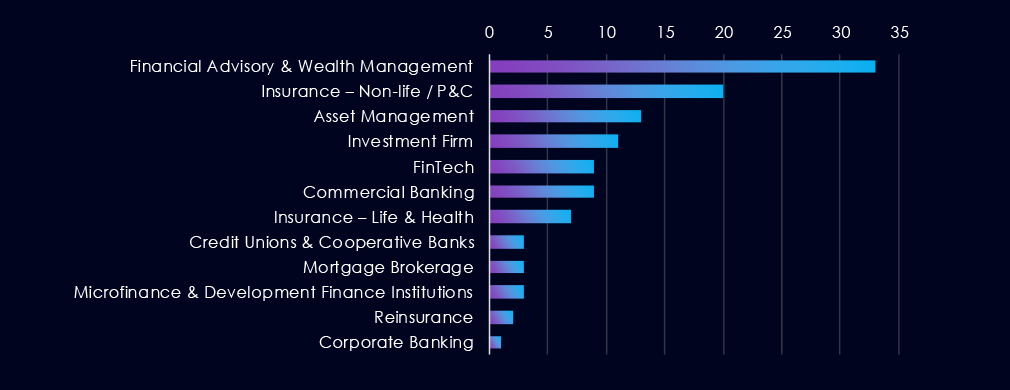
Financial Advisory & Wealth Management recorded the highest victim count, followed by Non-life Insurance and Asset Management. The concentration at the top of the distribution reflects the sensitivity of client financial data and the operational disruption ransomware can cause in time-critical advisory and trading environments.
Activity was more scattered across the remaining subsectors. The presence of FinTech, Credit Unions, and Microfinance institutions among victims point to broadening targeting beyond traditional banking, though counts remain low across these categories.
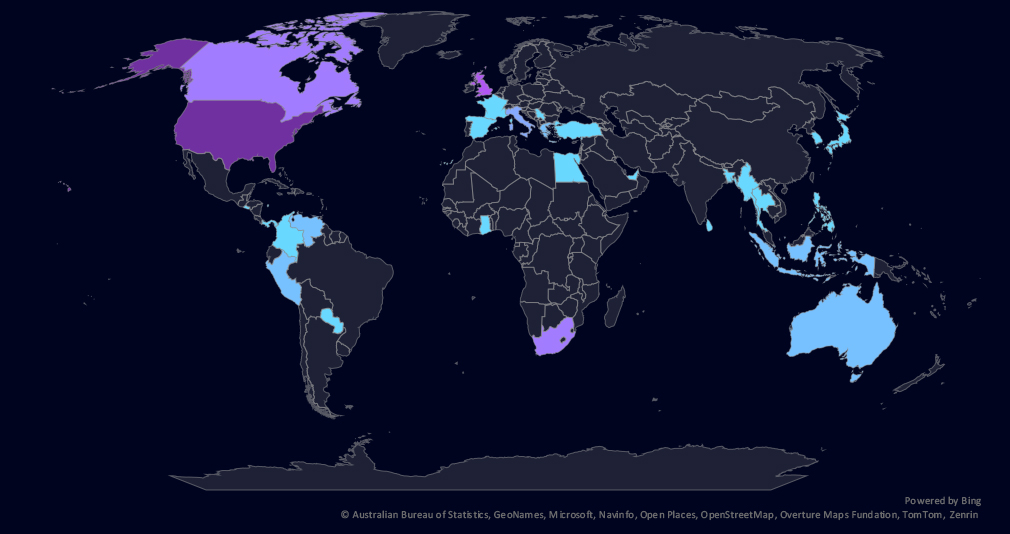
The geographic distribution heatmap underscores the widespread impact of ransomware, highlighting the countries where victims in this industry have been recorded.
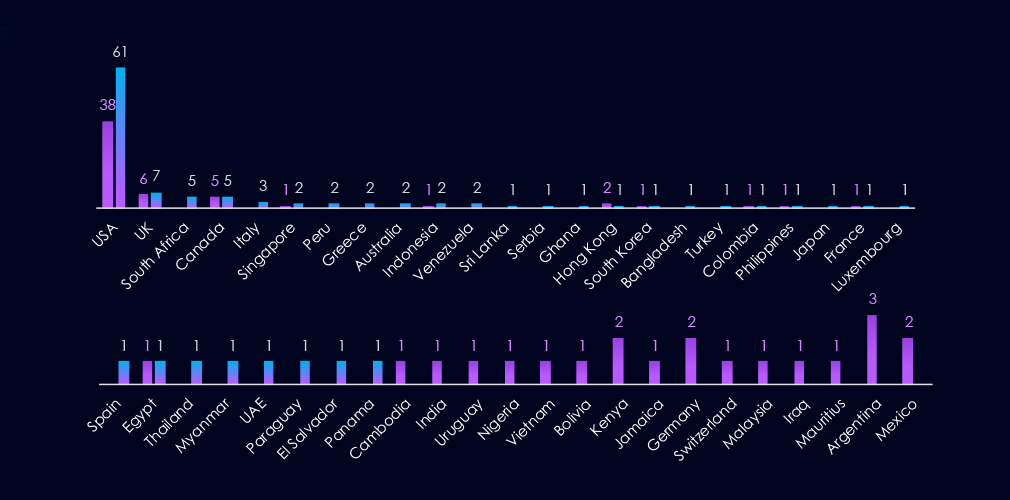
Finance victimology shows the USA as the most frequently targeted country, accounting for 54% of all victims. The USA is also the main driver behind the increase in the number of victims, with 23 more than the previous period.
South Africa, Italy, Peru, Greece, Australia, and Venezuela recorded the highest elevation with 3 finance victims in the last 90 days.
Argentina, Mexico, Kenya, and Germany have seen the largest declines.
In the last 90 days, 31 countries recorded finance industry victims, 5 more than 26 countries in the previous period.

The finance industry ransomware threat landscape is expected to remain at high or elevated levels through the next 90 days. The April escalation, the expanding active threat actor set, and growing geographic spread all support a forward posture of sustained high-tempo targeting with a probable increase in total victim volume.
Sustained volume: April recorded 43 finance victims, a major increase over March, and May is on track to have 40+ victims. A baseline of 130 to 150 finance-sector victims over the next 90 days is the most plausible outcome absent significant disruption. A worse outcome exceeding 160 is credible if current momentum continues.
Dominant actor continuity: Qilin and DragonForce are expected to maintain or increase operational tempo against finance targets. DragonForce recorded a threefold increase in finance victims between periods and shows no indicators of wind-down. Both will account for a disproportionate share of near-term volume.
Specialist exfiltration risk: ShinyHunters presents the highest qualitative risk in the current actor set. One in four of their victims was a finance organisation, signalling deliberate sector targeting. Their method is data theft rather than encryption, creating concentrated exposure for financial advisory and asset management firms. This attack type may generate fewer operational indicators than traditional ransomware.
New actor emergence: Six actors entered the finance dataset in April with no prior sector history. The active gang count expanded from 23 to 39 between periods. Further expansion is probable. The emergence of Coinbasecartel indicates that actors are developing increasingly specific selection criteria within the sector, particularly targeting FinTech and crypto-adjacent organisations.
Sub-sector exposure: Financial advisory and wealth management (28.9%), non-life insurance (17.5%), and asset management (11.4%) represent the highest-risk sub-sectors. These organisations hold concentrated client financial records with significant secondary market value and should expect continued prioritised targeting.
Geographic targeting: The United States will remain the primary target zone, accounting for over half of all finance victims and showing an increasing concentration trend. The United Kingdom and Canada are consistent secondary targets. South Africa and Italy entered the top five in the current period. Activity across Asia-Pacific and Latin America is widening in country coverage and is expected to persist.
APT Campaigns (Elevated): Finance featured in 14 of 23 campaigns (61%), the same share as last period but across a near-doubling of total campaign volume. Activity is exclusively state-sponsored. MISSION2074 leads with 7 appearances; Lazarus Group more than doubled from 2 to 5 campaigns. Four actors entered the finance dataset for the first time. Web application and OS-level targeting dominate, with email, FTP, and SSHD servers as a finance-specific vector targeting institutional communications and research data.
Reported Cyber Incidents (High): 65 incidents, ranked 3rd of 14 industries. Aggregate losses exceed USD 850 million, driven overwhelmingly by North Korean crypto theft via Lazarus Group and BlueNoroff/UNC1069, with per-incident theft values trending up. The final 30 days saw volume dip slightly but sophistication increase: AI-augmented social engineering, ClickFix macOS lures, and malicious app delivery. ATM jackpotting emerged as a parallel physical-infrastructure threat, with 700+ US incidents from 2025 extending into the current period.
Underground & Dark Web Chatter (High): Finance ranked 2nd of 14 industries with 8,721 mentions (15.88%). Data breach and leak discussions dominate, but both declined sharply in the final period. Ransomware chatter is stable. Declining web exploit mentions are more likely signals of established footholds than reduced interest. The six-month oscillation pattern points to campaign-cycle-driven activity, with the next elevated window probable around July-August 2026.
Vulnerabilities (Elevated): 100 CVEs (2.52%), ranked 12th of 14 industries. RCE vulnerabilities escalated every month from 8 CVEs in February to 23 in April. Cross-site scripting spiked in the final period. The compositional shift toward RCE and away from DoS and Injection means the average Finance CVE entering the next period carries higher direct exploitation potential than six months ago. Customer-facing web portals and exposed financial application servers are the highest-priority unpatched exposures.
Ransomware (High): 114 victims, ranked 9th of 14 industries. A 46.2% quarter-on-quarter increase (78 to 114) with both count and sector share rising. Financial Advisory and Wealth Management, Non-Life Insurance, and Asset Management are the most targeted sub-sectors. ShinyHunters presents the highest qualitative risk, directing 26% of their victims at finance and using data-theft over encryption, leaving fewer detection indicators. The active gang count expanded from 23 to 37. The USA accounts for 54% of victims.