
The CYFIRMA Industries Report delivers original cybersecurity insights and telemetry-driven statistics of global industries, covering one sector each week for a quarter. This report focuses on the telecommunications & media industry, presenting key trends and statistics in an engaging infographic format.
Welcome to the CYFIRMA infographic industry report, where we delve into the external threat landscape of the telecommunications & media industry over the past three months. This report provides valuable insights and data- driven statistics, delivering a concise analysis of attack campaigns, phishing telemetry, and ransomware incidents targeting the telecommunications & media organizations.
We aim to present an industry-specific overview in a convenient, engaging, and informative format. Leveraging our cutting-edge platform telemetry and the expertise of our analysts, we bring you actionable intelligence to stay ahead in the cybersecurity landscape.
CYFIRMA provides cyber threat intelligence and external threat landscape management platforms, DeCYFIR and DeTCT, which utilize artificial intelligence and machine learning to ingest and process relevant data, complemented by manual CTI research.
For the purpose of these reports, we leverage the following data from our platform. These are data processed by AI and ML automation based on both human research input and automated ingestions.
VULNERABILITIES
RANSOMWARE
While this report contains statistics and graphs generated primarily by automation, it undergoes thorough review and enhancement for additional context by CYFIRMA CTI analysts to ensure the highest quality and provide valuable insights.
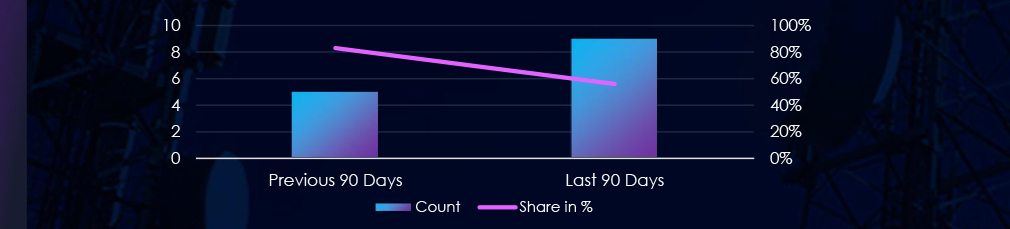
Telecommunications & media industry over past 90 days featured in 9 out of the 16 observed campaigns, which is a presence in 56% of all campaigns. That is increase from 5 in previous 90 days, however a decline in overall share from 83% (5 out of 6).

May has seen most of the campaigns, followed by mild decline in Jun and another bump during July.
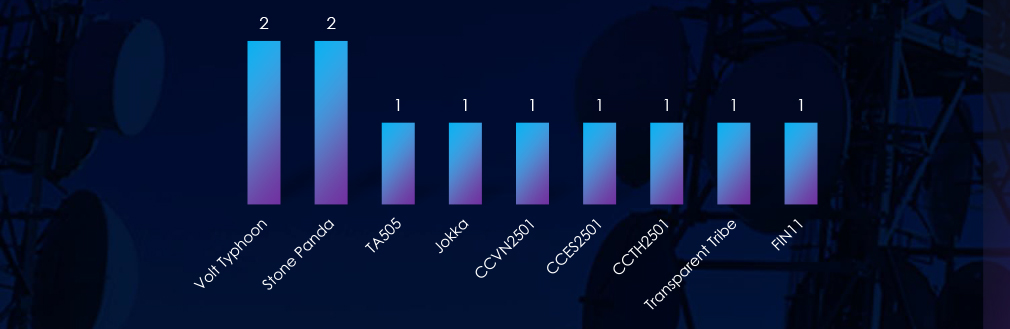
Active threat actors come from all corners of the world. Chinese Volt Typhoon and Stone Panda, Russian TA505 and FIN11, Portuguese Jokka, VN, ES and TH Cybercriminals or Pakistani Transparent Tribe.
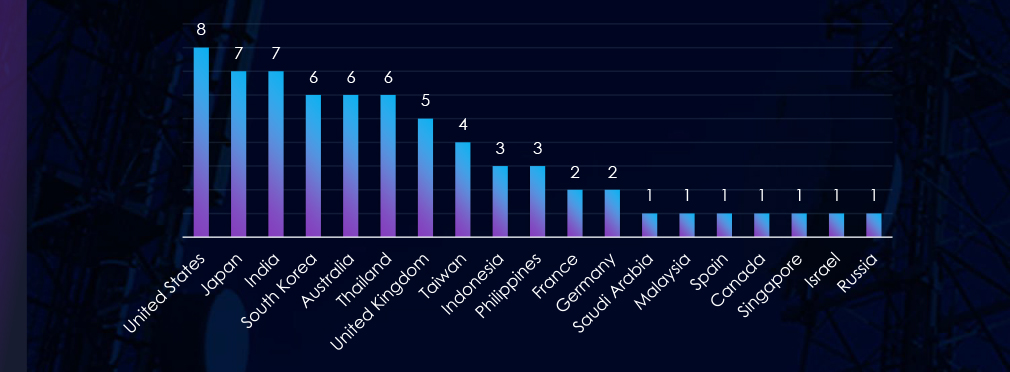
The US is leading the chart with presence in 9 out 9 observed campaigns. At shared second place Japan with India. South Korea, Australia and Thailand share third place.
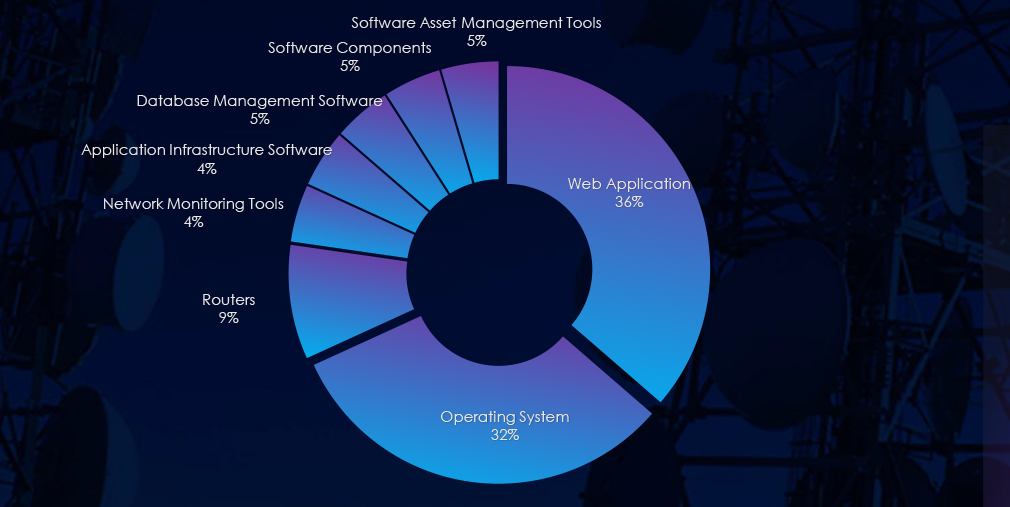
8 out of 9 campaigns used Web Application as primary attack vector. 7 exploited operating system vulnerabilities. Additionally various network, management and infrastructure software was observed.

Over the past 90 days, the telecommunications & media industry has been significantly affected by advanced persistent threat (APT) campaigns.
Out of the 16 observed APT campaigns, 9 targeted this industry, representing 56% of the observed campaigns. This is an increase from the previous 90-day period, during which 5 out of 6 campaigns targeted this industry.
Monthly Trends
Key Threat Actors
Active threat actors originate from various regions worldwide. Examples include Chinese Volt Typhoon and Stone Panda, Russian TA505 and FIN11, Portuguese Jokka, Vietnamese, Spanish, and Thai cybercriminals, and Pakistani Transparent Tribe.
Geographical Impact
overall 19 countries recorded victims in observed campaigns. The United States leads the chart with its presence in nine out of nine observed campaigns. Japan and India share second place, while South Korea, Australia, and Thailand share third place.
Targeted Technologies
Eight out of nine campaigns employed Web Applications as their primary attack vectors. Seven of these campaigns exploited operating system vulnerabilities. Furthermore, various network, management, and infrastructure software was observed.
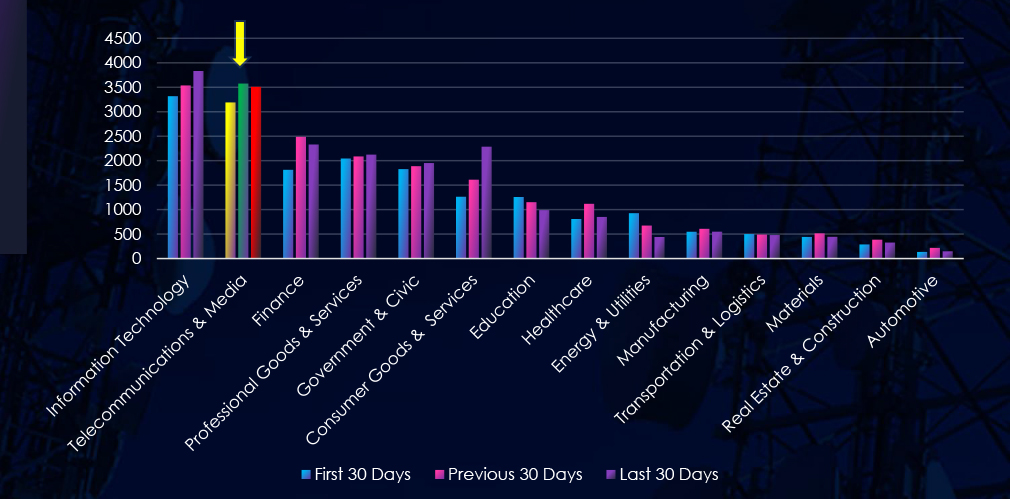
Over the past three months, CYFIRMA’s telemetry has identified 10,271 mentions of telecommunications & media industry out of a total of 58,932 industry mentions. This is from total of 300k+ posts across various underground and dark web channels and forums.
Telecommunications & media industry placed 2nd out of 14 industries in last 90 days with share of 17.4% of all detected industry-linked chatter.
Below is a breakdown by 30 days periods of all mentions.
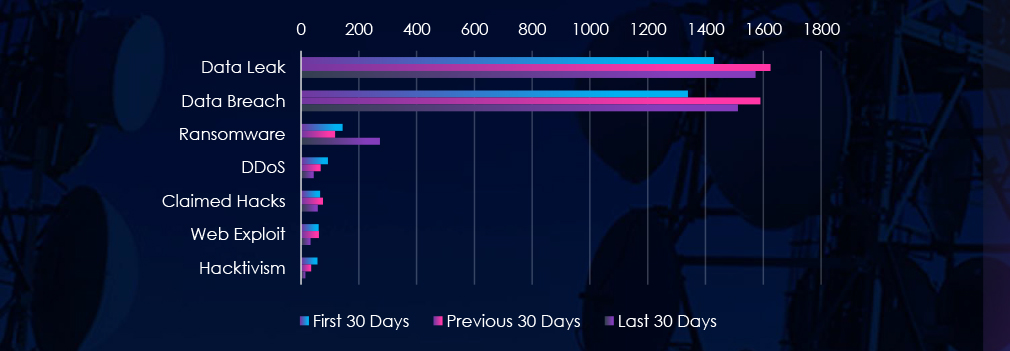
Data Leaks and Data Breaches are by far the most common category of recorded chatter for this industry showing high sustained interest. Ransomware chatter has been surged in last 30 day.

In total, telecommunications & media industry comprise 17.4% of all detected industry underground and dark web chatter in the last 90 days. And ranking 2nd out of 14 industries.
Below are observed key trends across 90 days:
Data Breach & Leak: High and Sustained
Data Breach: 1339 → 1590 → 1512
Data Leak: 1429 → 1625 → 1573
Although slightly down in the latest period, both remain elevated, indicating persistent targeting and compromise of sensitive data, including subscriber, infrastructure, and communication records.
Ransomware Surged in Latest Period
144 → 118 → 273 (↑85% from previous) Ransomware chatter nearly doubled, suggesting renewed attacker focus on high-value telecom and media infrastructure, likely due to the potential for service disruption or high ransom payouts.
DDoS Activity Continues to Decline
93 → 68 → 44, Reflects a shift away from volumetric disruptions, most likely linked to decline in hacktivism activity in same period.
Claimed Hacks Decreasing
66 → 76 → 58, Slight decline indicates fewer publicly flaunted intrusions, but still suggests a steady stream of breaches, many potentially monetized or leveraged privately.
Web Exploit Chatter Shrinking
61 → 62 → 33, A sharp drop in the most recent period (↓47%) could reflect better web security or attackers pivoting.
Hacktivism Fading
57 → 35 → 15, Indicates declining ideological motivation to target this industry—possibly due to geopolitical shifts or changing activist focus.
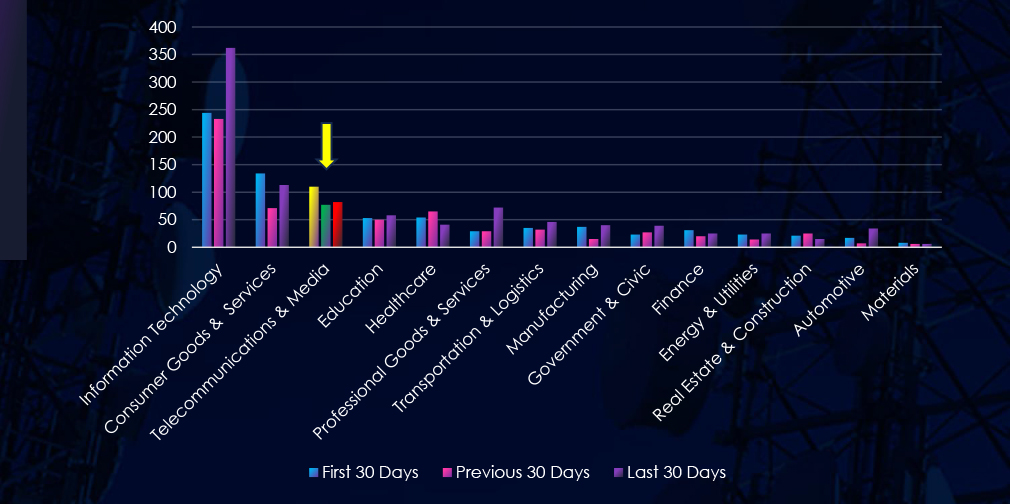
Over the past three months, CYFIRMA’s telemetry has identified 269 mentions of telecommunications & media industry out of a total of 2,448 industry mentions. This is from over 10k CVEs reported and updated in last 90 days.
Telecommunications & media industry ranked 3rd out of 14 industries in last 90 days with share of 10.99% of all detected industry linked vulnerabilities.
Below is a breakdown by 30 days periods of all mentions.
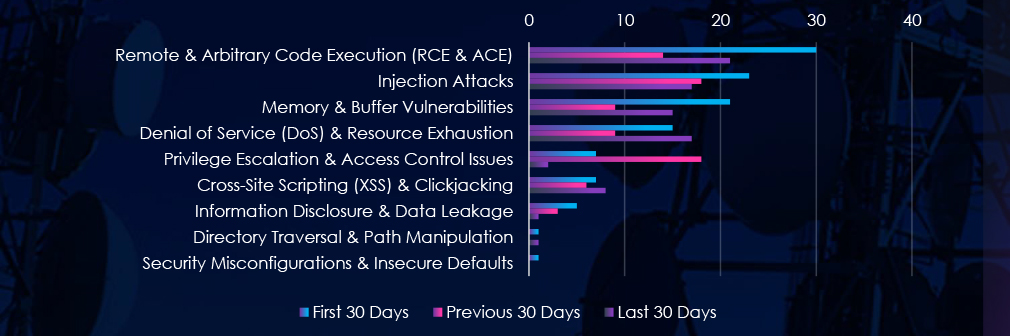
Remote & Arbitrary Code Execution (RCE & ACE), Injection Attack and Buffer vulnerabilities are leading the chart, as they recorded spike during first 30 days. Privilege Escalation & Access Control Issues have recorded significant increase in previous 30 days.

In total, telecommunications & media industry comprise of 10.99% of all detected industry-linked vulnerabilities in the last 90 days. And ranking 3rd out of 14 industries.
Below are observed key trends across 90 days.
Remote & Arbitrary Code Execution (RCE & ACE)
30 → 14 → 21, Still the most dangerous vulnerability class, with a recent resurgence.
Injection Attacks
23 → 18 → 17, Slight decline, but still high. Suggests consistent targeting of databases, APIs, and web services.
Memory & Buffer Vulnerabilities
21 → 9 → 15, Fluctuating but rising again. These are often tied to firmware or embedded telecom systems, and can lead to RCE or DoS.
Denial of Service (DoS) & Resource Exhaustion
15 → 9 → 17, Rebounding sharply in the last 30 days. Mirrors increasing dark web chatter around DDoS disruptions. Highly relevant for uptime- sensitive providers.
Privilege Escalation & Access Control
7 → 18 → 2, After a major spike, there’s now a sudden drop. Could reflect temporary exploitation of known privilege flaws that have since been patched.
Cross-Site Scripting (XSS) & Clickjacking
7 → 6 → 8, Low but steady – typically tied to web interfaces, client portals, or streaming services.
Information Disclosure & Data Leakage
5 → 3 → 1, Minimal in recent reports, but with dark web chatter on data breaches staying high, this might indicate underreported or non- public vulnerabilities.
Directory Traversal & Misconfigurations
Very low. Just 1 mention each in First and Last 30 Days; zero otherwise. Still relevant in legacy or misconfigured environments.
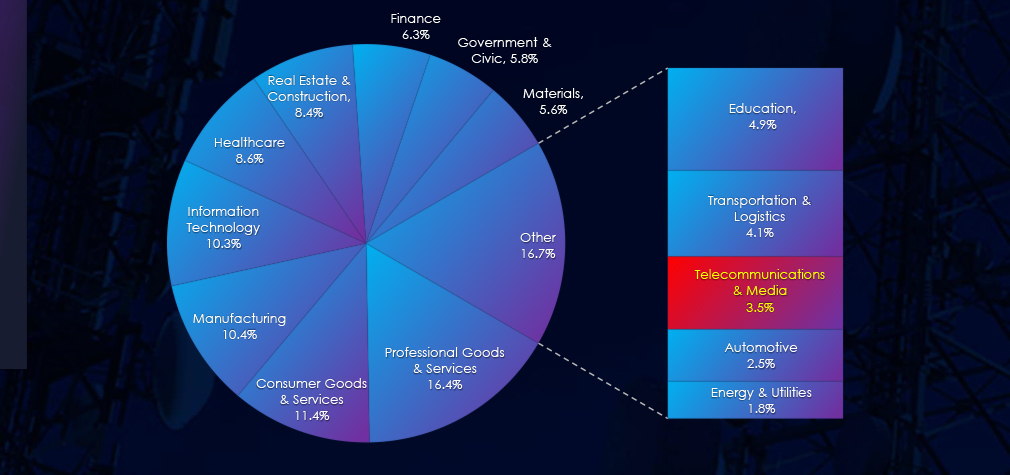
In the past 90 days, CYFIRMA has identified 49 verified ransomware victims in telecommunications & media industry. This accounts for 3.5% of the overall total of 1,1450 ransomware victims during the same period. Placing telecommunications & media industry 12th out of 14 industries.
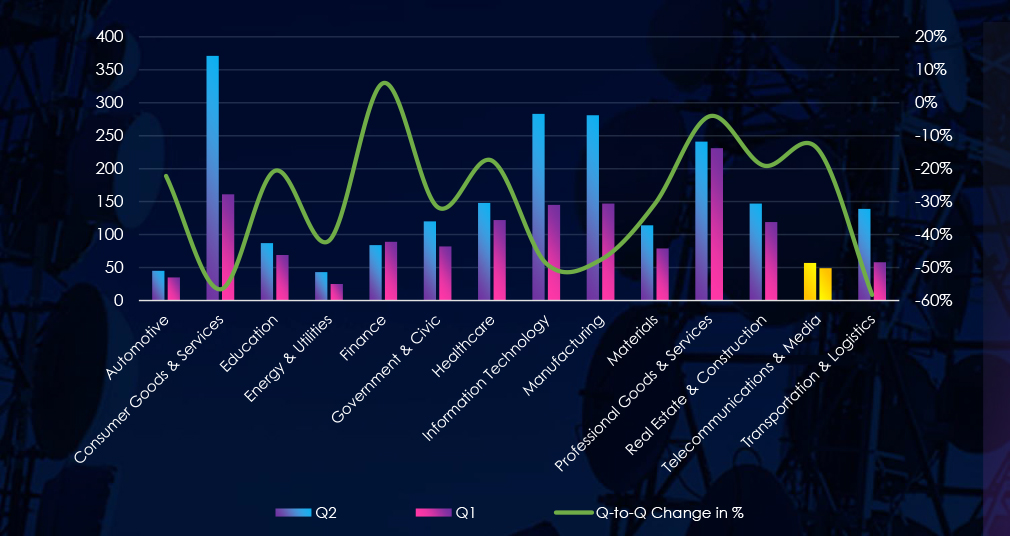
Furthermore, a quarterly comparison reveals a mild drop in victims in the telecommunications & media industry, with a reduction of -14% from 57 to 49 victims. However, the overall share of victims increased from 2.59% to 3.38% of all victims.
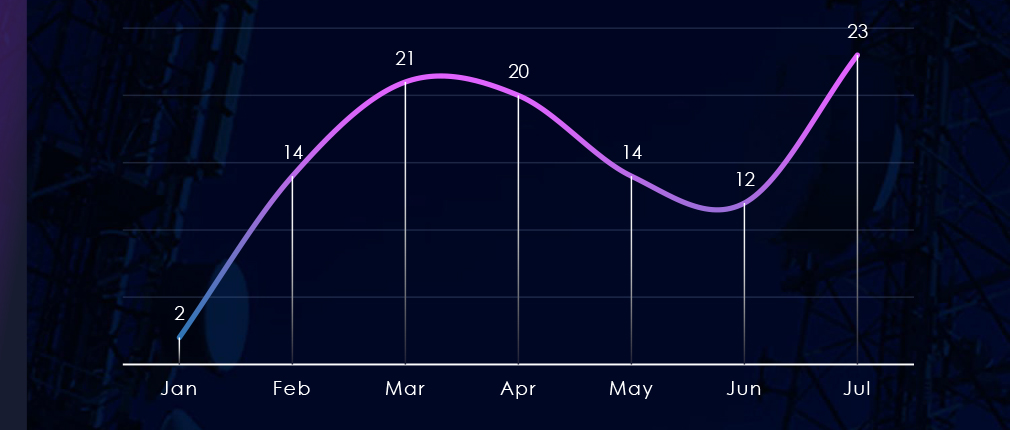
Over the past 180 days, numbers of victims are mixed. Ignoring just few days of January we can see low February, followed by top in May, then drop towards May and June and new spike in July.
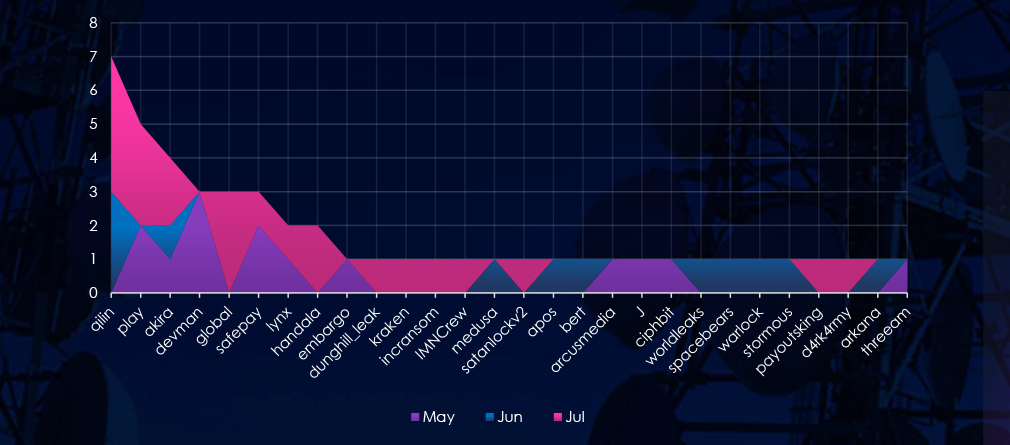
A breakdown of monthly activity per gang provides insights into which gangs were active each month. For example, by far the most active gang Qilin was active in June and July. On the other hand, fourth most active gang Devman recorded all victims in May.
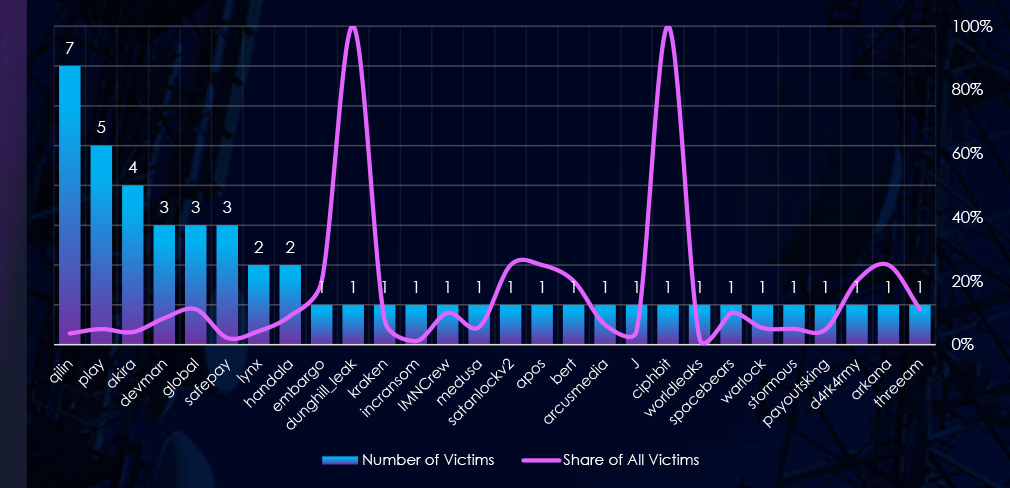
Out of the 72 gangs, 28 recorded victims in this industry in the last 90 days (39% participation). Qilin had the highest number of victims (7) but low share (3.5%).
The share of victims for most gangs in this industry is low. From the top 10, only one gang with more than 1 victim recorded a share above 10% – Global (11.1%).
Devman (8.3%), Embargo (20%), and IMNCrew (10%) had the highest share of victims; implying some focus on this industry.
Spike of 100% shares are by gangs with 1 victim overall.
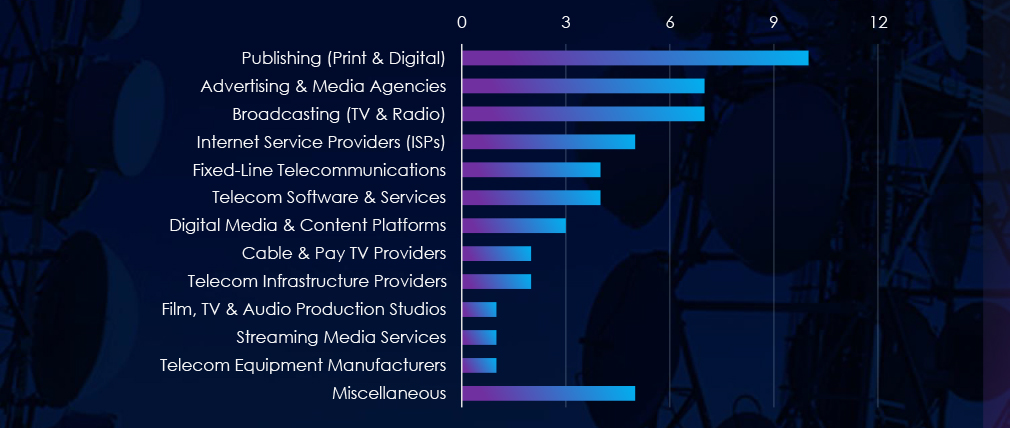
Publishing, Advertising and Broadcasting are the most frequent victims of ransomware in this industry.
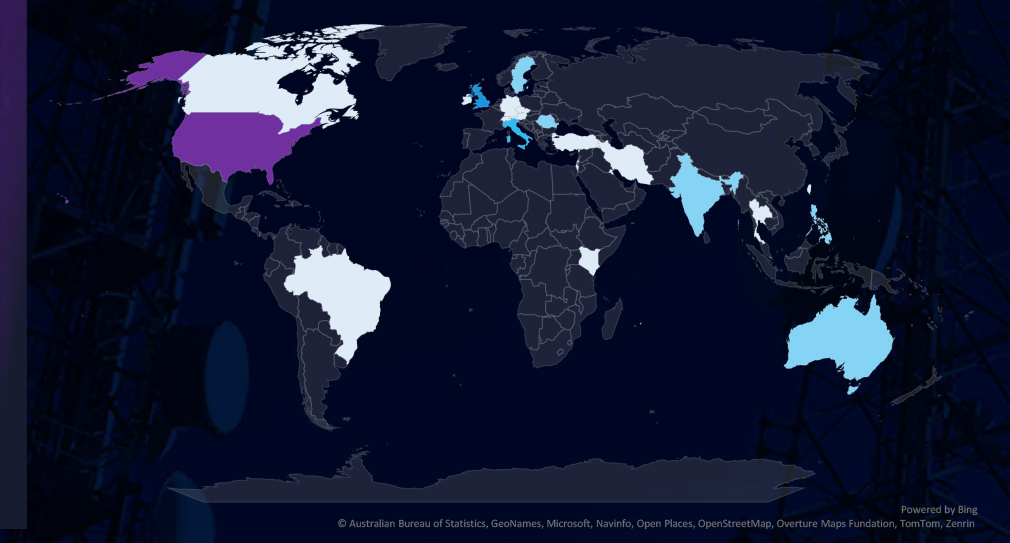
The geographic distribution heatmap underscores the widespread impact of ransomware, highlighting the countries where victims in this industry have been recorded in last 90 days.
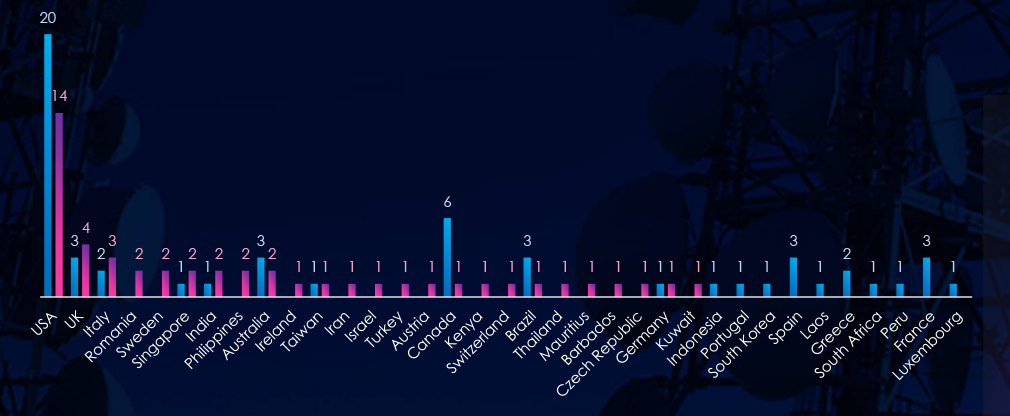
Chart shows quarter-to-quarter changes in targeted countries. Data is sorted by the last 90 days and compared to the previous 90 days, marked in blue.
In the last 90 days, the USA recorded 14 victims (29% of all victims). The UK and Italy follow in second and third place. Canada, Spain and France recorded significant drops from previous 90 days period.

Telecommunications & media industry placed 12th out of 14 monitored industries recording 49 victims in last 90 days. Minor decrease of -14% from 57 victims in previous 90 days period.
Overall share however increased slightly from 2.59% to 3.38% of all ransomware victims.
Monthly Activity Trends
Monthly activity trends show fluctuations over the past 180 days. Excluding a few days in January, February saw a low number of victims, followed by a peak in May. The number then dropped towards May and June, only to spike again in July.
Ransomware Gangs
A total of 28 out of 72 active ransomware groups targeted the this industry in the past 90 days representing 39% participation:
Qilin: The most active with 7 victims and 3.5% (7 out of 199) of all their victims.
Play: Second most active with 5 victims and 4.9% (5 out of 102) share.
Global: Highest shares of 11% (3 out of 27) victims among top gangs.
Geographic Distribution
The geographic distribution of ransomware victims is relatively high yet quite concentrated in the USA which accounts for 29% of all victims.
Notably previously heavily hit countries like Canada, Spain, Brazil or France recorded significant decline in victims.
In total, 25 countries recorded ransomware victims in this industry in last 90 days, five more than 20 in previous period.
For a comprehensive, up-to-date global ransomware tracking report, please refer to our new monthly “Tracking Ransomware” series here.
APT Campaigns (High): In the past 90 days, 9 of 16 observed APT campaigns (56%) targeted the telecommunications & media industry—an increase from 5 of 6 campaigns in the previous period. May saw the most activity, with a slight dip in June and renewed activity in July. Threat actors included Chinese (Volt Typhoon, Stone Panda), Russian (TA505, FIN11), Pakistani, Vietnamese, Thai, Spanish, and Portuguese groups. The U.S. was a victim in every campaign; Japan, India, South Korea, Australia, and Thailand were also frequently hit. Web applications were the primary vector (8 of 9 campaigns), often alongside operating systems, network infrastructure, and management tools.
Underground & Dark Web Chatter (High): Telecoms & media accounted for 17.4% of all industry chatter, ranking 2nd. Data breach and leak chatter remained high (1512 and 1573, respectively), reflecting sustained data compromise. Ransomware-related chatter nearly doubled (↑85%) in the latest period, while DDoS (↓53%), web exploits, and hacktivism trended downward. Claimed hacks dipped slightly, indicating more covert or monetized breaches.
Vulnerabilities (High): This sector made up 10.99% of all reported CVEs, ranking 3rd. RCE vulnerabilities surged again (21), while DoS vulnerabilities rebounded (↑89%)—highlighting service disruption risks. Injection flaws (17) and memory issues (15) remained elevated. Privilege escalation dropped sharply after a spike, possibly due to patching. XSS remained steady (8), while disclosure, misconfig, and traversal issues were minimal but persistent.
Ransomware (Low): 49 ransomware victims were recorded (↓14%), placing telecoms & media 12th overall. However, the sector’s share of all ransomware rose slightly from 2.59% to 3.38%. July saw a renewed spike after a quieter May–June. Qilin (7 victims) and Play (5) led activity, with Global gang showing the highest group-specific focus (11%). The U.S. accounted for 29% of victims, and the total geographic spread increased to 25 countries, up from 20 previously.