
The CYFIRMA Industry Report delivers original cybersecurity insights and telemetry-driven statistics of global industries, covering one sector each week for a quarter. This report focuses on the telecommunications & media industry, presenting key trends and statistics in an engaging infographic format.
Welcome to the CYFIRMA infographic industry report, where we delve into the external threat landscape of the telecommunications & media industry over the past three months. This report provides valuable insights and data-driven statistics, delivering a concise analysis of attack campaigns, phishing telemetry, and ransomware incidents targeting the telecommunications & media industry.
We aim to present an industry-specific overview in a convenient, engaging, and informative format. Leveraging our cutting-edge platform telemetry and the expertise of our analysts, we bring you actionable intelligence to stay ahead in the cybersecurity landscape.
CYFIRMA provides cyber threat intelligence and external threat landscape management platforms, DeCYFIR and DeTCT, which utilize artificial intelligence and machine learning to ingest and process relevant data, complemented by manual CTI research.
For the purpose of these reports, we leverage the following data from our platform. These are data processed by AI and ML automation based on both human research input and automated ingestions.
While this report contains statistics and graphs generated primarily by automation, it undergoes thorough review and enhancement for additional context by CYFIRMA CTI analysts to ensure the highest quality and provide valuable insights.
Telecommunications & Media organizations featured in 7 out of the 13 observed campaigns, which is a presence in 54% of all campaigns.

The number of observed APT campaigns targeting this industry peaked in September and has shown a steady decline over the past 90 days.
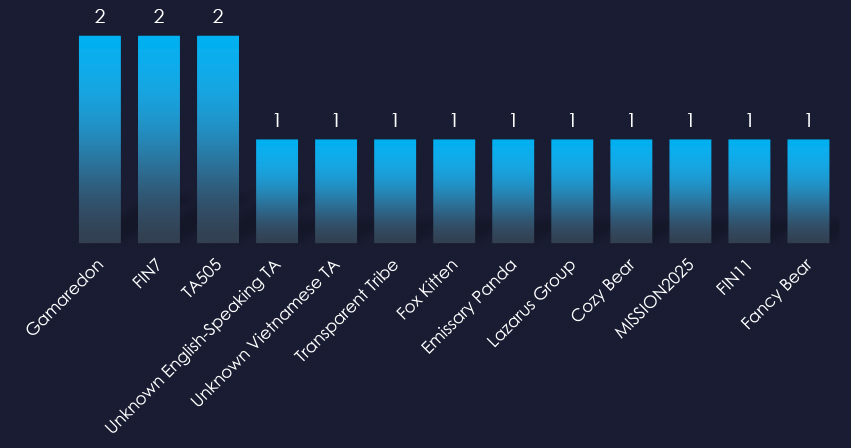
Observed threat actors originate from across the globe, including familiar names like Russia’s Bears, China’s Pandas, and North Korea’s Lazarus Group, as well as Pakistan’s Transparent Tribe, Iran’s Fox Kitten, and unattributed Vietnamese and English-speaking groups.
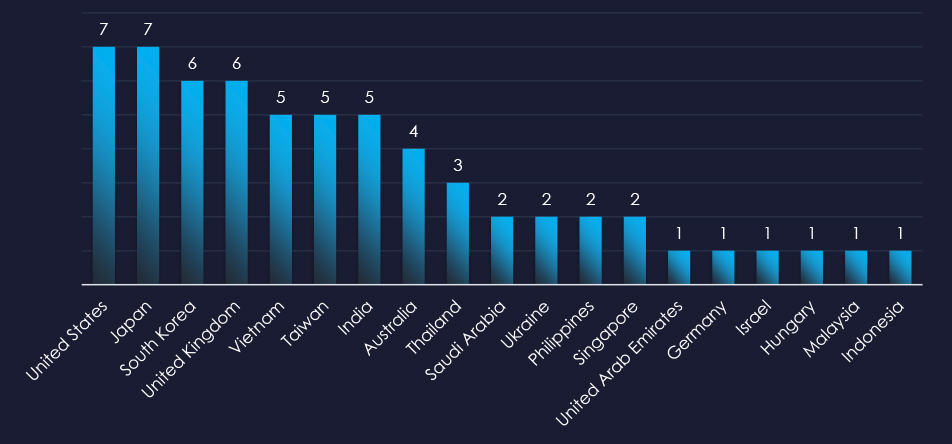
The recorded victims of observed attack campaigns span 19 countries, aligning with the known rival nations of the identified nation-state threat actors.
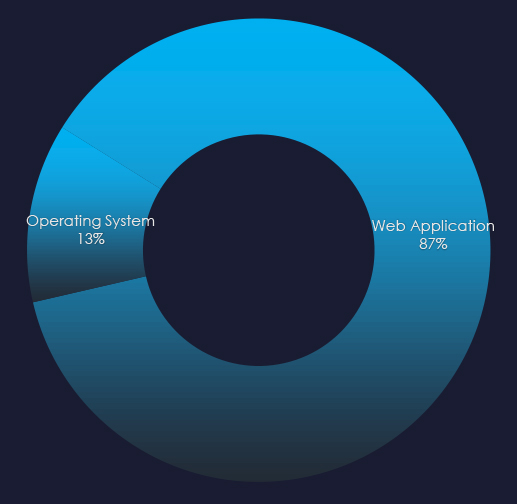
Most campaigns utilized Web Application attacks as a primary attack vector. One campaign utilized operating systems exploitation.

Risk Level Indicator: High
In the past 90 days, Telecommunications & Media organizations have been significantly impacted by advanced persistent threat (APT) campaigns. All 54% of observed APT campaigns recorde Telecommunications & Media Industry victims, with 7 out of 13 total campaigns.
Monthly Trends
Activity peaked in September and gradually slowed down until November.
Key Threat Actors
The telecommunications and media industry, being a critical part of national infrastructure and a staging ground for cyber operations and espionage, attracts a wide range of nation-state threat actors from China, Russia, Pakistan, Iran, Vietnam, and North Korea.
Geographical Impact
The campaigns affected a total of 19 countries, seemingly dispersed across continents but aligning with the rival nations of the active threat actors observed.
Targeted Technologies
Web applications remain the most frequently targeted technology with operating systems being exploited in one of the campaigns.
Over the past 3 months, CYFIRMA’s telemetry detected 29 phishing campaigns themed around the Telecommunications & Media Industry out of a total of 190,725.
The chart below illustrates the global distribution of observed themes. Observed combined telecommunications and gaming-related phishing accounts for 7.53%% of all captured phishing attempts, placing telecommunications as the 4th most frequent phishing theme.
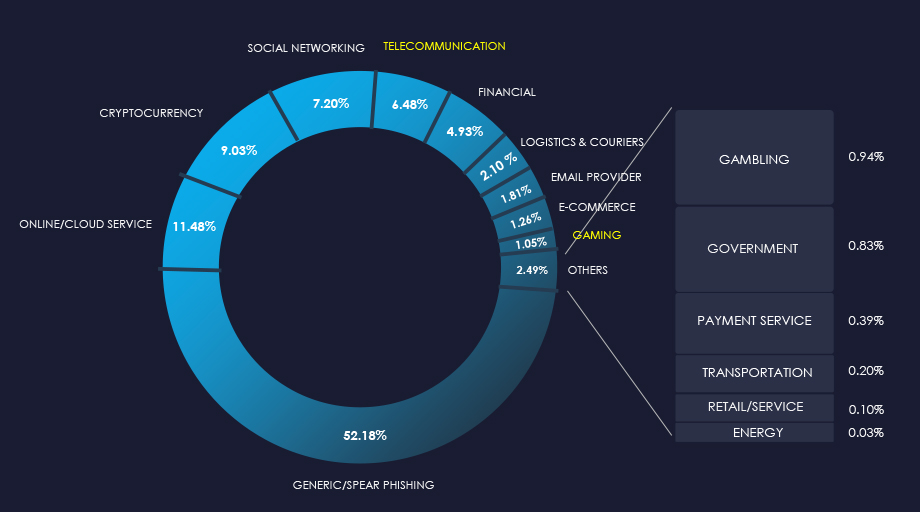
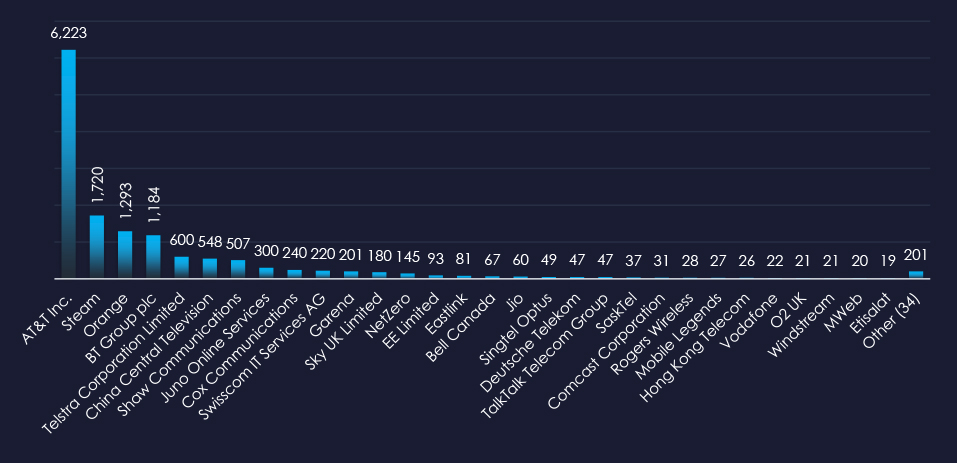
AT&T, Orange, and BT Group are the most frequently impersonated telecommunications organizations, while Steam and Garena gaming platforms lead among media organizations.
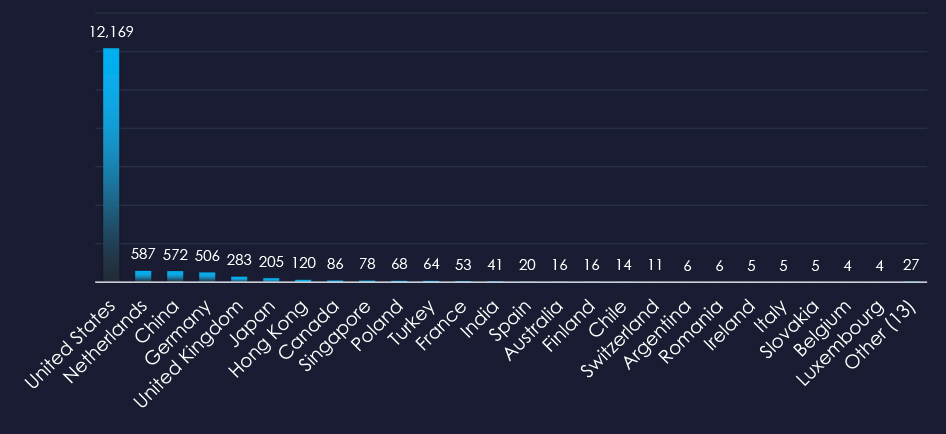
The United States is by far the largest source of observed phishing, followed by the Netherlands, China, and Germany in distant second to fourth places.

Risk Level Indicator: Moderate
The Telecommunications & Media sector remains a popular phishing theme due to the direct monetization and valuable account overtake avenues for threat actors. Its share mildly increased from 6.25% to 7.53%.
The US-based AT&T stands out as the most impersonated brand, indicating large U.S. phishing campaigns in the last 90 days. In second place is the gaming platform Steam which is an increasingly more popular phishing theme.
Overall, the list includes 65 organizations from 38 countries, such as the O2 UK, Telstra (AU), and Singtel (Singapore), underscoring the worldwide nature of these threats.
ASN-origin data reveals that the United States is the leading source of phishing emails impersonating telco & media organizations, reflecting the extensive telecommunications & media sector in the U.S. and the vast number of compromised devices used in botnets to send phishing emails. Significant activity is also observed in the Netherlands, China, and Germany for similar reasons.
Furthermore, Hong Kong and Singapore are often used by Chinese cyber criminals as a proxy. Europe and Latin America are among the most frequent sources of telco-themed phishing.
The presence in both developed and developing nations highlights that phishing campaigns are opportunistic and globally pervasive.
In the past 90 days, CYFIRMA has identified 44 verified ransomware victims in the telecommunications & media industry. This accounts for 2.8% of the overall total of 1,580 ransomware victims during the same periodlacing the telecommunications & media industry as the 13th most frequent victim of ransomware.
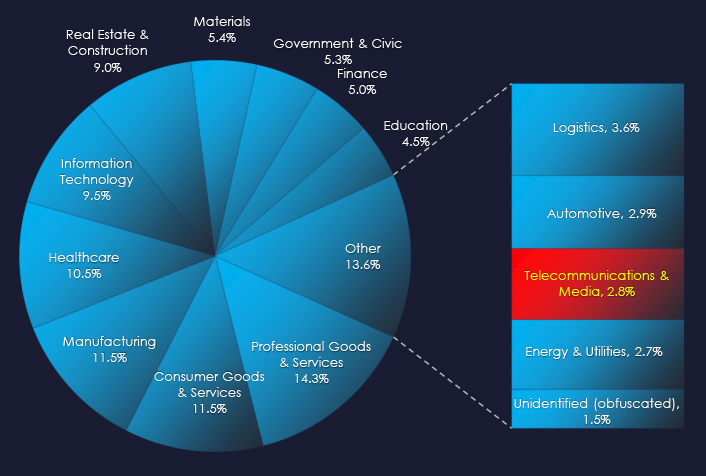
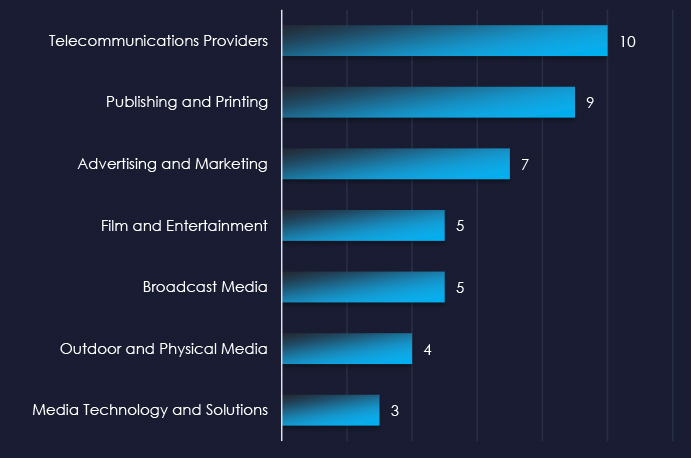
Telecommunications providers, Publishers, and Print with Advertising and Marketing are the most frequent victims of ransomware in the telecommunications & media industry.
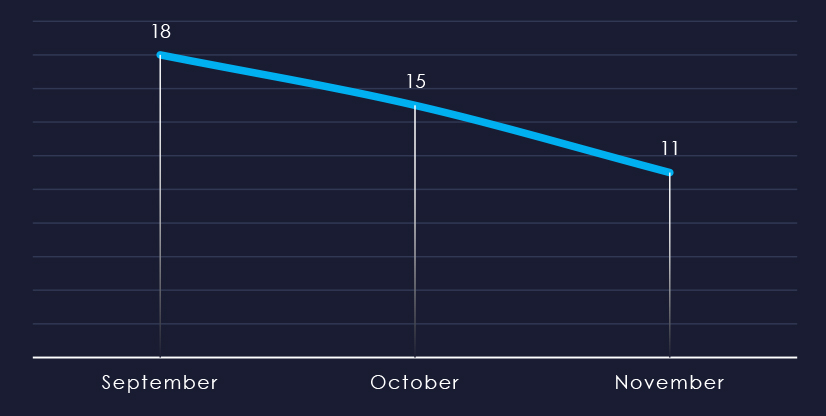
Over the past 90 days, we’ve observed a modest downward trend, though data for the last couple of days of November is still missing.
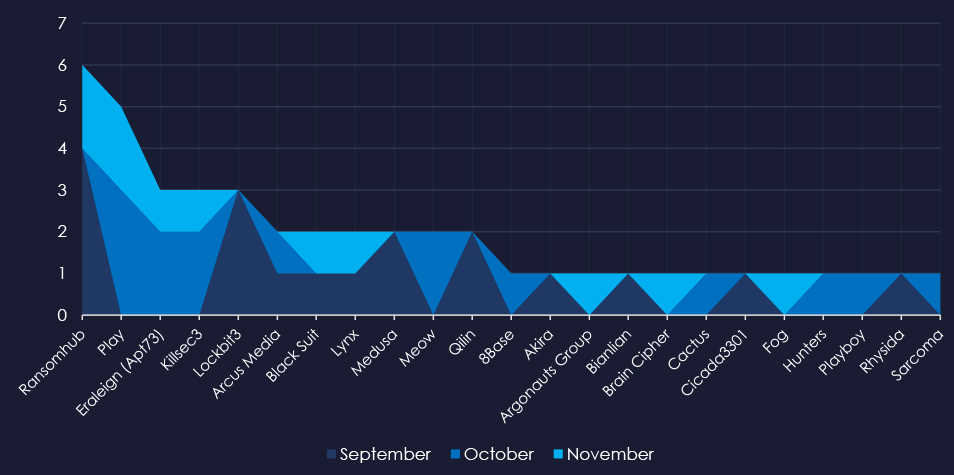
A breakdown of the monthly activity provides insights into which gangs were active each month. For example, RansomHub was active in September and November, but not in October. Play and Eraleign were active in October and November, but not in September.
In total 23 out of 64 active groups recorded telecommunications & media organizations victims in the past 90 days. Notable is the relatively high distribution among a large number of groups in this period.
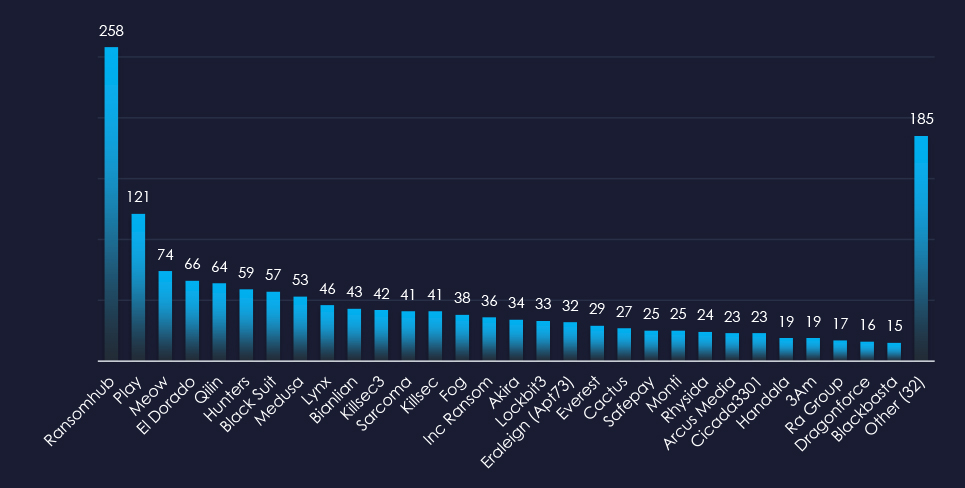
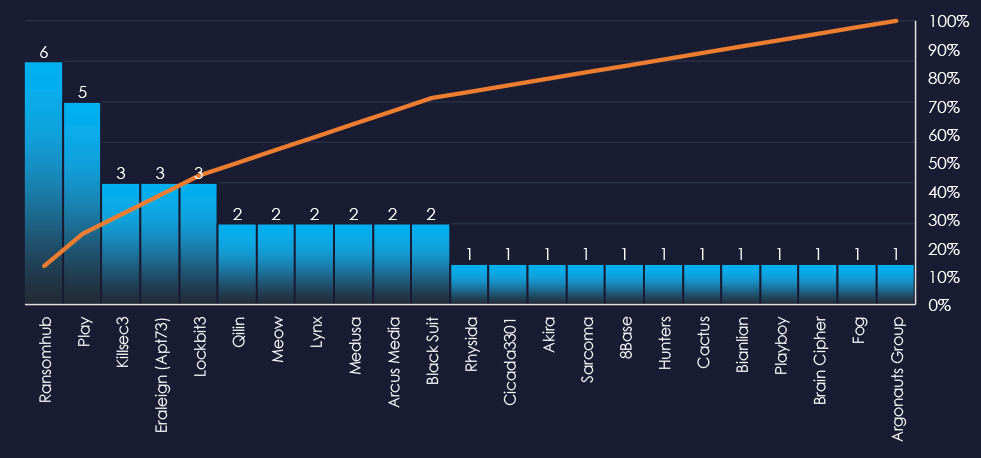
When comparing the manufacturing industry to all recorded victims, RansomHub emerges with the highest number of victims overall. Additionally, Eraleign (APT73) shows the highest targeting of the telecommunications & media sector, with 9% (3 out of 32) of their victims coming from this industry.
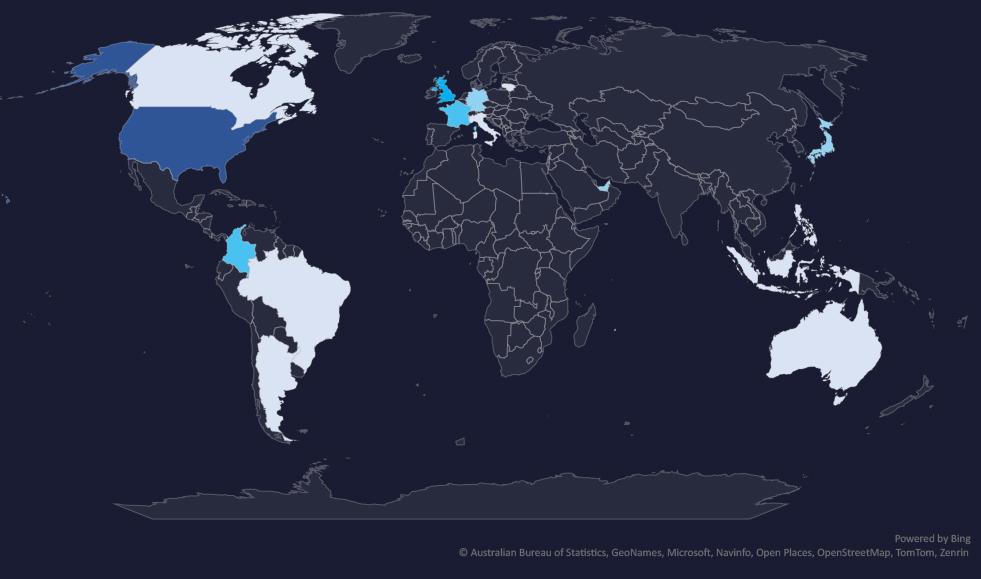
The geographic distribution heatmap underscores the widespread impact of ransomware, highlighting the countries where victims in this industry have been recorded.
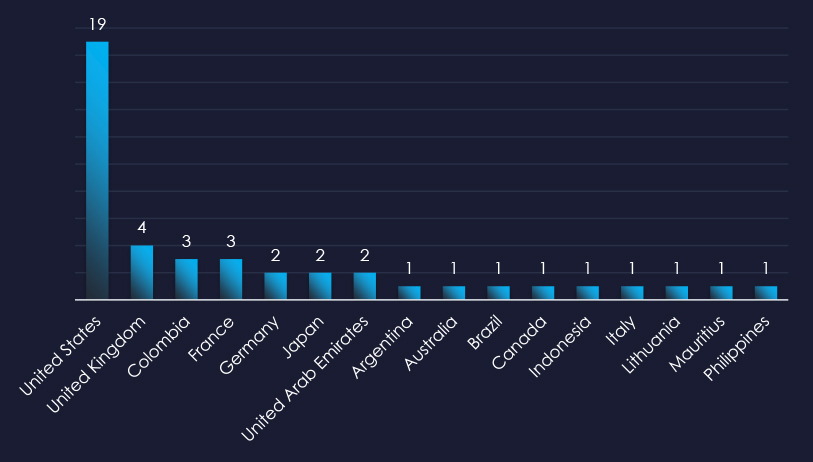
In total 16 countries recorded ransomware victims with the US alone accounting for ~43% of all victims with identified geography.

Risk Level Indicator: Low
The telecommunications & media industry is placed as the 13th most frequent victim. It faces a sustained ransomware threat, with attacks affecting a variety of sub-sectors and a broad geographic distribution. The steady monthly activity, coupled with the involvement of numerous ransomware groups, highlights the ongoing risk.
Monthly Activity Trends
Ransomware activity in the telecommunications & media industry peaked in September and has mildly declined since.
Ransomware Gangs
A total of 23 out of 64 active ransomware groups targeted the telecommunications & media industry in the past 90 days:
RansomHub: Recorded the most victims (6 out of 258 victims), however, only due to the sheer volume, they do not show significant focus on this industry.
Eraleign (APT73): The highest share of their victims were from this industry with 9% (3 out of 32) victims.
The relatively even distribution among many groups indicates no single gang currently dominates the ransomware landscape in the telecommunications & media sectors.
Geographic Distribution
The geographic distribution of ransomware victims in the telecommunications & media industry reflects the industry’s global nature and the widespread reach of these attacks:
43% of all victims with identified geography are located in the US.
Notable is Colombia in the 3rd place and a general presence in Latin America.
In total, 16 countries recorded ransomware victims in the telecommunications & media industry.
For a comprehensive, up-to-date global ransomware tracking report, please refer to our new monthly “Tracking Ransomware” series here.
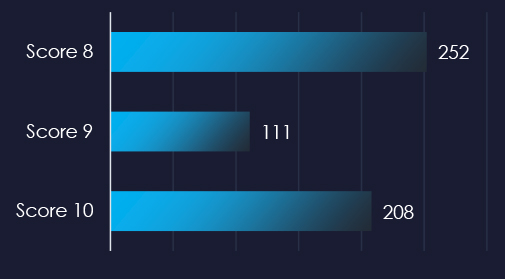
Over the past 3 months, CYFIRMA’s DECYFIR platform recorded 10,947 vulnerabilities with scores higher than 8. This is out of a total of 43,775 newly reported or updated vulnerabilities.
Filtered by relevant vendors, we have observed 1,047 vulnerabilities out of which 571 with a score of 8 or above were related specifically to the telecommunications & media industry.
Only 1 of those reported vulnerabilities have a known exploit.
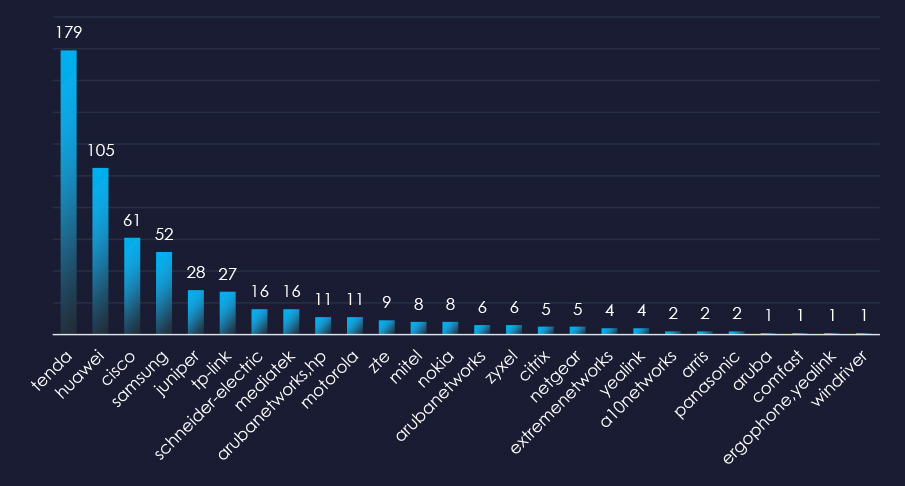
Tenda, Huawei, and Cisco are top vendors with reported vulnerabilities with risk scores of 8 or above.
| Title | NIST LINK |
| The TFTP service in Cisco Unified Communications Manager (aka CUCM or Unified CM) allows remote attackers to obtain sensitive information from a phone via an RRQ operation as demonstrated by discovering a cleartext UseUserCredential field in an SPDefault.cnf.xml file. NOTE: the vendor reportedly disputes the significance of this report stating that this is an expected default behavior and that the product’s documentation describes the use of the TFTP Encrypted Config option in addressing this issue"" | https://nvd.nist.gov/vuln/detail/CVE-2013-7030 |
Over the past 90 days, telecommunications and media organizations have faced high to moderate cyber risks:
APT Campaigns: 54% of observed campaigns (7 out of 13) targeted the sector, with activity peaking in September and slowing by November. Key threat actors included nation-state groups from China, Russia, Pakistan, Iran, Vietnam, and North Korea. Attacks impacted 19 countries aligned with these threat actors’ rival nations. Web applications were most frequently targeted, with operating systems exploited in one campaign.
Phishing: The sector remains a popular phishing theme, increasing from 6.25% to 7.53% of observed attacks. U.S.-based AT&T was the most impersonated brand, indicating large U.S. phishing campaigns, followed by the gaming platform Steam. A total of 65 organizations from 38 countries were impersonated, including O2 (UK), Telstra (Australia), and Singtel (Singapore). Phishing emails primarily originated from the U.S., with significant activity from the Netherlands, China, and Germany. Hong Kong and Singapore are often used as proxies by Chinese cybercriminals. Europe and Latin America are frequent sources of telecom-themed phishing.
Ransomware: Ranked as the 13th most frequent victim, the industry faces a sustained ransomware threat affecting various sub-sectors globally. Activity peaked in September and has declined since. Out of 64 active ransomware groups, 23 targeted the sector. RansomHub recorded the most victims (6 out of 258) but showed no significant focus on the industry. Eraleign (APT73) had the highest share of victims in this sector at 9%. 43% of victims are located in the U.S., with notable activity in Colombia and broader Latin America. Attacks were recorded in 16 countries.
Vulnerabilities: Of 43,775 reported vulnerabilities, 10,947 were high-severity (scored above 8). Specifically, 1,047 vulnerabilities related to the telecommunications and media industry were identified, with 571 scoring 8 or higher. Only one has a known exploit, representing an immediate risk requiring attention.