

The CYFIRMA Industry Report delivers original cybersecurity insights and telemetry-driven statistics of global industries, covering one sector each week for a quarter. This report focuses on the real estate & construction industry, presenting key trends and statistics in an engaging infographic format.
INTRODUCTION
Welcome to the CYFIRMA infographic industry report, where we delve into the external threat landscape of the real estate & construction industry over the past three months. This report provides valuable insights and data-driven statistics, delivering a concise analysis of attack campaigns, phishing telemetry, and ransomware incidents targeting the real estate & construction industry.
We aim to present an industry-specific overview in a convenient, engaging, and informative format. Leveraging our cutting-edge platform telemetry and the expertise of our analysts, we bring you actionable intelligence to stay ahead in the cybersecurity landscape.
CYFIRMA provides cyber threat intelligence and external threat landscape management platforms, DeCYFIR and DeTCT, which utilize artificial intelligence and machine learning to ingest and process relevant data, complemented by manual CTI research.
For the purpose of these reports, we leverage the following data from our platform. These are data processed by AI and ML automation based on both human research input and automated ingestions.
While this report contains statistics and graphs generated primarily by automation, it undergoes thorough review and enhancement for additional context by CYFIRMA CTI analysts to ensure the highest quality and provide valuable insights.
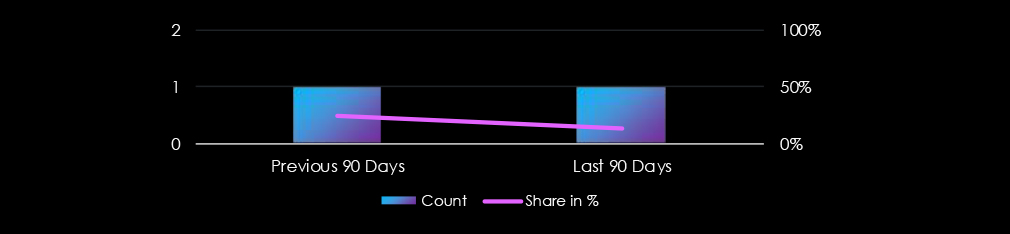
Real estate & construction organizations did feature in 1 of the 7 observed campaigns, which is a presence in 14% of all campaigns, same as the previous period (1 out of 4), however, with a decrease in overall share from a 25% presence.

The single observed campaign occurred in April.

The observed campaign is attributed to two Chinese APTs. We observe overlapping tactics, techniques, and procedures (TTP) between the older naming convention Stone Panda and the new tool-based Salt Typhoon. We hypothesize that these are likely the same or reorganized nation-state teams or units.
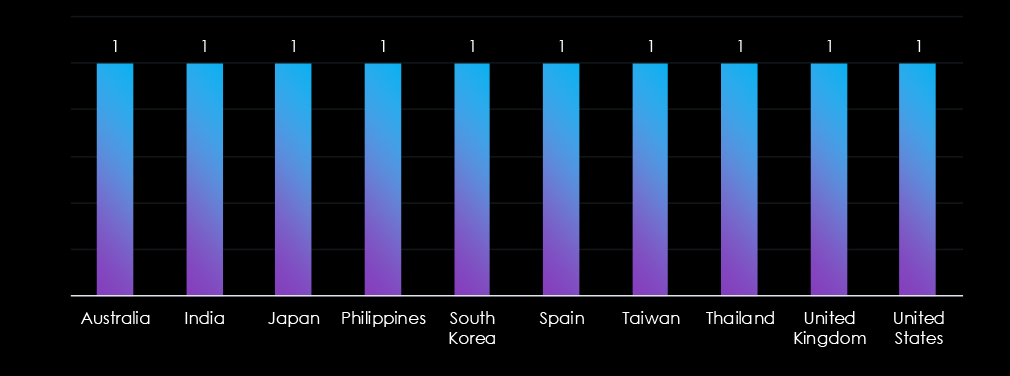
Victims of the observed attack campaign have been documented in ten different countries. Among the listed countries are Asian nations, NATO members, and those involved in the QUAD alliance, which are of geopolitical significance to the Chinese government.
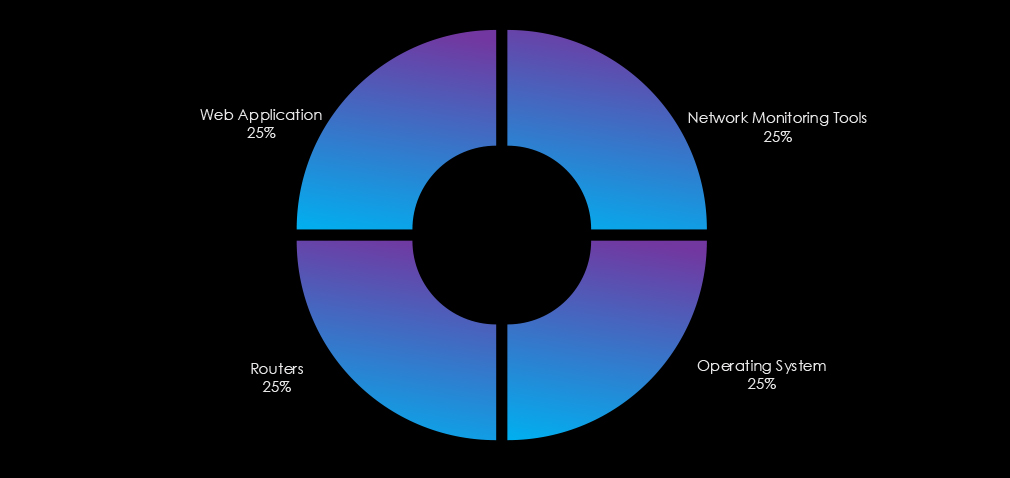
The observed campaign targeted web applications, operating systems, routers, and network monitoring tools.

In the past 90 days, real estate & construction organizations have not been significantly affected by advanced persistent threat (APT) campaigns. 1 in 7 observed APT campaigns targeted this industry, representing a 14% presence.
This is same as the previous 90-day period, when 1 out of 4 campaigns targeted the real estate & construction industry.
Monthly Trends
The observed campaign occurred during April.
Key Threat Actors
The campaigns is attributed to Chinese threat actors Stone Panda and Salt Typhoon which we hypothesize to be same or reformed APT under new naming convention.
Geographical Impact
The campaigns have affected a total of 10 countries, seemingly distributed randomly across continents. However, most countries are also of interest to the Chinese Communist Party (CCP).
Targeted Technologies
Web applications and operating systems remain the most frequently targeted technology. Additionally, routers and network monitoring tools have been compromised.
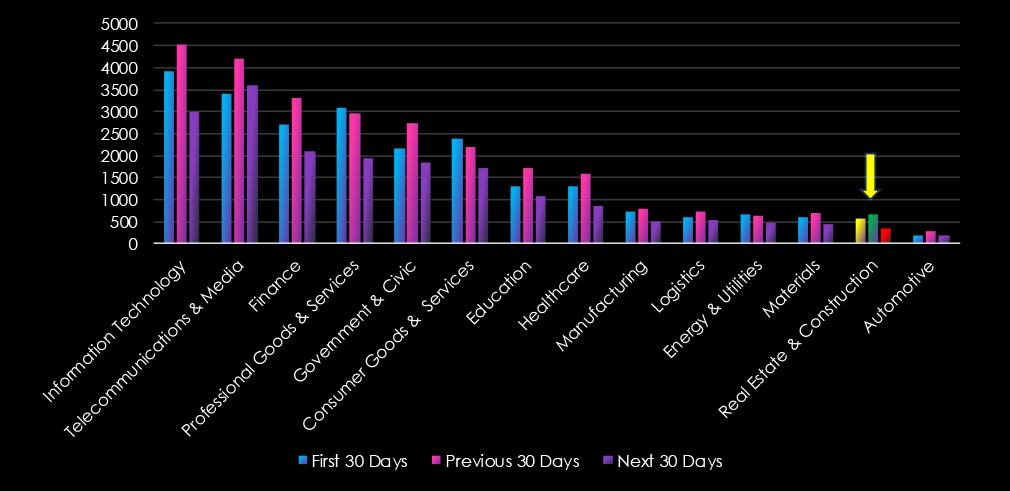
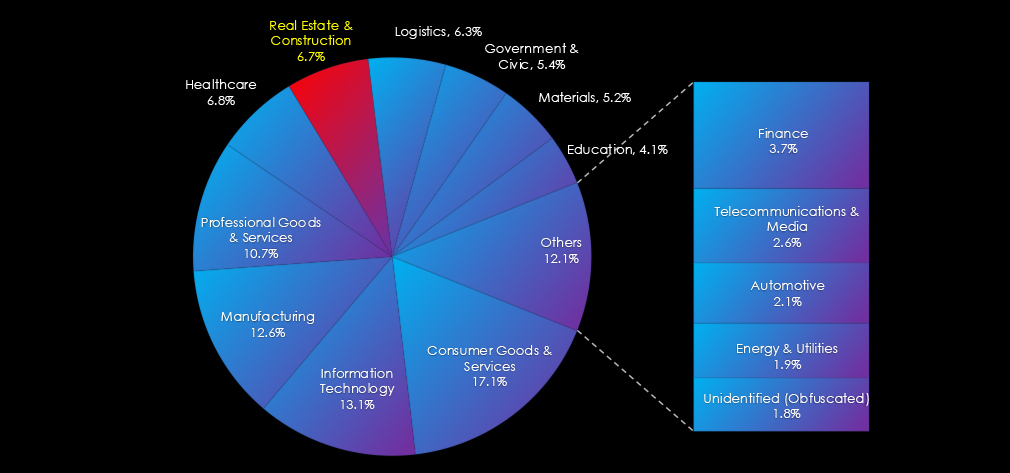
Over the past three months, CYFIRMA’s telemetry has identified 1,603 mentions of real estate & construction out of a total of 69,396 industry mentions. This is from a total of 386,105 posts across various underground and dark web channels and forums.
Real estate & construction placed 13th out of 14 industries in the last 90 days with a share of 2.31% of all detected industry chatter.
Below is a breakdown of 30-day periods of all mentions.
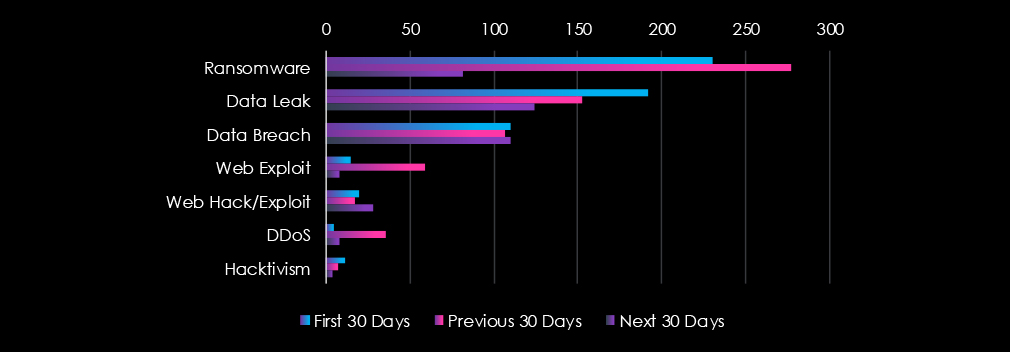
Ransomware is the most common category of recorded chatter in this industry. Data leaks follow in second place and Data Breaches in close third place.

In total, the real estate & construction industry comprises 2.31% of all detected industry underground and dark web chatter in the last 90 days, ranking 13th out of 14 industries.
Below are observed key trends across 90 days:
Ransomware Activity Dropped Sharply
230 → 277 → 82 (↓70% from peak)
A significant decline after two high-activity periods.
Data Leak & Breach Activity
Data Leak: 192 → 153 → 124
Data Breach: 110 → 107 → 110 (stable)
While leaks are trending down, breaches are steady.
Web Exploits Spiked, Then Collapsed
15 → 59 → 8
Suggests a brief period of targeted exploitation that has since cooled off—possibly patched or mitigated.
Web Hack/Exploit Activity Increasing
20 → 17 → 28 (↑40% from Feb)
Indicates renewed probing of web applications or exposed platforms, despite the drop in broader exploit chatter.
DDoS and Hacktivism Trending Down
DDoS: 5 → 36 → 8
Hacktivism: 11 → 7 → 4
Temporary spikes may have been linked to campaign-based or regional events.
Over the past three months, CYFIRMA’s telemetry has identified 99 mentions of real estate & construction industry out of a total of 4,883 industry mentions. This is from a total of 11,151 CVE published in 90 days.
Real estate & construction industry ranked 10th out of 14 industries in the last 90 days with a share of 2.03% of all detected industry linked vulnerabilities.
Below is a breakdown of 30-day periods of all mentions.
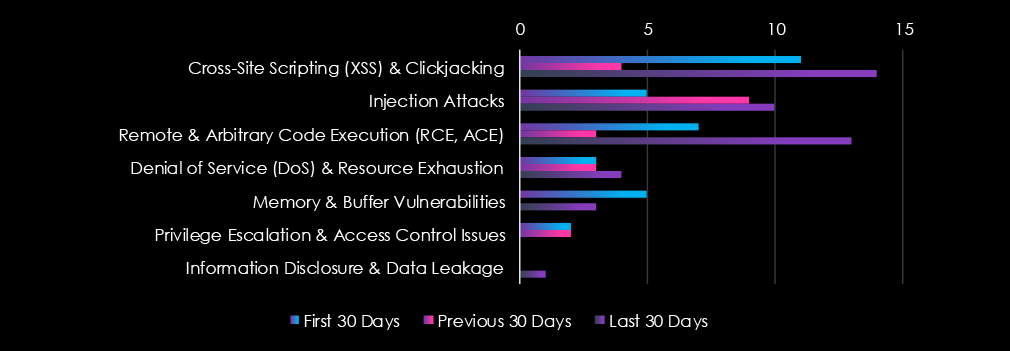
Cross-Site Scripting (XSS) & Clickjacking, Injection Attacks and Remote & Arbitrary Code Execution (RCE, ACE) are nearly equally top three vulnerabilities reported for this industry.

In total, real estate & construction comprises 2.03% of all detected industry vulnerabilities in the last 90 days, ranking 10th out of 13 industries.
Below are the observed key trends across 90 days.
Remote Code Execution (RCE):
7 → 3 → 13 → A significant jump from the latest period (↑333%), making RCE the most urgent risk.
Indicates attackers may be shifting to direct, high-impact system exploits.
Web-Based Threats Resurfacing
Cross-Site Scripting (XSS):
11 → 4 → 14 → Back stronger than before (↑250% from Feb)
Injection Attacks:
Gradual rise: 5 → 9 → 10 → Consistent web security risk.
Memory/Buffer Vulnerabilities Reappearing
5 → 0 → 3 → Returned after being absent, highlighting possible new or unpatched issues.
Minor & Low-Volume Threats
Denial of Service (DoS): 3 → 3 → 4 → Steady, low-volume concern.
Information Disclosure: Only 1 mention in the last period.
Privilege Escalation: 2 → 2 → 0 → Currently dormant, but could re-emerge.
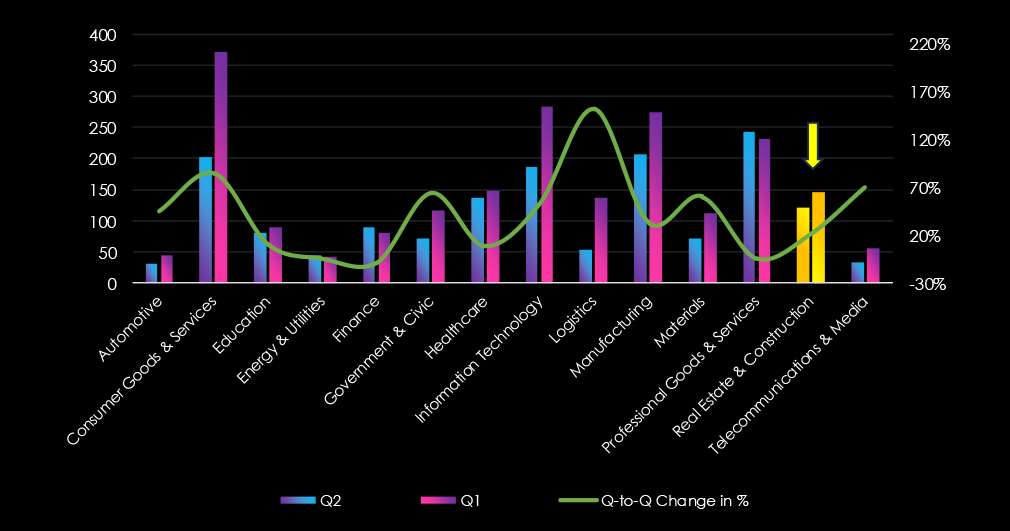
In the past 90 days, CYFIRMA has identified 146 verified ransomware victims in the real estate & construction industry. This accounts for 6.74% of the overall total of 2,167 ransomware victims during the same period, placing real estate & construction industry 6th out of 14 industries.
Furthermore, a quarterly comparison reveals a notable increase of interest in the real estate & construction industry of 21.7% from 120 to 146 victims. The overall share decreased from 7.5% to 6.7% of all victims.
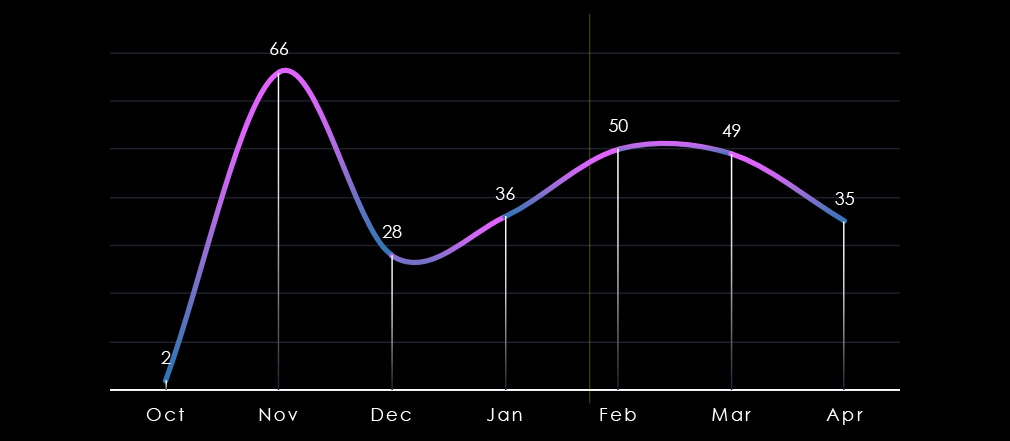
Over the past 180 days, we have observed significant and mostly sustained activity across months. October data is only a few days. After a spike in November, activity dipped during the December holiday season and so far peaked in February.
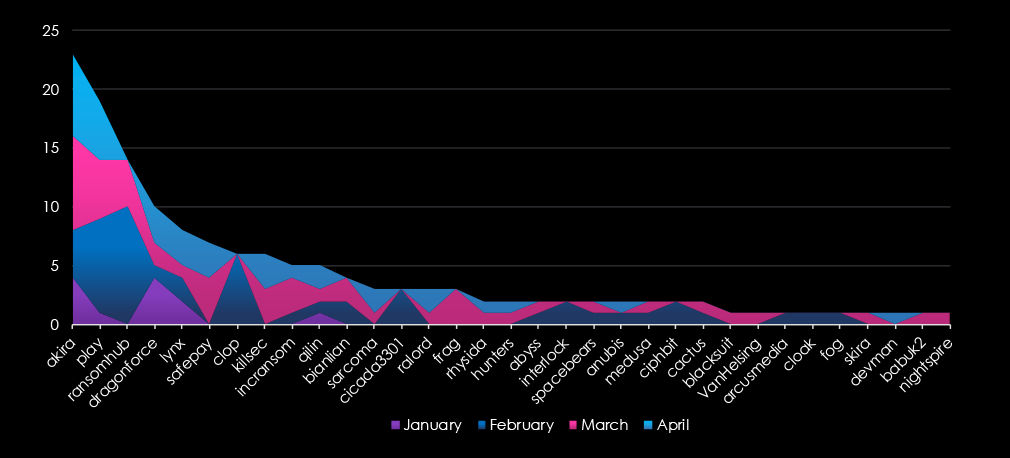
A breakdown of monthly activity per top 25 gangs provides insights into which gangs were active each month. For example, the most active gang Akira was consistently active across months. On the other hand, Cl0p recorded all victims in February during their rampage.
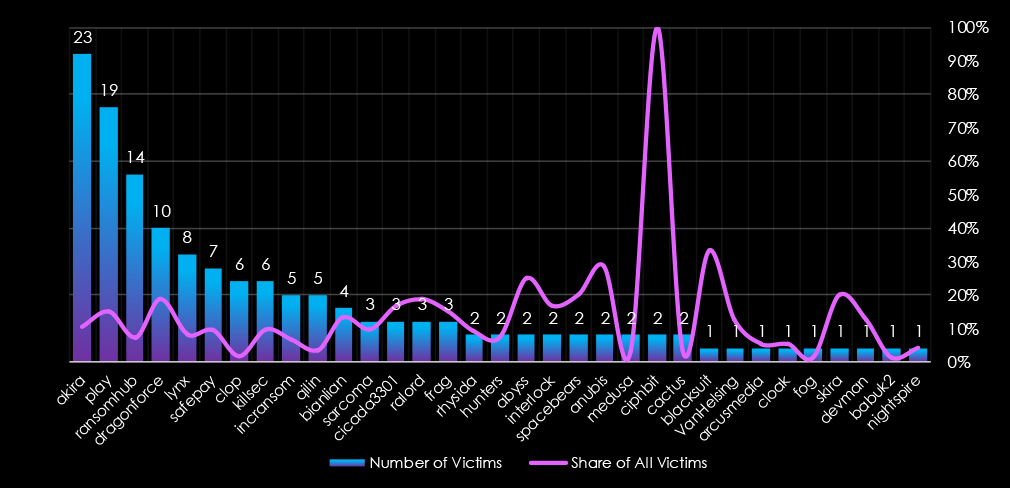
Out of the 71 gangs, 33 were active in the last 90 days. Akira gang had the highest number of victims (23), followed by Play (19) and RansomHub (14).
Interestingly, the share of victims for some gangs in this industry is relatively high. Seven out of the top 10 gangs recorded approximately 10% or more of the victims in this industry.
Among the top 5 gangs, Akira (10.4%), Play (15%), RansomHub (7.3%), Dragonforce (18.9%), and Lynx (8.2%) all recorded significant shares in this industry.
In contrast, Cl0p’s rampage resulted in only 1.8% of their victims being affected by this industry.
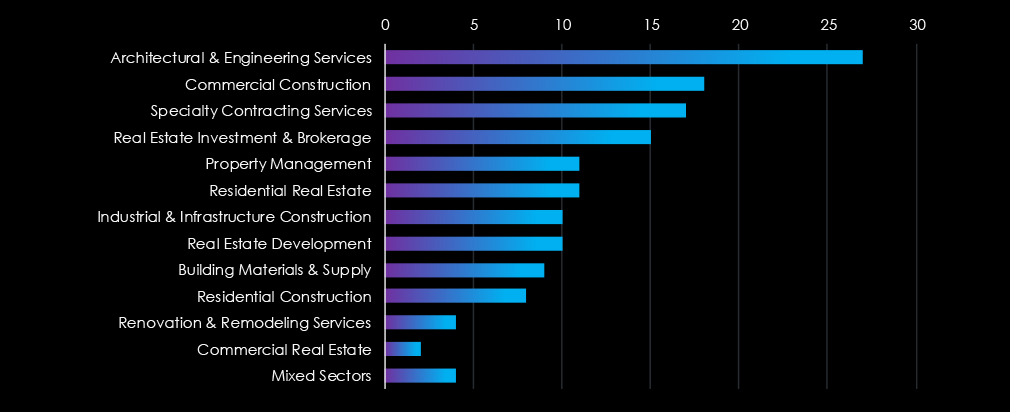
Architectural & Engineering Services have been the most frequent victim of ransomware in this industry in the past 90 days. Commercial Construction and Specialty Contracting Services follow in second and third place respectively.
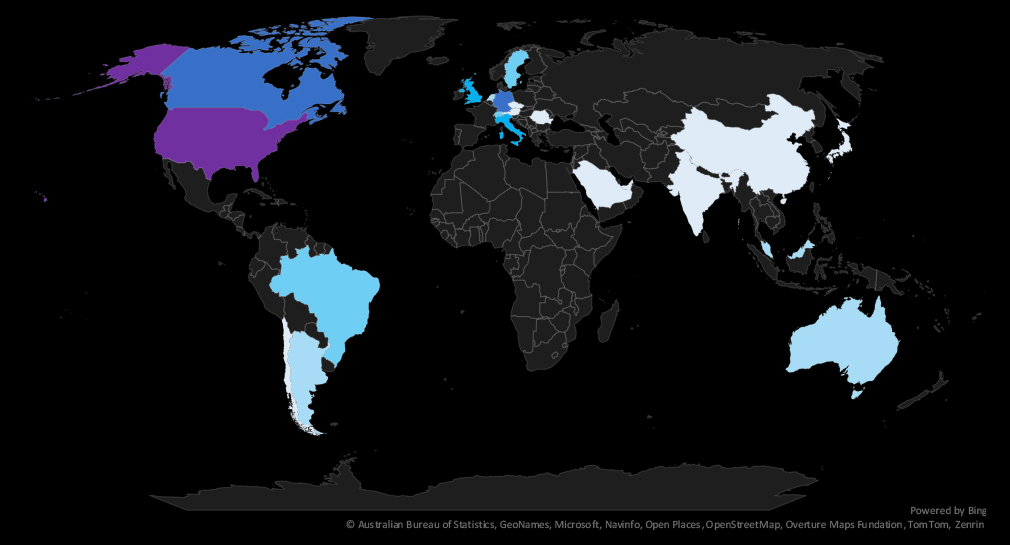
The geographic distribution heatmap underscores the widespread impact of ransomware, highlighting the countries where victims in this industry have been recorded.
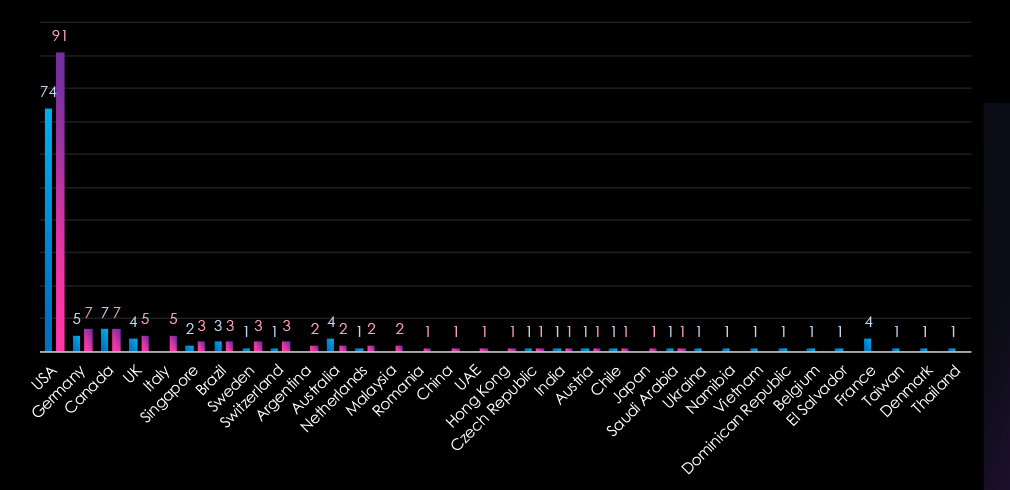
The chart shows quarter-to-quarter changes in targeted countries. Data is sorted by last 90 days and compared to the previous 90 days marked blue.
USA recorded 91 victims in last 90 days, an increase from 74 and represents 62% of all victims. Germany, Canada, UK and Italy follow in top . Notably the small nation Singapore ranked high as well.

The real estate & construction industry placed 6th out of 14 monitored industries, recording 146 victims in the last 90 days, a notable increase of 21.7% from 120 victims in the previous 90-day period.
Overall share decreased from 7.5% to 6.7% of all ransomware victims.
Monthly Activity Trends
The monthly activity was significant and sustained across the last 180 days with a peak in February.
Akira was the most active gang overall followed by Play and Ransomhub.
Ransomware Gangs
A total of 33 out of 71 active ransomware groups targeted this industry in the past 90 days:
Akira: The most active with 23 victims and 10.4% of their victims from the IT sectors (23 out of 222 victims).
Play, Dragonforce: Highest share in top 10 gangs. 15% and 18.9% victims in this industry (19 out of 127 and 10 out of 53) respectively, suggesting a higher interest in this industry.
Geographic Distribution
The geographic distribution of ransomware victims is dominated by the USA (91) accounting for 62% of all victims, warranting a high risk, followed by Germany, Canada, the UK, and Italy all of which saw an increase from the previous 90 days.
In total, 23 countries recorded ransomware victims in this industry in the last 90 days, a minor decrease from 25 in the previous period.
For a comprehensive, up-to-date global ransomware tracking report, please refer to our new monthly “Tracking Ransomware” series here.
APT Campaigns: Real estate & construction remained a low-priority target for APT actors, with only one of seven observed campaigns (14%) affecting the sector—unchanged from the previous 90-day period. The April campaign was attributed to Chinese groups Stone Panda and Salt Typhoon, possibly operating under revised naming. Ten countries were impacted, generally aligned with Chinese geopolitical interests. Web applications and operating systems were primary targets, with some exploitation of routers and network monitoring tools.
Underground & Dark Web Chatter: This industry accounted for just 2.31% of dark web and underground chatter, ranking 13th out of 14 sectors. Ransomware mentions dropped sharply by 70% after a previous surge. Data leaks trended down, while breaches remained stable. Web exploit chatter briefly spiked but then collapsed, though web hack/exploit mentions rose 40% in March, suggesting persistent probing of exposed platforms. DDoS and hacktivism activity showed a continued decline, likely event-driven.
Vulnerabilities: Real estate & construction represented 2.03% of detected CVEs, placing 10th overall. RCE vulnerabilities saw a sharp increase in the latest period (+333%), making them the most urgent concern. Web threats re-emerged: XSS rose 250%, and injection attacks continued a steady rise. Memory/buffer vulnerabilities also resurfaced after a lull. Other categories—DoS, information disclosure, and privilege escalation—remained minor or inactive.
Ransomware: The sector ranked 6th in ransomware frequency, with 146 victims—a 21.7% increase from the prior period, though its overall share decreased slightly (from 7.5% to 6.7%). February marked a peak in activity. Akira led in total victims (23), while Play (15%) and Dragonforce (18.9%) had the highest proportional targeting. The U.S. accounted for 62% of attacks, justifying a higher local risk rating. A total of 23 countries were affected, down slightly from 25 previously.