

The CYFIRMA Industry Report delivers original cybersecurity insights and telemetry-driven statistics of global industries, covering one sector each week for a quarter. This report focuses on the real estate & construction industry, presenting key trends and statistics in an engaging infographic format.
Welcome to the CYFIRMA infographic industry report, where we delve into the external threat landscape of the real estate & construction industry over the past three months. This report provides valuable insights and data-driven statistics, delivering a concise analysis of attack campaigns, phishing telemetry, and ransomware incidents targeting the real estate & construction organizations.
We aim to present an industry-specific overview in a convenient, engaging, and informative format. Leveraging our cutting-edge platform telemetry and the expertise of our analysts, we bring you actionable intelligence to stay ahead in the cybersecurity landscape.
CYFIRMA provides cyber threat intelligence and external threat landscape management platforms, DeCYFIR and DeTCT, which utilize artificial intelligence and machine learning to ingest and process relevant data, complemented by manual CTI research.
For the purpose of these reports, we leverage the following data from our platform. These are data processed by AI and ML automation based on both human research input and automated ingestions.
While this report contains statistics and graphs generated primarily by automation, it undergoes thorough review and enhancement for additional context by CYFIRMA CTI analysts to ensure the highest quality and provide valuable insights.
Over the past 90 days, the Real estate & Construction industry featured in 1 out of the 16 observed campaigns, which is a presence in 6.25% of all campaigns. That is one less than 2 in the previous 90 days, as well as a decline in the overall share from 13.3% (2 out of 15).
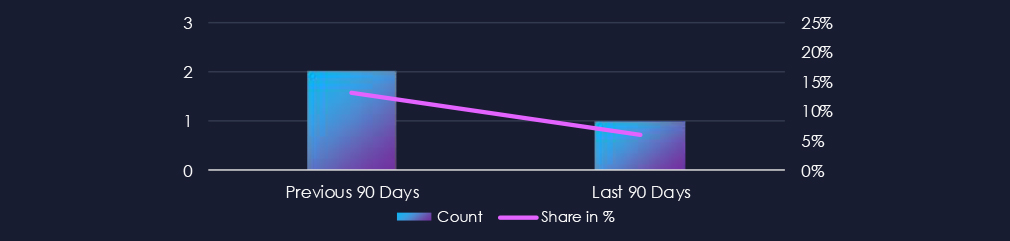

The observed campaign was detected in September. Since then, we have not detected new specific signals; however, it is safe to assume campaigns are quietly ongoing.

Despite only one campaign observed, we have collected overlapping TTPs between Russian cybercrime syndicates TA505, FIN7, FIN11, and a government-linked group, Gamaredon.
Despite the campaign coming from Russia, victimology shows a significant share of Asian countries, showing that Russian financially motivated cybercrime reaches beyond just Europe and the USA.

The observed campaign is focusing primarily on Web Applications as the main attack vector.

Over the past 90 days, the real estate & construction industry has not been significantly affected by advanced persistent threat (APT) campaigns.
Out of the 16 observed APT campaigns, only 1 targeted this industry, representing 6.25% of the observed campaigns. This is a decline from the previous 90-day period, during which 2 out of 15 campaigns targeted this industry.
Monthly Trends
The observed campaign occurred during September.
Key Threat Actors
Mixed TTPs of the campaign point to Russian cybercrime syndicates TA505, FIN7, FIN11, and a Russian government-linked group, Gamaredon.
Geographical Impact
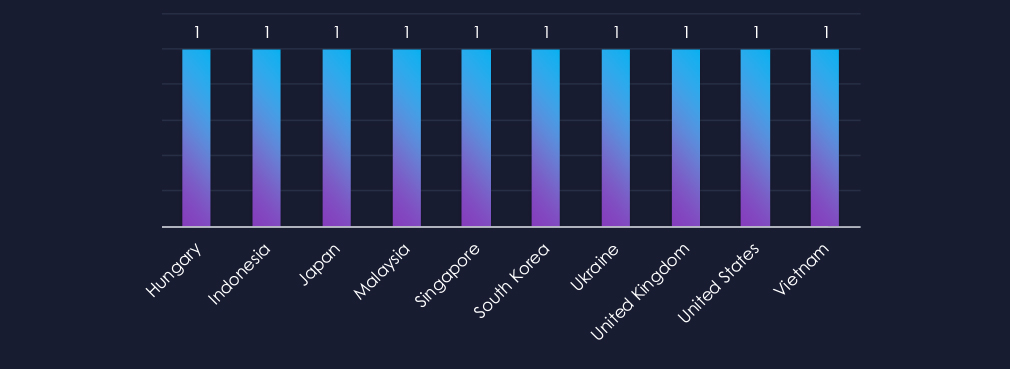
Overall, 10 countries recorded victims in observed campaigns. Despite the campaign’s origin in Russia, we have observed 6 Asian countries on the list.
The campaign targeted web applications as the primary attack vector.
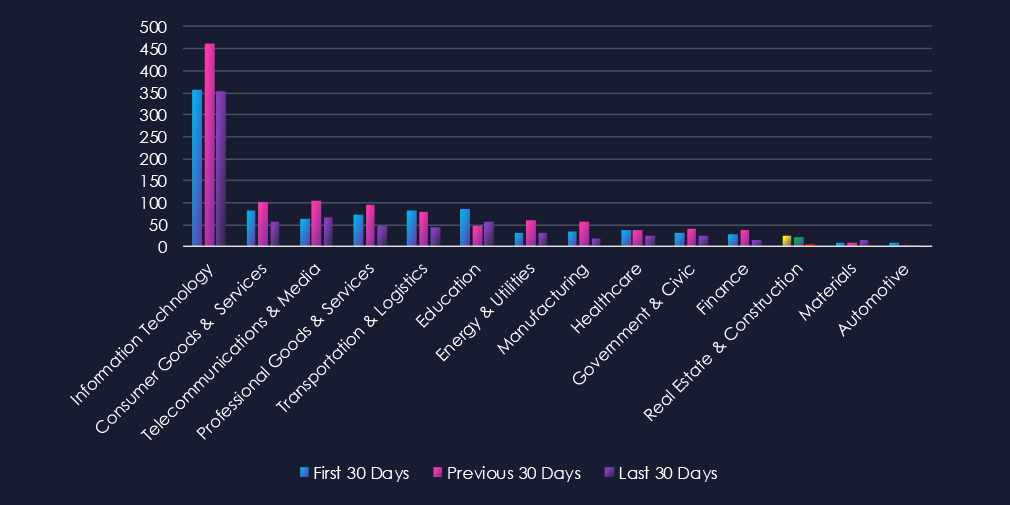
Over the past three months, CYFIRMA’s telemetry has identified 1,687 mentions of the real estate & construction industry out of a total of 95,184 industry mentions. This is from a total of 300k+ posts across various underground and dark web channels and forums.
The real estate & construction industry placed 13th out of 14 industries in the last 90 days, with a share of 1.77% of all detected industry-linked chatter.
Below is a breakdown by 30-day periods of all mentions.
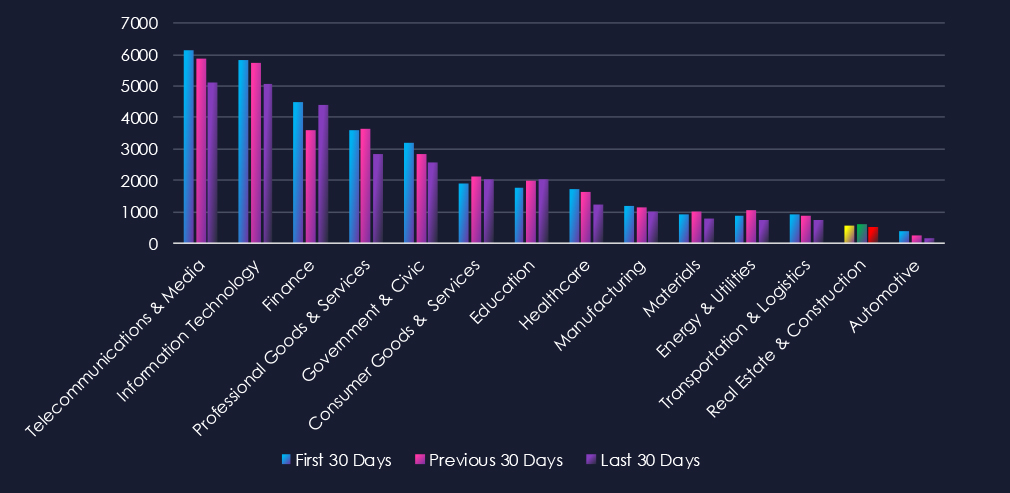
Thanks to the previous 30-day spike, ransomware is the most common category of recorded chatter for this industry. Data Breaches and Data Leaks follow on top.

In total, the real estate & construction industry comprises 1.77% of all detected industry underground and dark web chatter in the last 90 days, ranking 13th out of 14 industries.
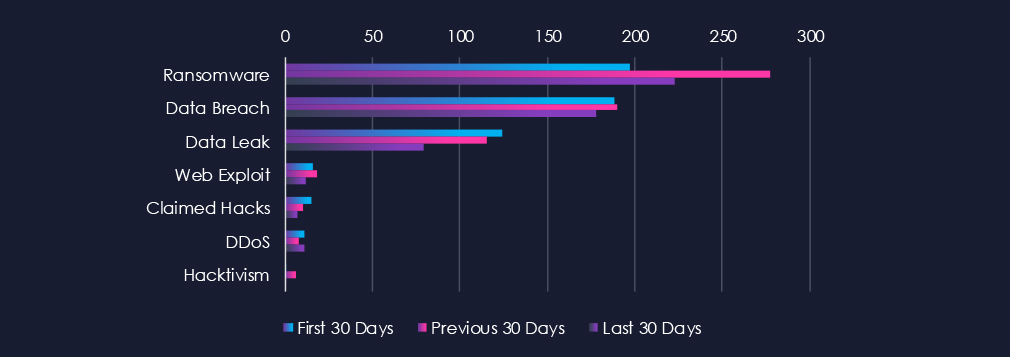
Below are the observed key trends across 90 days:
Ransomware
197 → 277 → 223, Very high overall, with a mid-period peak followed by a moderate decline. This sector remains attractive to ransomware operators due to its project-driven workflows, reliance on third-party contractors, and often fragmented security environments.
Data Breach
188 → 190 → 178, Relatively stable with a slight recent decline. Indicates persistent compromise attempts against real estate platforms, property management systems, and construction firms, often via vendor and subcontractor networks.
Data Leak
124 → 115 → 79, Clear downward trend. This suggests fewer large-scale data exfiltration events are being openly traded, though it may also reflect a shift toward private access-broker sales rather than public leaks.
Web Exploit
16 → 18 → 12, Mild fluctuations but generally stable at moderate levels. Reflects continuous probing of real estate portals, bidding platforms, developer dashboards, and property listing systems.
Claimed Hacks
15 → 10 → 7, Gradual reduction. Fewer publicly bragged claims may indicate attackers are moving toward quieter monetization, focusing on access sales or targeted extortion rather than public announcements.
DDoS
11 → 8 → 11, Decline followed by a return to earlier volume. Disruption campaigns remain present but not dominant; most attacks in this sector aim at extortion or pressure during ransomware negotiations.
Hacktivism
1 → 6 → 1, Temporary mid-period spike followed by normalization. Likely related to short-lived ideological or political campaigns, not a sustained trend.
Over the past three months, CYFIRMA’s telemetry has identified 56 mentions of the real estate & construction industry out of a total of 2,883 industry mentions. This is from over 10k CVEs reported and updated in the last 90 days.
Real estate & construction industry ranked 12th out of 14 industries in the last 90 days, with a share of 1.94% of all detected industry-linked vulnerabilities.
Below is a breakdown by 30-day periods of all mentions.
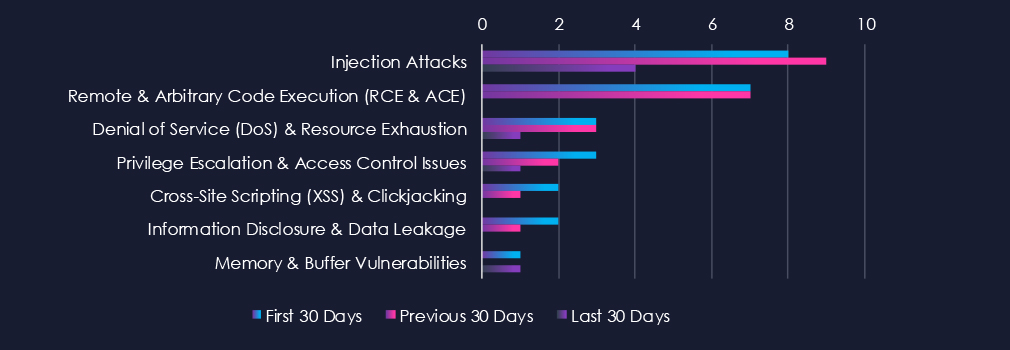
The first 60 days out of the last 90 show a larger number of reported or updated CVEs in this industry. In all categories, we see a drop in new CVEs during the last 30 days.

In total, the real estate & technology industry comprises 1.94% of all detected industry-linked vulnerabilities in the last 90 days, ranking 12th out of 14 industries.
Below are the observed key trends across 90 days.
Injection Attacks
8 → 9 → 4, Moderate early activity with a drop in the latest period. This suggests fewer newly discovered input-handling flaws in real estate platforms and construction management systems during the most recent disclosure window.
Remote & Arbitrary Code Execution (RCE & ACE)
7 → 7 → 0, Previously steady, but no RCE disclosures in the latest period. While positive, this may simply reflect a temporary lull in research focus or delayed vendor publication cycles rather than a systemic security improvement.
Denial of Service (DoS) & Resource Exhaustion
3 → 3 → 1, Consistently low and trending downward. DoS-related issues appear infrequently in this sector’s software stack.
Privilege Escalation & Access Control Issues
3 → 2 → 1, Gradual decline. Indicates fewer discovered weaknesses in role permissions or authentication controls in recent disclosures.
Cross-Site Scripting (XSS) & Clickjacking
2 → 1 → 0, Decreasing to zero. Web-facing applications continue to receive attention, but recent periods saw no new reported XSS findings.
Information Disclosure & Data Leakage
2 → 1 → 0, Similar downward trend, with no new disclosures in the latest cycle. Suggests fewer configuration or exposure-related findings were reported.
Memory & Buffer Vulnerabilities
1 → 0 → 1, Very low and fluctuating. These types of low-level issues rarely dominate in this sector but continue to surface occasionally in legacy or vendor-proprietary tools.
In the past 90 days, CYFIRMA has identified 197 verified ransomware victims in the real estate & construction industry. This accounts for 9.8% of the overall total of 2,007 ransomware victims during the same period, placing the real estate & construction industry 5th out of 14 industries.
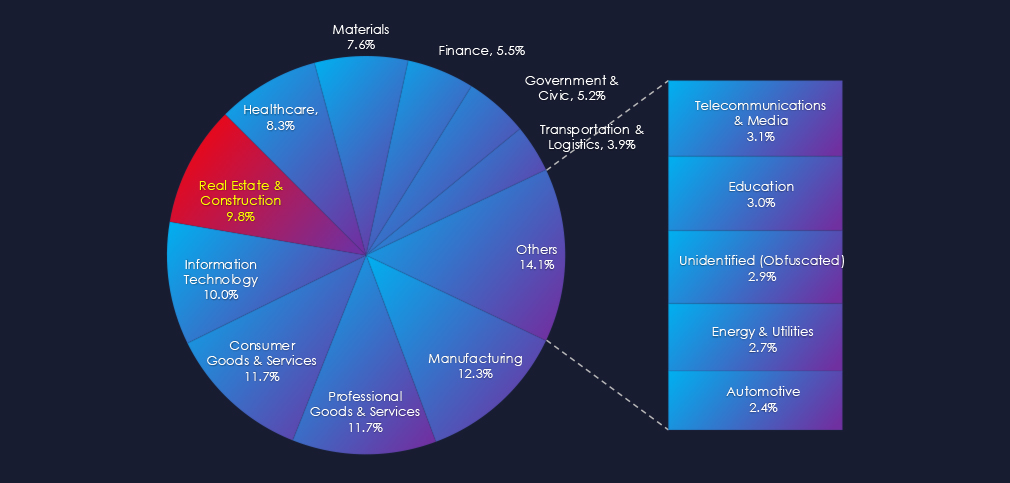
Furthermore, a quarterly comparison reveals a significant growth of victims in the real estate & construction industry, with an increase of 77.5% from 111 to 197 victims. The overall share of victims also increased from 7.6% to 9.82% of all victims. This is a stronger indicator of concern than the total number of victims.
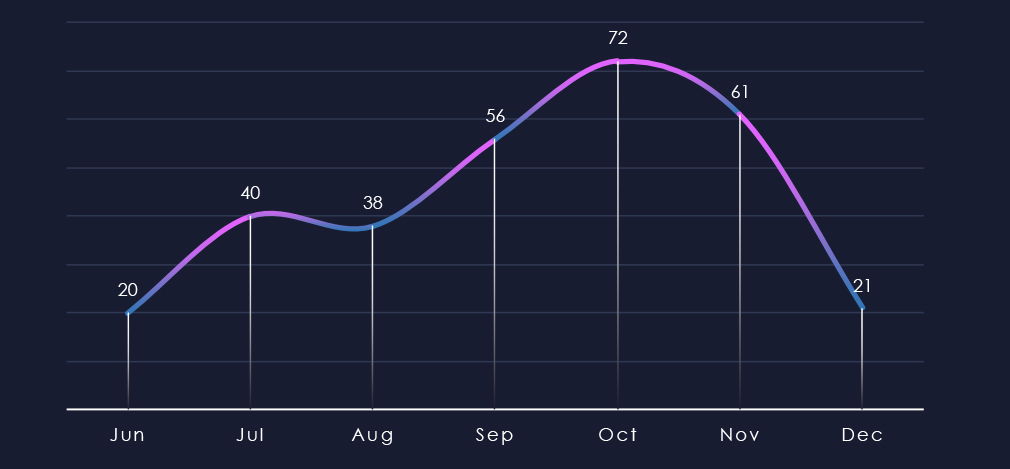
Over the past 180 days, we can clearly see the gradual escalation of the number of victims in the real estate & construction sectors. Culminating in October, however, the first week of December has already recorded 21 victims, suggesting high numbers will be sustained.
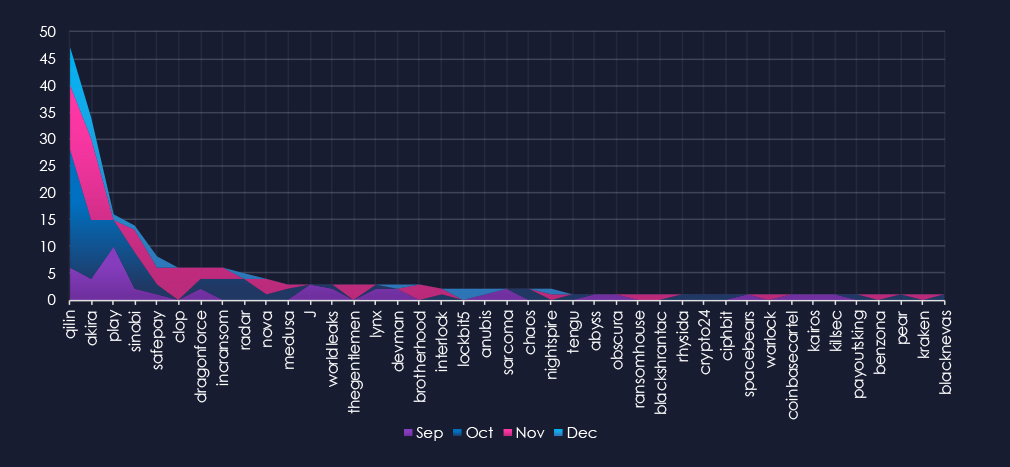
A breakdown of monthly activity per gang provides insights into which gangs were active each month. For example, the most active gang, Qilin, is clearly the main driver of the inflated number of victims across the past few months. However, Akira, Sinobi, Incransom, and Radar also contributed in October. Cl0p with Akira was behind many victims during November.
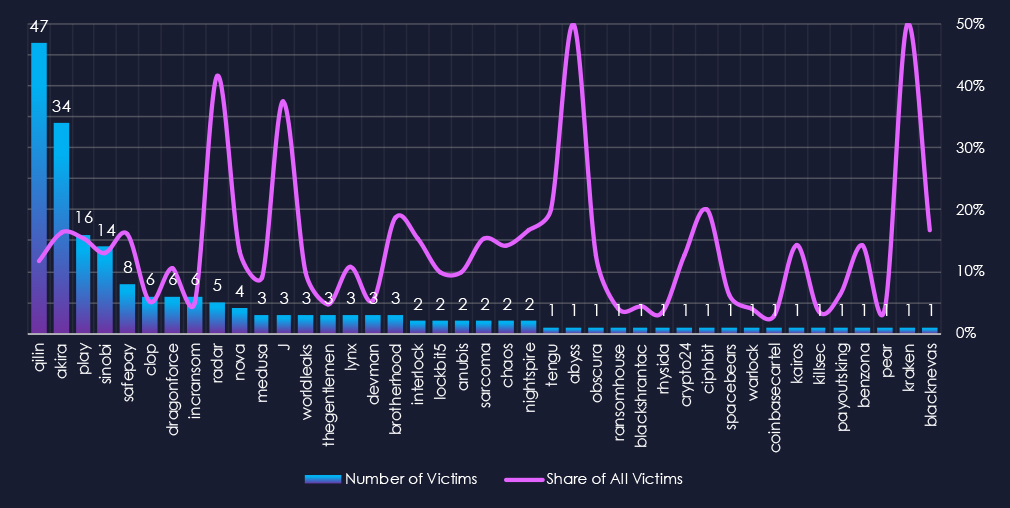
Out of the 70 gangs, 41 recorded victims in this industry in the last 90 days (59% participation). Qilin and Akira had the highest number of victims (47, 34) with respective shares of 11.7% and 16.3%. This is relatively high for top gangs with hundreds of victims.
The share of victims for most gangs in this industry had grown. From the top 15, only four gangs recorded a share below 10%.
Disregarding gangs with low victims, Radar (41.7%) and J (37.5%) had the highest share of victims, implying a high focus on this industry.
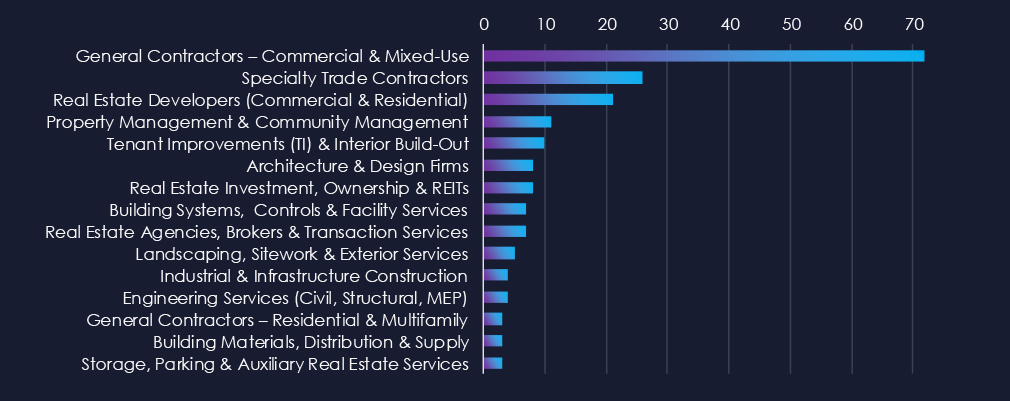
General and Specialty Contracting are leading the chart. Real Estate Developers and Property Management follow on top.
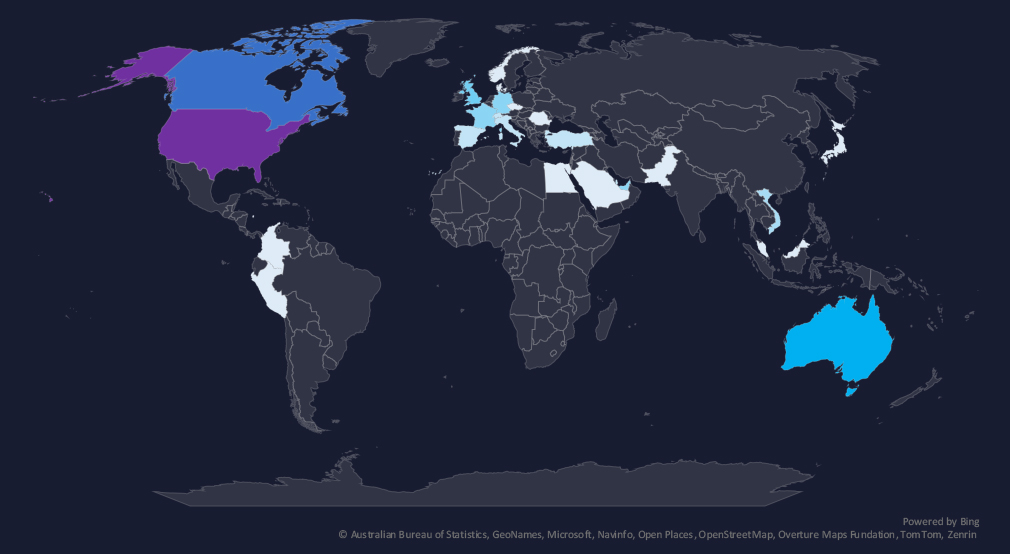
The geographic distribution heatmap underscores the widespread impact of ransomware, highlighting the countries where victims in this industry have been recorded in the last 90 days.
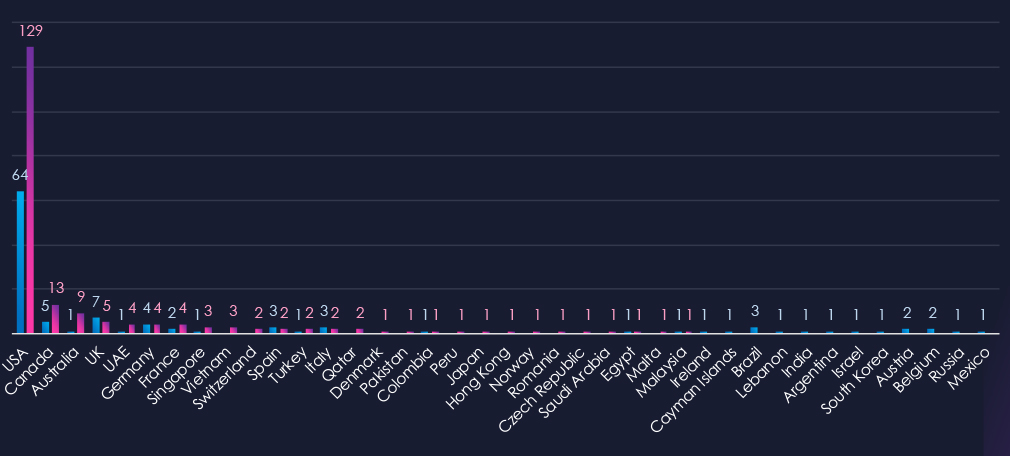
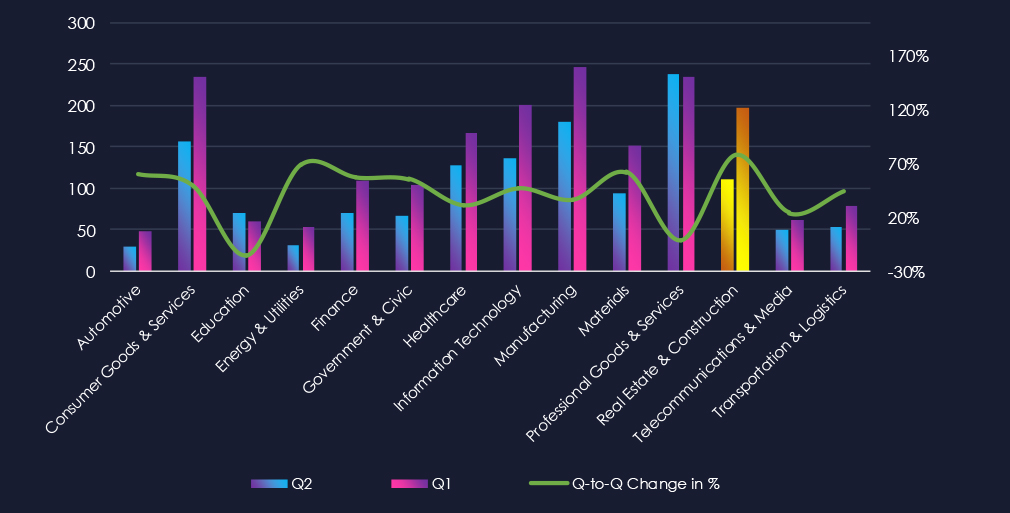
The chart shows quarter-to-quarter changes in targeted countries. Data is sorted by the last 90 days and compared to the previous 90 days, marked in blue.
Geographic victimology clearly shows that the USA targeting is behind the recent spike in victims. With 129 victims, the US share is 65.5% of all victims. Canada and Australia also recorded an increase in victims, though lower in total numbers, large in relative %.

Real estate & construction industry placed 5th out of 14 monitored industries recording 197 victims in last 90 days. Significant increase of 77% from 111 victims in previous 90 days period.
Overall share also increased from 7.6% to 9.8% of all ransomware victims.
Monthly Activity Trends
Monthly activity trends show clear and sharp growth. December during first week already shows nearly one third of previous all time high.
Ransomware Gangs
A total of 41 out of 70 active ransomware groups targeted the this industry in the past 90 days representing 59% participation:
Qilin, Akira: The most active all with 47 & 34 victims respectively and 12% & 16% of their victims in this industry. Which is relatively high for these highly active gangs. Suggesting elevated focus on this industry.
Radar, J: High shares of 42% & 38% victims among gangs.
Geographic Distribution
The geographic distribution of ransomware victims is relatively high yet quite concentrated in the USA* which accounts for 66% of all victims and warrants high risk.
Notably Canada and Australia also recorded significant increase of victims, suggesting potential pivot from the USA into other markets with high real estate values.
In total, 27 countries recorded ransomware victims in this industry in last 90 days, two less than 29 in previous period.
For a comprehensive, up-to-date global ransomware tracking report, please refer to our new monthly “Tracking Ransomware” series here.
APT Campaigns (Low): Only one APT campaign targeted the sector in the past 90 days (6 percent of observed activity), a decline from the previous period. The campaign occurred in September and blended TTPs associated with Russian cybercrime groups (TA505, FIN7, FIN11) and the state-linked Gamaredon group. Ten countries reported victims, with unusually high representation from Asia. Targeting remained narrow and relied primarily on web-application exploitation.
Underground & Dark Web Chatter (Low): The sector generated just 1.77 percent of all industry chatter, ranking near the bottom. Ransomware-related chatter stayed high overall, peaking in the middle period before settling lower but still elevated due to this sector’s reliance on contractors and fragmented IT estates. Data breach and data leak chatter showed a mild decline, while web-exploit discussions remained steady. Claimed hacks continued to drop, reflecting a shift to quieter monetization models such as access sales. DDoS activity returned to moderate levels after earlier dips, and hacktivist involvement collapsed back to near zero.
Vulnerabilities (Low): Only 1.94 percent of industry-linked CVEs mapped to this sector, reinforcing its low exposure compared to IT-heavy verticals. RCE disclosures dropped sharply to zero in the latest window, likely reflecting timing rather than sustained improvement. Injection flaws declined as well, while DoS, privilege escalation, XSS, and disclosure findings remained low and trended downward. Occasional memory vulnerabilities persisted but showed no systemic pattern.
Ransomware (Moderate*): The sector saw a sharp ransomware escalation, rising to 197 victims (up 77 percent) and reaching 9.8 percent of all global ransomware cases. Monthly trends show clear upward momentum, with December already nearing one-third of the previous peak in its first week. Qilin and Akira drove most activity, each showing an unusually high concentration of victims in this industry. Radar and J displayed even stronger proportional focus, with more than one-third of their total victims coming from real estate and construction. The U.S. accounted for two-thirds of global victims, warranting a high risk. Canada and Australia recorded notable surges, signaling attacker expansion toward other high-value property markets. Twenty-seven countries were affected, slightly fewer than in the prior period.