

The CYFIRMA Industry Report delivers original cybersecurity insights and telemetry-driven statistics of global industries, covering one sector each week for a quarter. This report focuses on the real estate & construction industry, presenting key trends and statistics in an engaging infographic format.
Welcome to the CYFIRMA infographic industry report, where we delve into the external threat landscape of the real estate & construction industry over the past three months. This report provides valuable insights and data-driven statistics, delivering a concise analysis of attack campaigns, phishing telemetry, and ransomware incidents targeting the real estate & construction organizations.
We aim to present an industry-specific overview in a convenient, engaging, and informative format. Leveraging our cutting-edge platform telemetry and the expertise of our analysts, we bring you actionable intelligence to stay ahead in the cybersecurity landscape.
CYFIRMA provides cyber threat intelligence and external threat landscape management platforms, DeCYFIR and DeTCT, which utilize artificial intelligence and machine learning to ingest and process relevant data, complemented by manual CTI research.
For the purpose of these reports, we leverage the following data from our platform. These are data processed by AI and ML automation based on both human research input and automated ingestions.
While this report contains statistics and graphs generated primarily by automation, it undergoes thorough review and enhancement for additional context by CYFIRMA CTI analysts to ensure the highest quality and provide valuable insights.
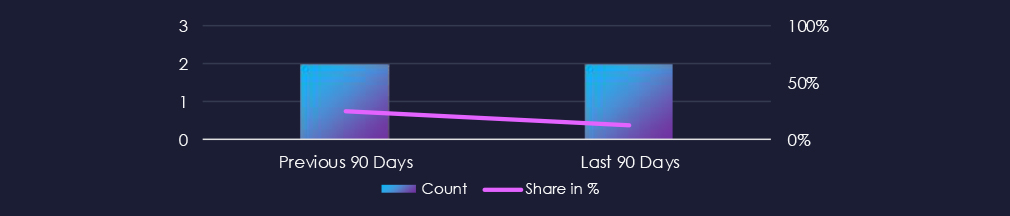
Over the past 90 days, the Real estate & construction industry featured in 2 out of the 16 observed campaigns, which is a presence in 12.5% of all campaigns. That is the same as 2 in the previous 90 days; however, a decline in overall share from 25% (2 out of 8).

The two observed campaigns occurred during May and July.

Suspected threat actors are quite straightforward. One campaign was carried out by Volt Typhoon, and the second by Thai-speaking cybercriminals.
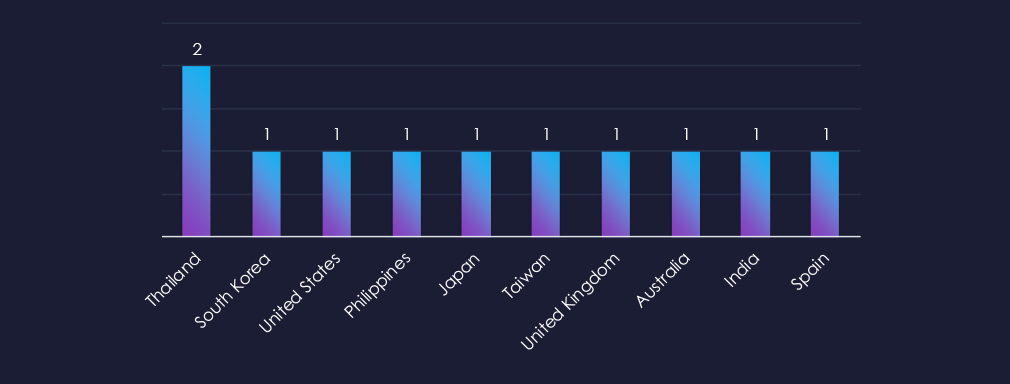
Thailand recorded victims in both of the observed campaigns. The campaign carried out by CCTH2501 recorded victims only in Thailand. The Volt Typhoon campaign targeted victims across continents.
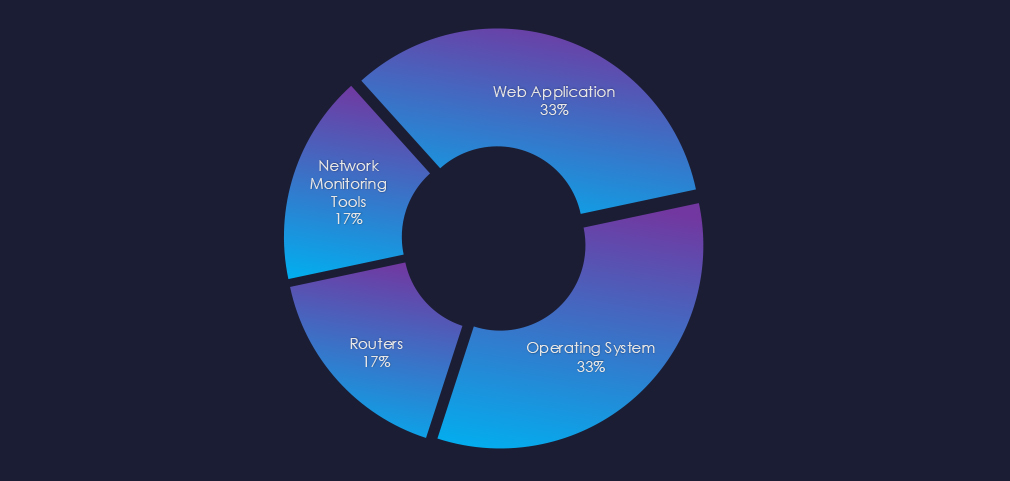
Both campaigns targeted Web Apps and Operating systems. Volt Typhoon also targeted Routers and Network Monitoring Tools.

Over the past 90 days, the real estate & construction industry has not been significantly affected by advanced persistent threat (APT) campaigns.
Out of the 16 observed APT campaigns, only 2 targeted this industry, representing 12.5% of the observed campaigns. This is the same as the previous 90-day period, during which 2 out of 8 campaigns targeted this industry.
Monthly Trends
Observed campaigns occurred during May and July.
Key Threat Actors
Active threat actors were CCTH2501 – Thai-speaking cybercriminals and Chinese Volt Typhoon.
Geographical Impact
Overall, 10 countries recorded victims in observed campaigns. Thailand was the only country with victims in both campaigns and also the only country targeted by CCTH2501.
Targeted Technologies
Both campaigns targeted web applications and operating systems. Volt Typhoon also targeted routers and network monitoring tools.
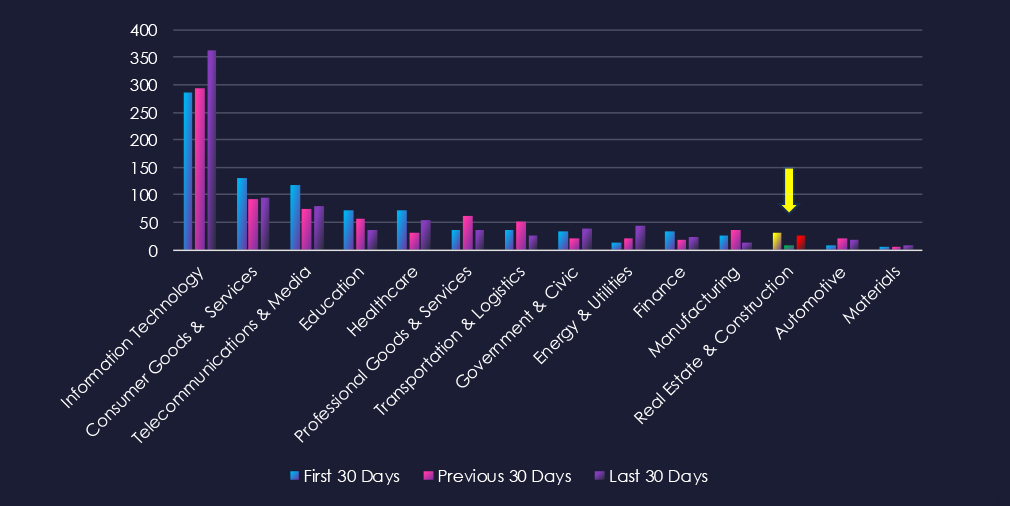
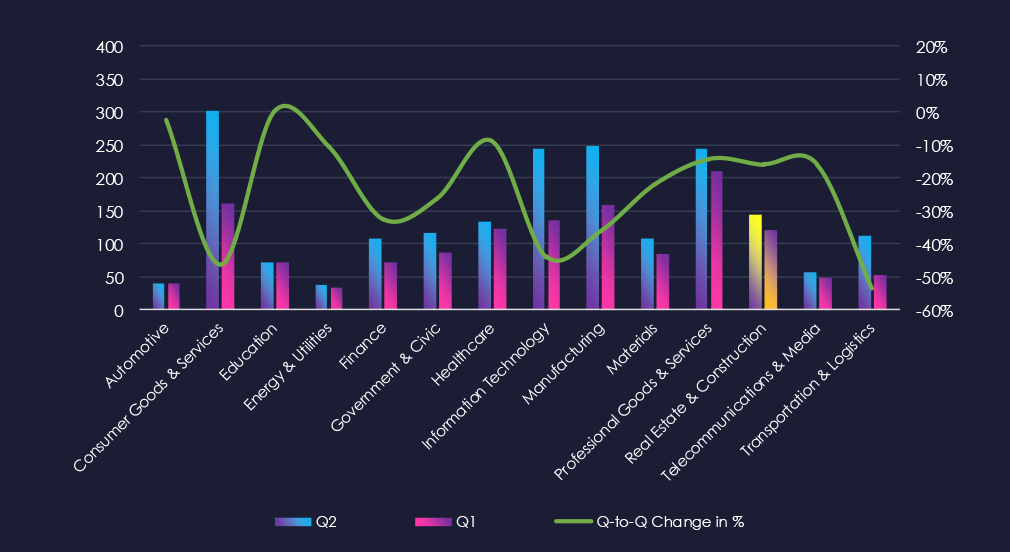
Over the past three months, CYFIRMA’s telemetry has identified 1,176 mentions of the real estate & construction industry out of a total of 63,164 industry mentions. This is from a total of 300k+ posts across various underground and dark web channels and forums.
Real estate & construction industry placed 13th out of 14 industries in the last 90 days with a share of 1.9% of all detected industry-linked chatter.
Below is a breakdown by 30-day periods of all mentions.
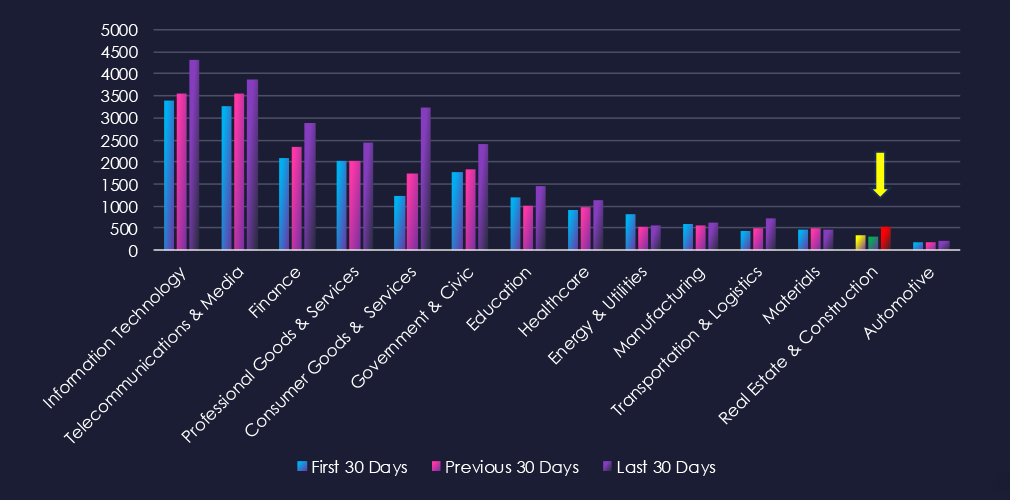
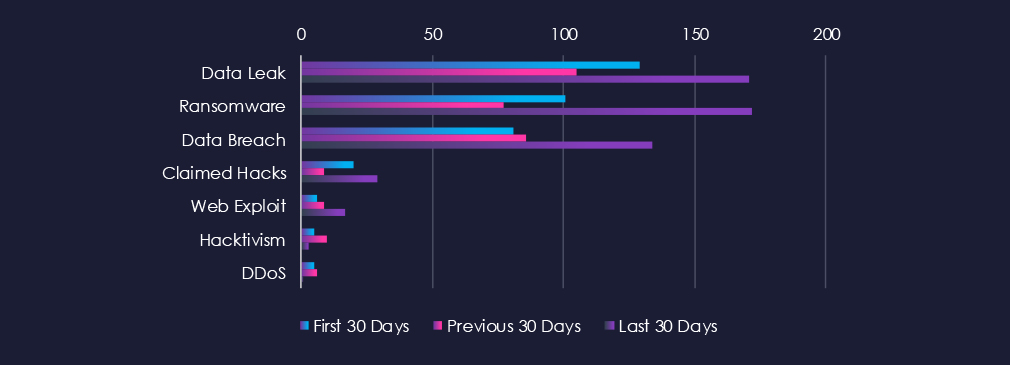
Data Leaks, Ransomware, and Data Breaches are by far the most common category of recorded chatter for this industry. After dipping in the previous 30 days, all three, along with most of the rest, surged during the last 30 days.

In total, the real estate & construction industry comprises 1.9% of all detected industry underground and dark web chatter in the last 90 days, ranking 13th out of 14 industries.
Below are observed key trends across 90 days:
Data Leak
129 → 105 → 171, Strong rebound in the last 30 days, pointing to increased exposure of sensitive records. Likely tied to misconfigured cloud storage, third-party contractor breaches, or document management system compromises.
Ransomware
101 → 77 → 172, Major surge in the most recent period, more than doubling the previous activity. Suggests targeted campaigns against property management platforms, architectural design firms, and construction IT networks.
Data Breach
81 → 86 → 134, Steady growth culminating in a sharp rise. Indicates persistent targeting of corporate networks, email accounts, and project collaboration systems.
Claimed Hacks
20 → 9 → 29, Significant rebound, implying more incidents are being publicized in underground spaces or sold as access packages to other actors.
Web Exploit
6 → 9 → 17, Notable increase, likely tied to exploitation of vulnerable property listing portals, real estate SaaS tools, and public-facing client systems.
Hacktivism
5 → 10 → 3, Drop in ideologically driven campaigns, likely overshadowed by financially motivated targeting.
DDoS
5 → 6 → 1, Activity has nearly vanished, potentially due to attackers prioritizing more targeted and profitable intrusion methods over disruption.
Over the past three months, CYFIRMA’s telemetry has identified 66 mentions of the real estate & construction industry out of a total of 2,555 industry mentions. This is from over 10k CVEs reported and updated in the last 90 days.
Real estate & construction industry ranked 12th out of 14 industries in the last 90 days with a share of 2.6% of all detected industry-linked vulnerabilities.
Below is a breakdown by 30-day periods of all mentions.
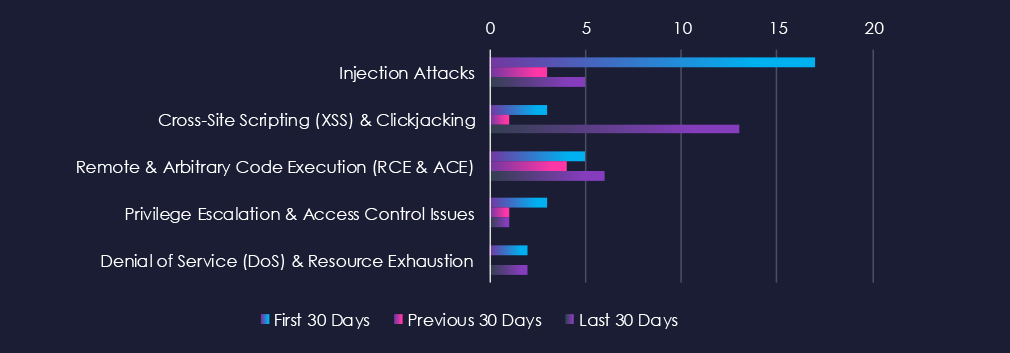
After the spike in the first 30 days, injections’ attacks retained most CVEs but dropped sharply. Conversely, XSS & Clickjacking saw a sharp increase in the last 30 days. RCE & ACE were sustained across the 90-day period.

In total, the real estate & technology industry comprises 2.6% of all detected industry-linked vulnerabilities in the last 90 days, ranking 12th out of 14 industries.
Below are observed key trends across 90 days.
Injection Attacks
17 → 3 → 5, Sharp drop after the first period, with a small rebound in the latest 30 days. Suggests that while patching may have addressed some flaws.
Cross-Site Scripting (XSS) & Clickjacking
3 → 1 → 13, Major spike in the latest period, indicating a wave of newly disclosed or unpatched vulnerabilities in client-facing portals, listing platforms, or partner integrations.
Remote & Arbitrary Code Execution (RCE & ACE)
5 → 4 → 6, Stable but persistent, reflecting ongoing risk from exploitable software components in property management and construction planning tools.
Privilege Escalation & Access Control Issues
3 → 1 → 1, Low but steady, likely related to misconfigured access roles or flaws in authentication modules.
Denial of Service (DoS) & Resource Exhaustion
2 → 0 → 2, Resurfaced after a lull, potentially linked to volumetric attack testing or exploitation of performance bottlenecks in sector-specific platforms.
In the past 90 days, CYFIRMA has identified 121 verified ransomware victims in the real estate & construction industry. This accounts for 8.7% of the overall total of 1,1438 ransomware victims during the same period. Placing the real estate & construction industry 6th out of 14 industries.
Furthermore, a quarterly comparison reveals a mild drop in victims in the real estate & construction industry, with a reduction of -16% from 144 to 121 victims. However, the overall share of victims mildly increased from 7.2% to 8.41% of all victims.
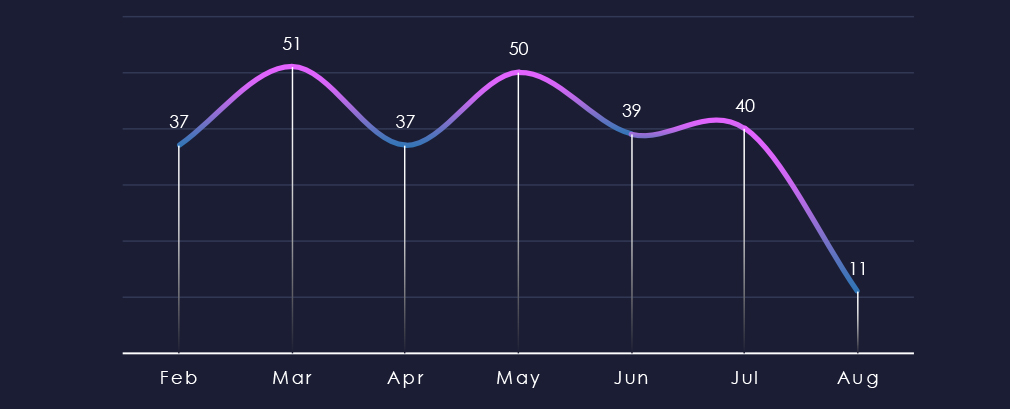
Over the past 180 days, we observed choppy, but sustained numbers of victims across months.
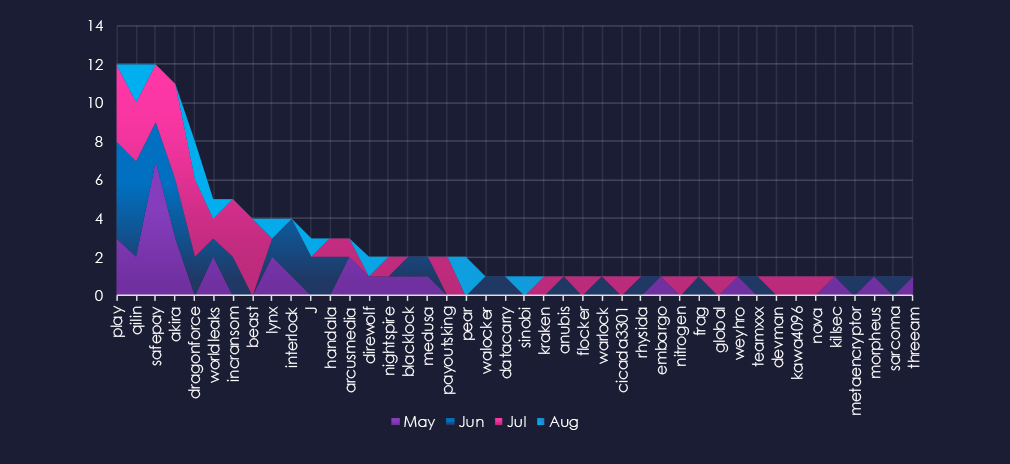
A breakdown of monthly activity per gang provides insights into which gangs were active each month. For example, out of the 3 most active gangs, Play and Qilin were most active during June, whereas Safepay was mostly active in May.
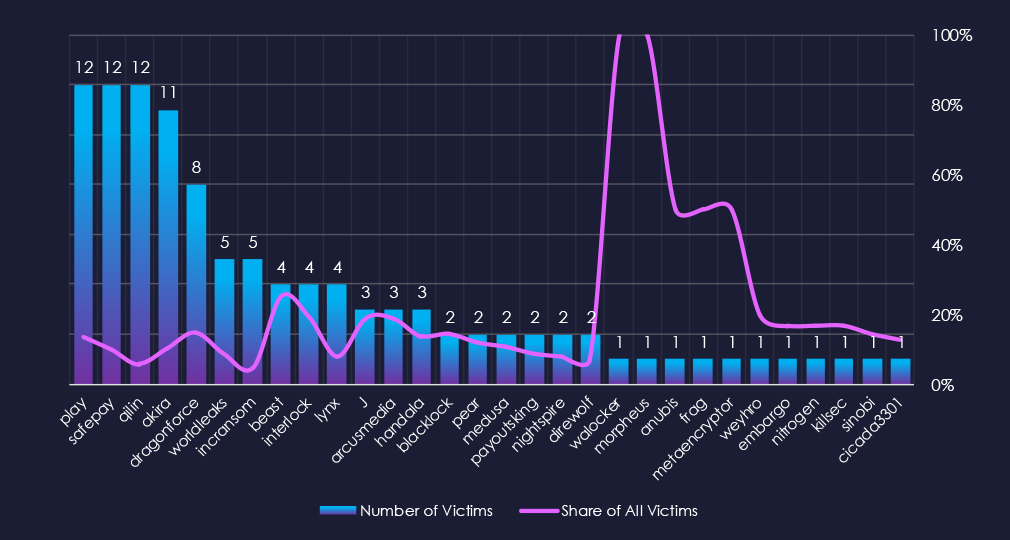
Out of the 72 gangs, 42 recorded victims in this industry in the last 90 days (58% participation). Play, Safepay, and Qilin had the highest number of victims (12) with respective shares 13,6%, 9.8% and 5.7%.
The share of victims for most gangs in this industry is moderate. From the top 10, half of the gangs recorded a share above 10%.
Disregarding gangs with 1 victim, Beast (25%), Interlock (19%), and J and Arcusmedia (both 18.8%) had the highest share of victims, implying a high focus on this industry.
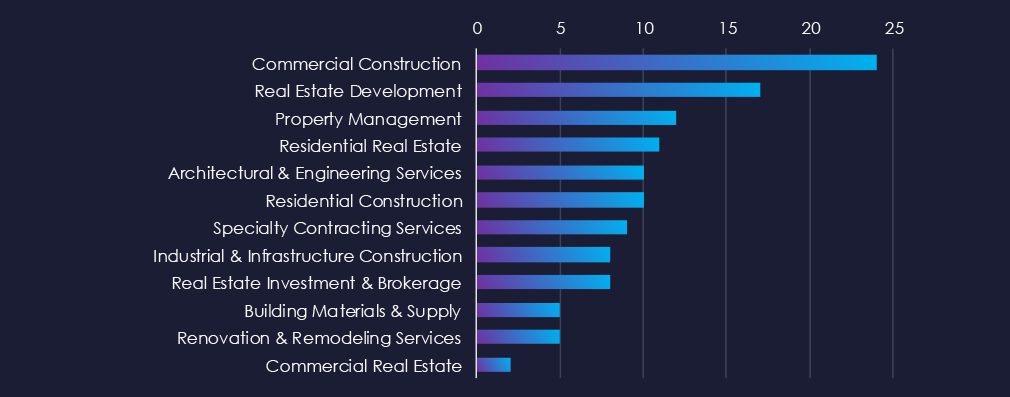
Commercial Construction is leading the chart. Real Estate Developers, Property Management, and Residential Real Estate follow on top.
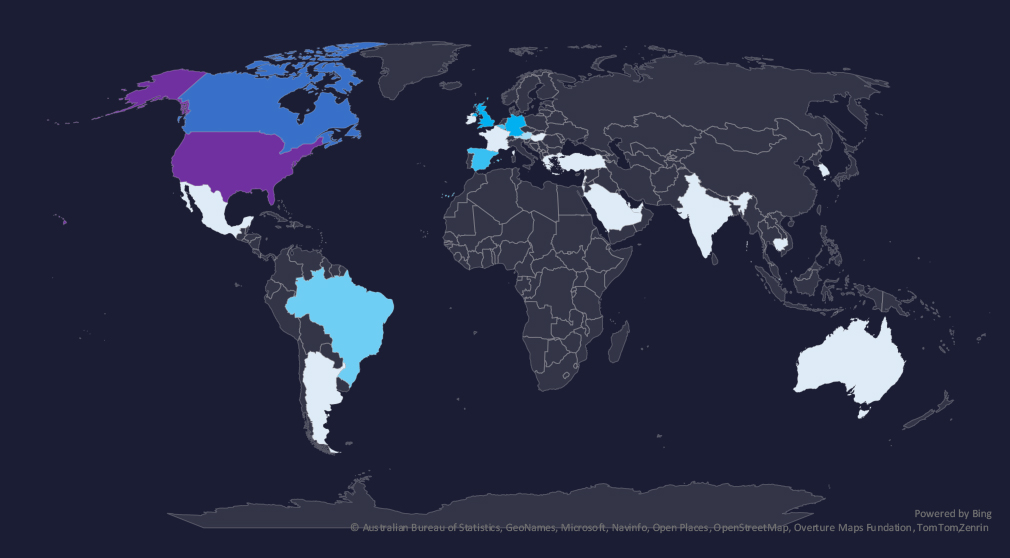
The geographic distribution heatmap underscores the widespread impact of ransomware, highlighting the countries where victims in this industry have been recorded in last 90 days.
The chart shows quarter-to-quarter changes in targeted countries. Data is sorted by the last 90 days and compared to the previous 90 days, marked in blue.
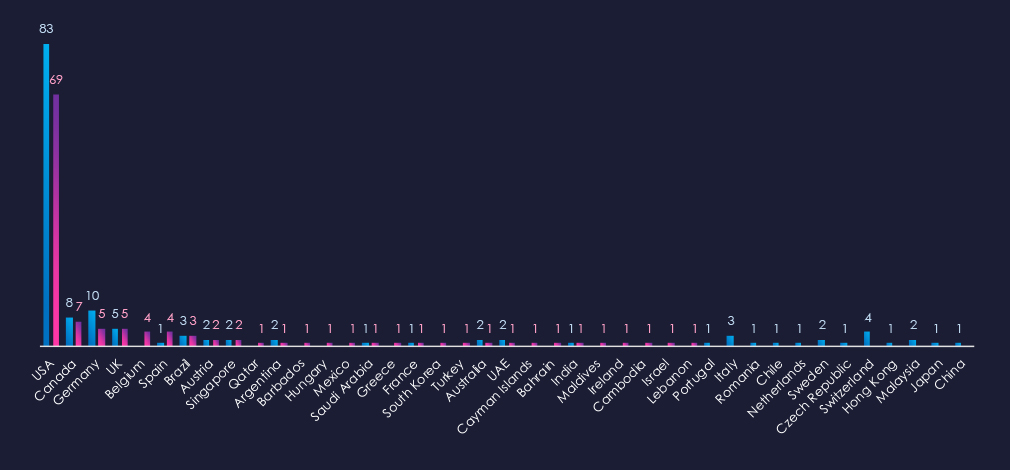
In the last 90 days, the USA recorded 69 victims (57% of all victims). Canada and Germany, with the UK following in second and sharing third place. Germany, Italy, and Switzerland recorded significant drops from the previous 90-day period.
Many countries from the previous 90 days did not record new victims at all.

Real estate & construction industry placed 6th out of 14 monitored industries, recording 121 victims in the last 90 days. Mild decrease of -16% from 144 victims in the previous 90-day period.
Overall, the share, however, mildly increased from 7.2% to 8.4% of all ransomware victims.
Monthly Activity Trends
Monthly activity trends show choppy, yet sustained interest. Then, from May, we saw a more stable number of victims (50,39,40).
Ransomware Gangs
A total of 42 out of 72 active ransomware groups targeted this industry in the past 90 days, representing 58% participation:
Play, Qilin, Safepay: The most active, all with 12 victims and 13.6%, 9.8% and 5.7% of their victims in this industry.
Beast: The eight most active, with 25% (4 out of 16) share.
Interlock, J, Arcusmedial: High shares of ~19% victims among gangs, with a handful of victims. Suggesting a higher focus on this industry.
Geographic Distribution
The geographic distribution of ransomware victims is relatively high yet quite concentrated in the USA* which accounts for 57% of all victims.
Notably, previously hit countries like Germany, Italy, or Switzerland recorded a decline in victims.
In total, 29 countries recorded ransomware victims in this industry in the last 90 days, three more than 26 in the previous period.
For a comprehensive, up-to-date global ransomware tracking report, please refer to our new monthly “Tracking Ransomware” series here.
APT Campaigns (Low): Only 2 of 16 APT campaigns (12.5%) targeted the sector, matching last period’s share. Activity occurred in May and July, led by Thai-speaking CCTH2501 and Chinese Volt Typhoon. Ten countries were affected, with Thailand impacted in both campaigns. Both focused on web applications and operating systems, with Volt Typhoon also targeting routers and network monitoring tools.
Underground & Dark Web Chatter (Low): The sector generated 1.9% of all chatter (13th place). Data leaks rebounded sharply in the last month, ransomware chatter more than doubled, and breaches climbed steadily, suggesting intensified targeting of property management and construction IT systems. Claimed hacks surged, while web exploit chatter rose significantly, likely tied to real estate SaaS and listing portals. Hacktivism and DDoS activity declined sharply, indicating a shift toward profit-driven attacks.
Vulnerabilities (Low): The industry accounted for 2.6% of CVEs (12th place). XSS and clickjacking spiked sharply in the last period, pointing to client-facing portal risks. Injection attacks fell but ticked up recently. RCE remained stable, while privilege escalation and DoS issues were minimal but persistent.
Ransomware (Moderate*): The industry ranked 6th with 121 victims (↓16%), but the share of total victims rose to 8.4%. Activity stabilized after May. Forty-two groups were active, with Play, Qilin, and Safepay each recording 12 victims. Some smaller gangs, like Beast and Interlock, showed disproportionately high focus. The *USA accounted for 57% of victims, with activity spread across 29 countries.