

The CYFIRMA Industriy Report delivers original cybersecurity insights and telemetry-driven statistics of global industries, covering one sector each week for a quarter. This report focuses on the real estate & construction industry, presenting key trends and statistics in an engaging infographic format.
Welcome to the CYFIRMA infographic industry report, where we delve into the external threat landscape of the real estate & construction industry over the past three months. This report provides valuable insights and data-driven statistics, delivering a concise analysis of attack campaigns, phishing telemetry, and ransomware incidents targeting the real estate & construction industry.
We aim to present an industry-specific overview in a convenient, engaging, and informative format. Leveraging our cutting-edge platform telemetry and the expertise of our analysts, we bring you actionable intelligence to stay ahead in the cybersecurity landscape.
CYFIRMA provides cyber threat intelligence and external threat landscape management platforms, DeCYFIR and DeTCT, which utilize artificial intelligence and machine learning to ingest and process relevant data, complemented by manual CTI research.
For the purpose of these reports, we leverage the following data from our platform. These are data processed by AI and ML automation, based on both human research input and automated ingestions.
While this report contains statistics and graphs generated primarily by automation, it undergoes thorough review and enhancement for additional context by CYFIRMA CTI analysts to ensure the highest quality and provide valuable insights.
Real estate & construction organizations featured in 1 out of the 7 observed campaigns, which is a presence in 14% of all campaigns.

A single observed campaign occurred in January 2025. Real Estate & Construction in general is not a frequent target of APT campaigns.

The single observed campaign is attributed to Salt Typhoon – an advanced persistent threat (APT) actor operated by China’s Ministry of State Security (MSS). This threat actor has conducted high-profile cyber espionage campaigns, with a focus on counterintelligence and data theft of key corporate intellectual property. The group has infiltrated targets in dozens of countries across nearly every continent.
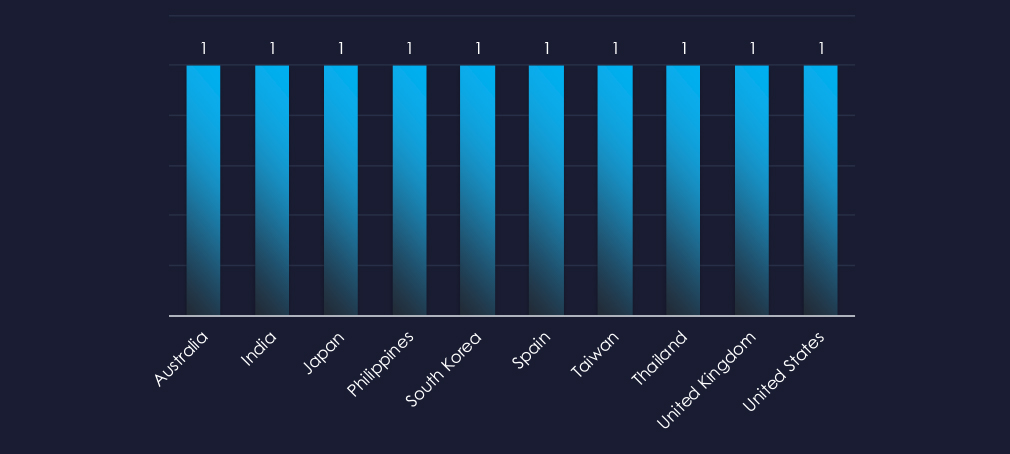
The recorded victims of the observed campaign span 10 countries. Listed countries mostly align with known strategic interests of Chinese government.
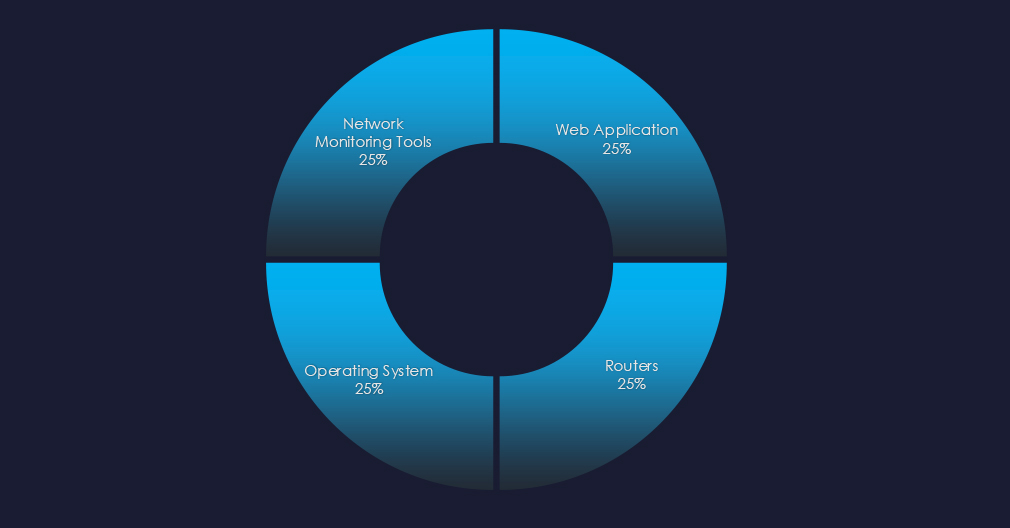
The observed campaign utilized the exploitation of multiple vectors.
Risk Level Indicator: Low

In the past 90 days, real estate & construction organizations have been only mildly impacted by advanced persistent threat (APT) campaigns. 14% of observed APT campaigns recorded real estate & construction industry victims, with 1 out of 7 total campaigns.
Monthly Trends
A single observed campaign occurred in January 2025. Real Estate & Construction in general is not a frequent target of APT campaigns.
Key Threat Actors
The real estate & construction industry is mostly highly fragmented and localized and generally does not have significant strategic value for nation states. As such it attracts mostly financially motivated cybercrime.
However, the observed campaign is linked to the Chinese Ministry of State Security (MSS), suggesting that the MSS was possibly looking for information about the real estate of its own citizens abroad.
Geographical Impact
The campaign has affected a total of 10 countries, mostly aligned with the strategic interests of the Chinese government.
Targeted Technologies
Four different vectors were utilized in this campaign – Web Applications, Operating Systems, Routers, and Network Monitors Tools.
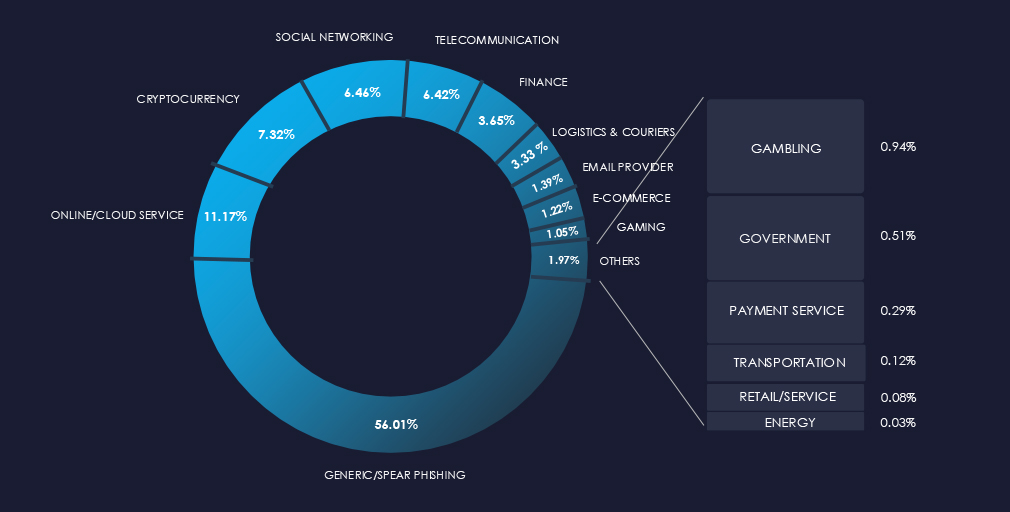
Over the past 3 months, CYFIRMA’s telemetry detected 2 instances of related phishing campaigns themed around real estate & construction out of a total of 218,061.
The chart below illustrates the global distribution of observed themes. Due to very low counts of real estate & construction-related phishing, we do not track it as a category.
Risk Level Indicator: Low

CYFIRMA telemetry identified only two genuine impersonations of real estate and construction entities, both of which are associated with US-based casino properties.
However, this does not imply that these impersonations do not appear more frequently. They are certainly employed in spear-phishing campaigns when appropriate.
The highly localized and fragmented nature of the real estate and construction industry does not present an ideal target for widespread “spray and pray” campaigns. Furthermore, monetization for local cybercrime is more intricate than for more prevalent scams such as typical banking or courier and delivery themes.
In the past 90 days, CYFIRMA has identified 125 verified ransomware victims in the real estate & construction industry. This accounts for 7.6% of the overall total of 1,646 ransomware victims during the same period, placing the real estate & construction industry as the 6th most frequent victim of ransomware.
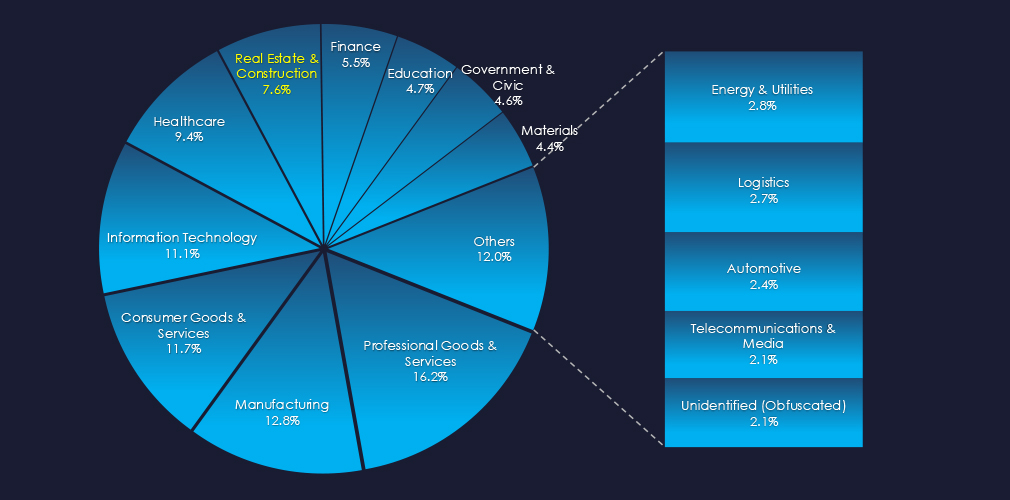
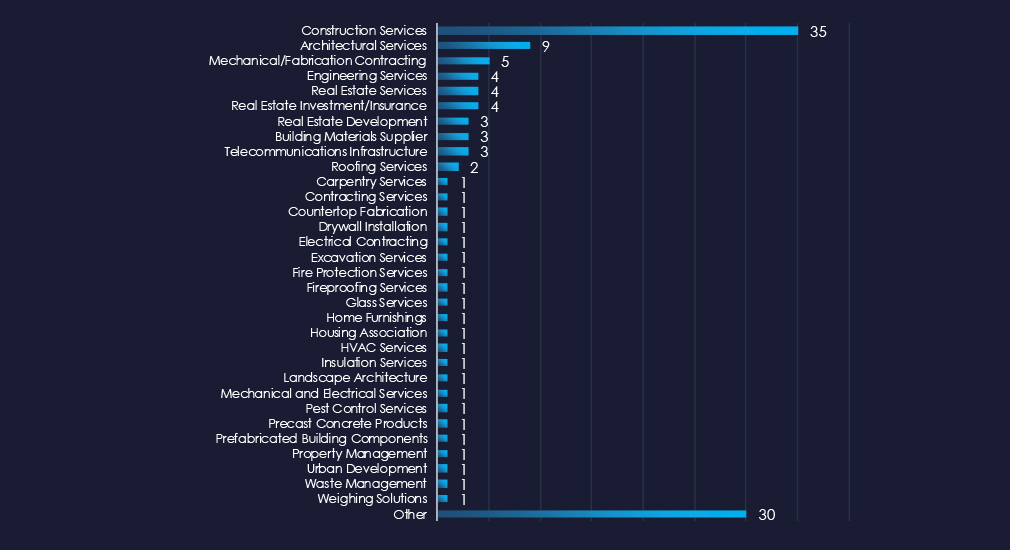
Construction Services and various contracting and sub-contracting services are the most frequent ransomware victims in this industry.
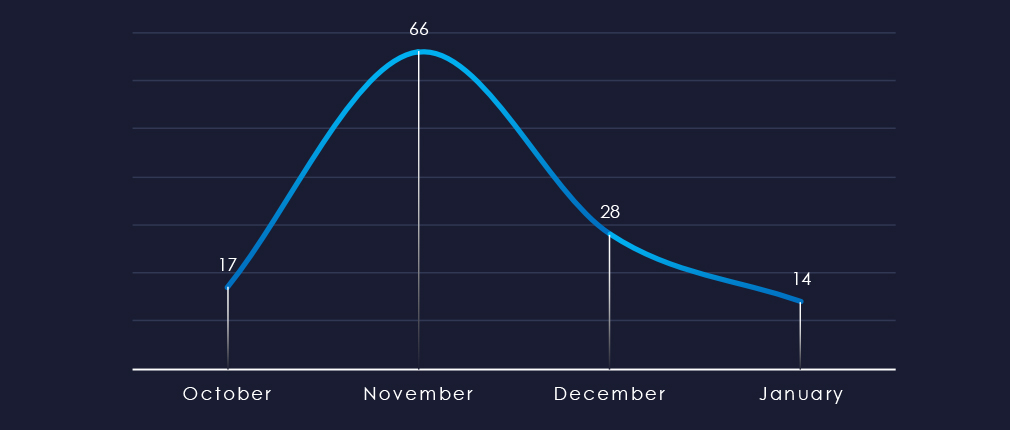
Over the past 90 days, we’ve observed a significant peak in activity during November. Even adjusted for nearly evenly split months of October and January, the spike stands out. Post-November lull inactivity is at least partially due to even cybercriminals observing the holiday season, rather than the downward trend of ransomware in general.
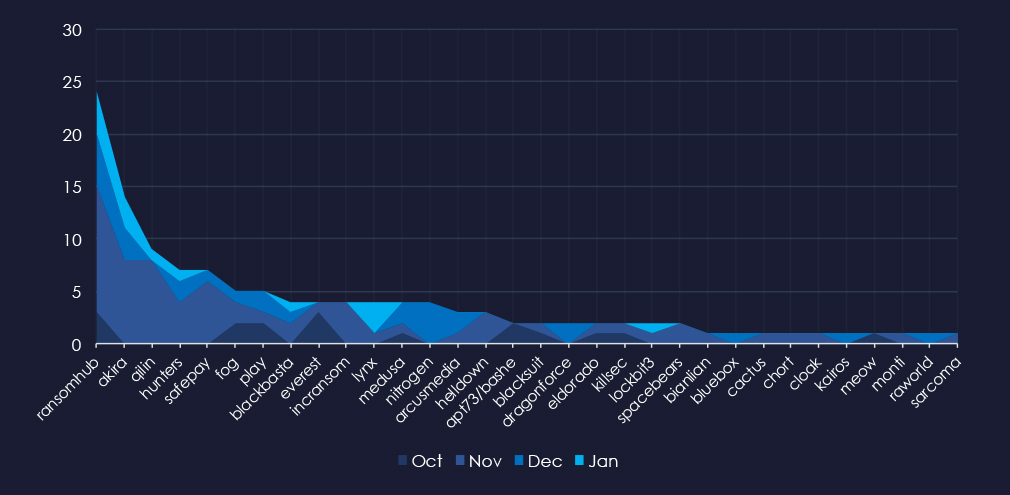
All 32 gangs’ breakdown of the monthly activity provides insights into which gangs were active each month. For example, RansomHub was active across months with most victims in November, while Nitrogen was active only in December.
In total 32 out of 61 active groups recorded real estate & construction organizations victims in the past 90 days. Notable is the relatively high distribution among many groups in this period.
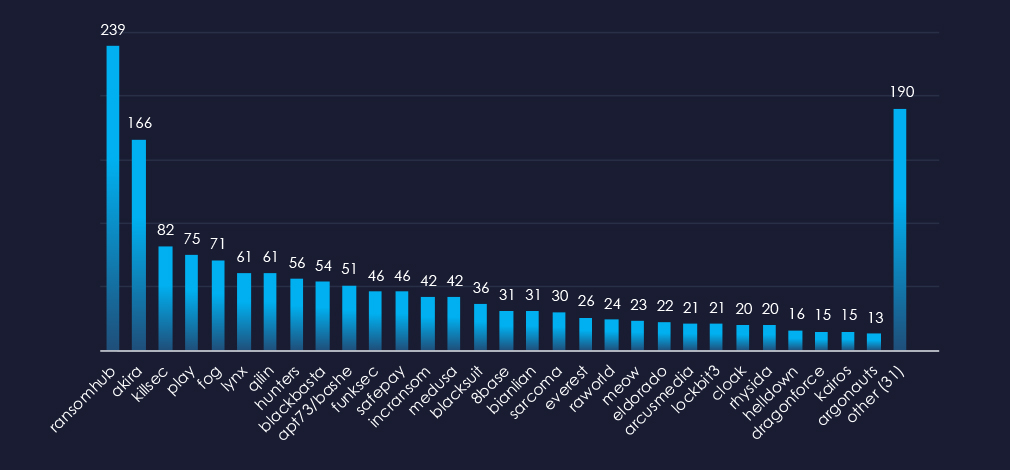
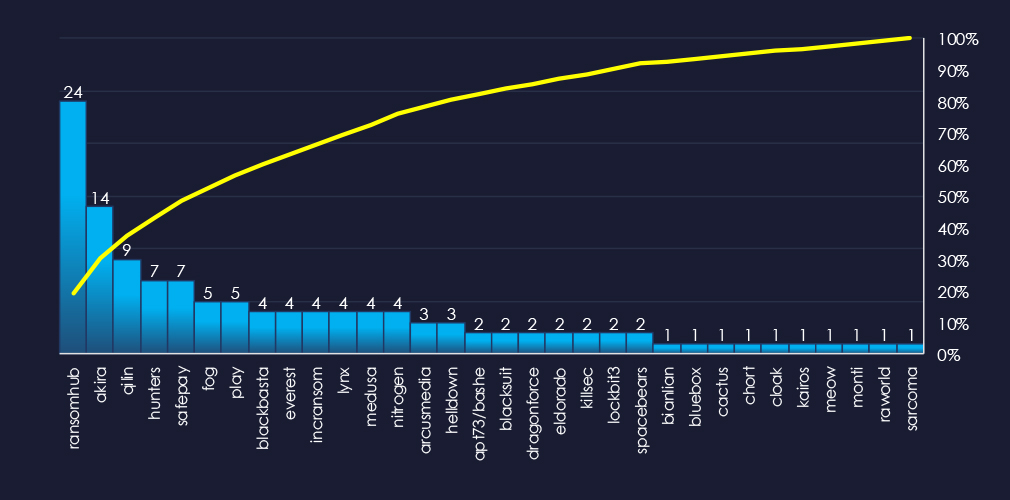
When comparing the real estate & construction industry to all recorded victims, RansomHub emerges with the highest number of victims overall and a significant share of 10% of victims (24 out of 239). Qilin and Safeplay show the highest targeting of this industry, with 15% (9 out of 61, 7 out of 47) of their victims respectively.
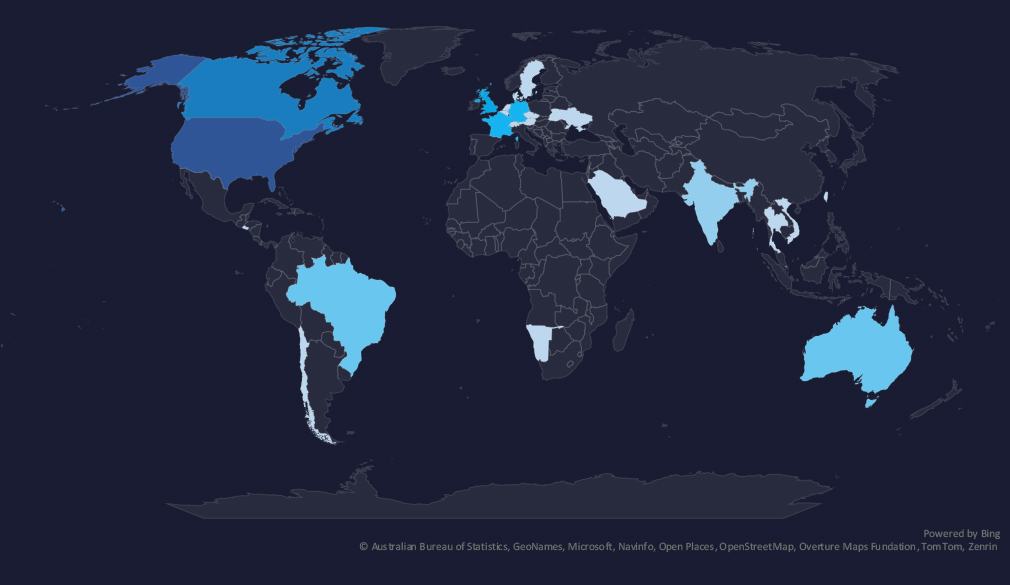
The geographic distribution heatmap underscores the widespread impact of ransomware, highlighting the countries where victims in this industry have been recorded.
In total 40 countries recorded ransomware victims with the US alone accounting for 62% of all victims with identified geography.
Risk Level Indicator: Moderate

The real estate & construction industry is placed as the 6th most frequent victim. It faced a varied ransomware threat, with attacks affecting mostly the US and spiking during November.
Monthly Activity Trends
Ransomware activity in the real estate & construction industry was mixed. Even with evenly split months of October and January, the November spike stands out. The post-November lull in activity may be partly due to cybercriminals observing the holiday season, rather than the general decline in ransomware.
Ransomware Gangs
A total of 32 out of 61 active ransomware groups targeted the real estate & construction industry in the past 90 days:
RansomHub: Recorded the most victims (24 out of 239 victims), mostly due to the sheer volume, but they also show significant focus on this industry with a 10% share of victims.
Qilin and Safeplay: The highest share of their victims were from this industry with 15% (9 out of 61 victims, 7 out of 47).
Geographic Distribution
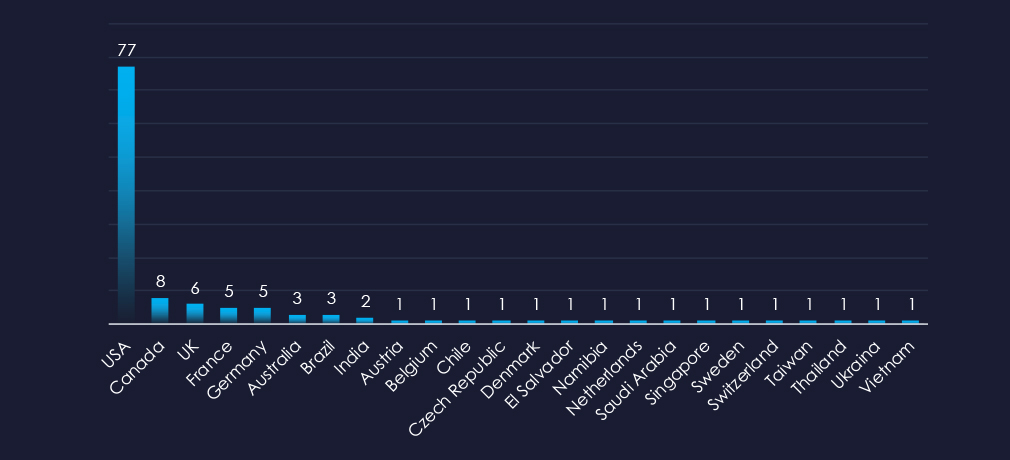
The geographic distribution of ransomware victims in the real estate & construction industry reflects the US as the largest real estate market and industry.
61% of all victims with identified geography are located in the US.
After the US, Canada, the UK, France, and Germany recorded the most victims. This also correlates with large real estate markets and industries.
In total, 24 countries recorded ransomware victims in the real estate & construction industry.
For a comprehensive, up-to-date global ransomware tracking report, please refer to our new monthly “Tracking Ransomware” series here.
Over the past 90 days, Real Estate & Construction organizations faced low to moderate cyber risks across monitored categories.
APT Campaigns (Low): Only 14% of observed campaigns (1 out of 7) targeted the sector, occurring in January 2025. While generally not a common APT focus, the detected campaign was linked to China’s Ministry of State Security (MSS), likely seeking information on citizens’ real estate holdings abroad. Ten countries were impacted, aligning with Chinese strategic interests. Attacks exploited web applications, operating systems, routers, and network monitoring tools.
Phishing (Low): Only two genuine impersonations—both tied to U.S.-based casino properties—were identified. Due to the industry’s localized nature and complex monetization pathways, large-scale “spray and pray” phishing campaigns are uncommon, though spear-phishing can occur for targeted attacks.
Ransomware (Moderate): Ranked 6th in victim frequency, the sector saw varied activity with a notable spike in November. Of 61 active ransomware groups, 32 targeted Real Estate & Construction. RansomHub recorded the most victims (24 out of 239), while Qilin and Safeplay each had 15% of their victims in this sector. The U.S. led with 61% of identified victims, followed by Canada, the U.K., France, and Germany, altogether spanning 24 countries.