

The CYFIRMA Industry Report delivers original cybersecurity insights and telemetry-driven statistics of global industries, covering one sector each week for a quarter. This report focuses on the professional goods & services industry, presenting key trends and statistics in an engaging infographic format.
Welcome to the CYFIRMA infographic industry report, where we delve into the external threat landscape of the professional goods & services industry over the past three months. This report provides valuable insights and data-driven statistics, delivering a concise analysis of attack campaigns, phishing telemetry, and ransomware incidents targeting the professional goods & services organizations.
We aim to present an industry-specific overview in a convenient, engaging, and informative format. Leveraging our cutting-edge platform telemetry and the expertise of our analysts, we bring you actionable intelligence to stay ahead in the cybersecurity landscape.
CYFIRMA provides cyber threat intelligence and external threat landscape management platforms, DeCYFIR and DeTCT, which utilize artificial intelligence and machine learning to ingest and process relevant data, complemented by manual CTI research.
For the purpose of these reports, we leverage the following data from our platform. These are data processed by AI and ML automation based on both human research input and automated ingestions.
While this report contains statistics and graphs generated primarily by automation, it undergoes thorough review and enhancement for additional context by CYFIRMA CTI analysts to ensure the highest quality and provide valuable insights.
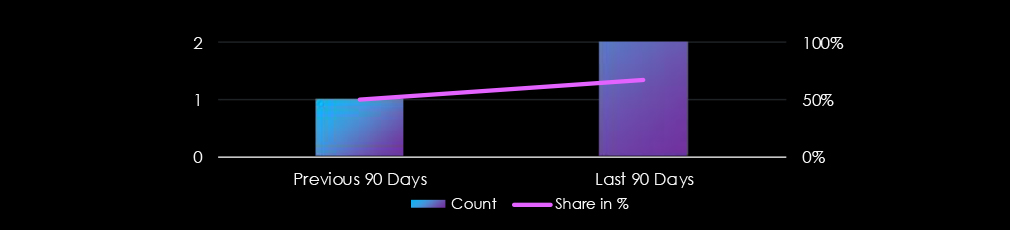
Professional goods & services industry did feature in 6 out of the 9 observed campaigns, which is a presence in 67% of all campaigns, an increase from the previous period (1 out of 2, 50%) in both volume and overall share.

Observed campaigns were distributed across months of the last 90-day period, spiking in May.
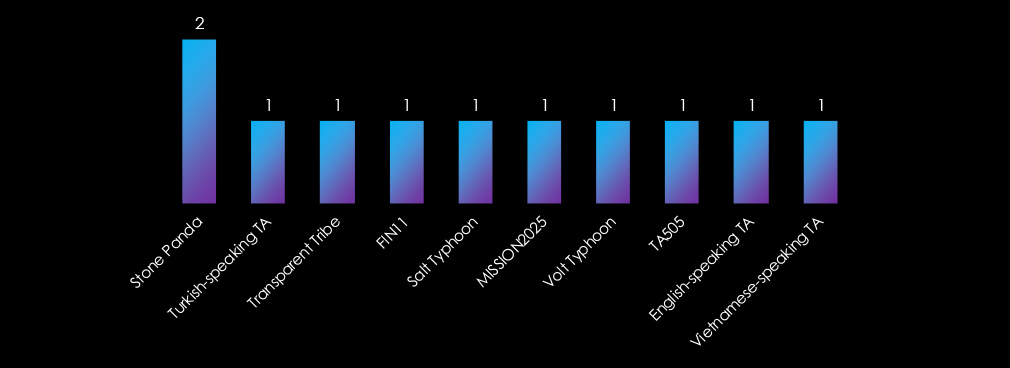
Apart from the usual Chinese (Panda, Typhoon) and Russian (TA505, FIN11) threat actors, we have observed yet unattributed Turkish, Vietnamese, and English-speaking groups. Further, we have observed the Pakistani Transparent Tribe.
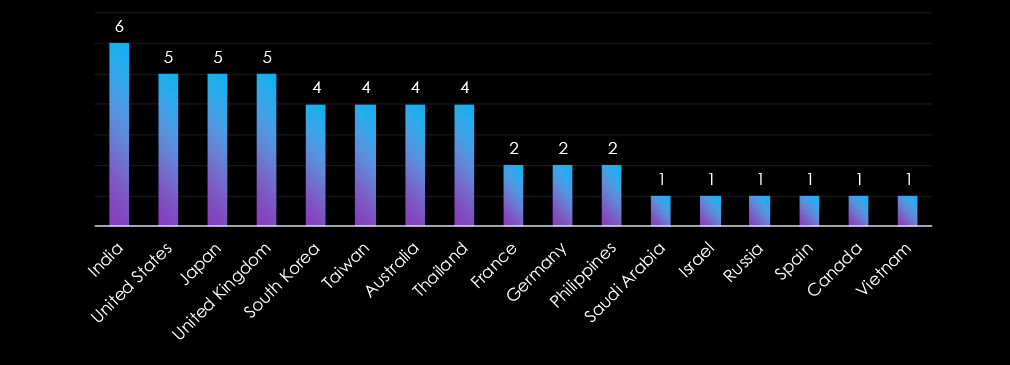
Only India was featured in all six campaigns. The US, Japan, and the UK were present in five campaigns. Targeted geographies, apart from Latin America and Africa, are spread around the globe, highlighting the diverse origins of threat actors, each with distinct objectives and targets.
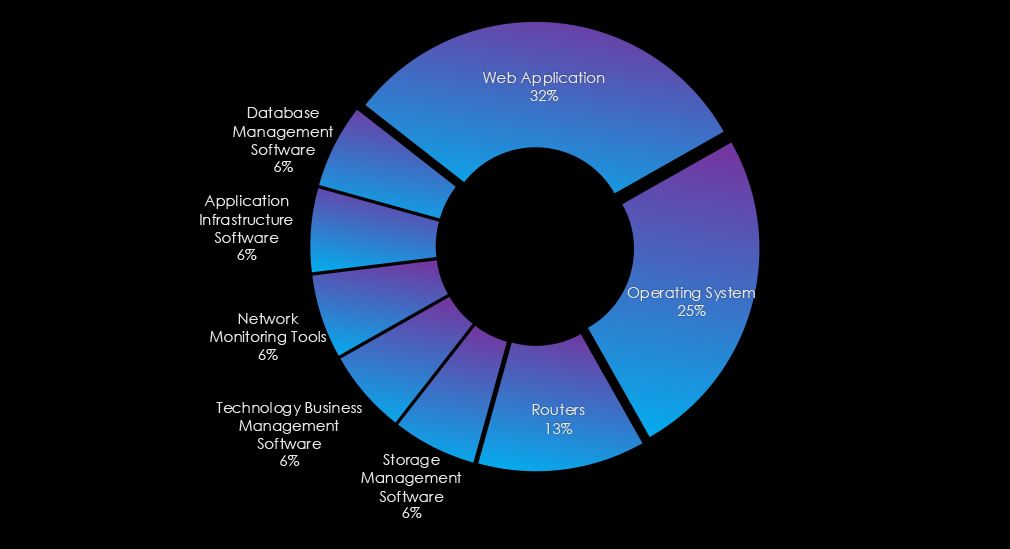
Web applications were targeted in most campaigns, and operating systems and routers were also exploited in multiple campaigns.

In the past 90 days, the professional goods & services industry has been significantly affected by advanced persistent threat (APT) campaigns. 6 out of 9 observed APT campaigns targeted this industry, representing a 67% presence.
This is more than the previous 90-day period, when 1 out of 2 campaigns targeted this industry, also an increase from the overall share of 50%.
Monthly Trends
The observed campaigns occurred across months of the last 90-day period, suggesting a sustained interest and peaked in May.
Key Threat Actors
The campaigns did feature the usual Chinese (Stone Panda, Volt and Salt Typhoon) or Russian (TA505, FIN11) threat actors. We have also observed Pakistani, Vietnamese and Turkish groups behind the observed campaigns.
Geographical Impact
The campaigns have affected a total of 17 countries. India recorded victims in all 6 campaigns, The US, the UK, and Japan featured in 5 campaigns. Further geographies are spread around the globe in line with diverse threat actors, each with very different objectives and targets.
Targeted Technologies
Web applications were targeted in most campaigns. Then, operating systems and routers were attacked frequently. Further, various management software, network monitoring tool, and app infrastructure were compromised.
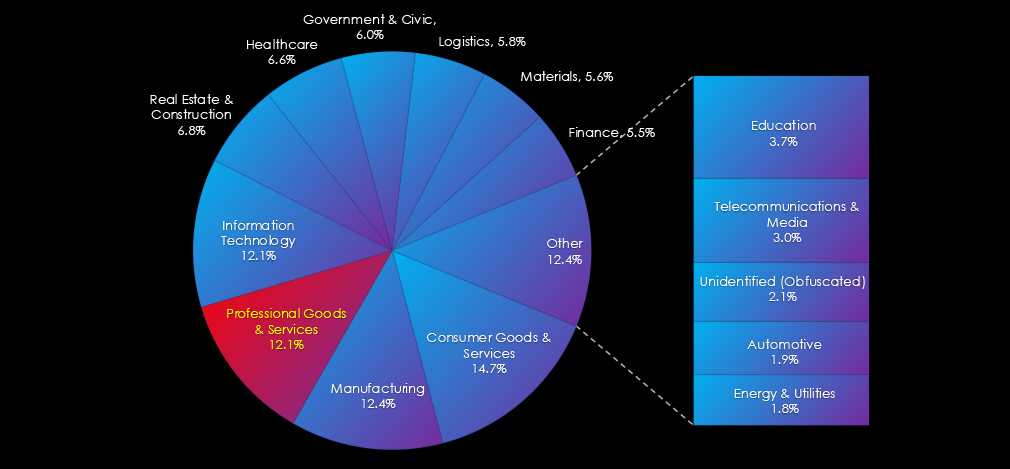
Over the past three months, CYFIRMA’s telemetry has identified 7,283 mentions of professional goods & services industry out of a total of 66,333 industry mentions. This is from total of 311,721 posts across various underground and dark web channels and forums.
Professional goods & services industry placed 4th out of 14 industries in the last 90 days with share of 10.98% of all detected industry-linked chatter.
Below is a breakdown of a 30-day period of all mentions.
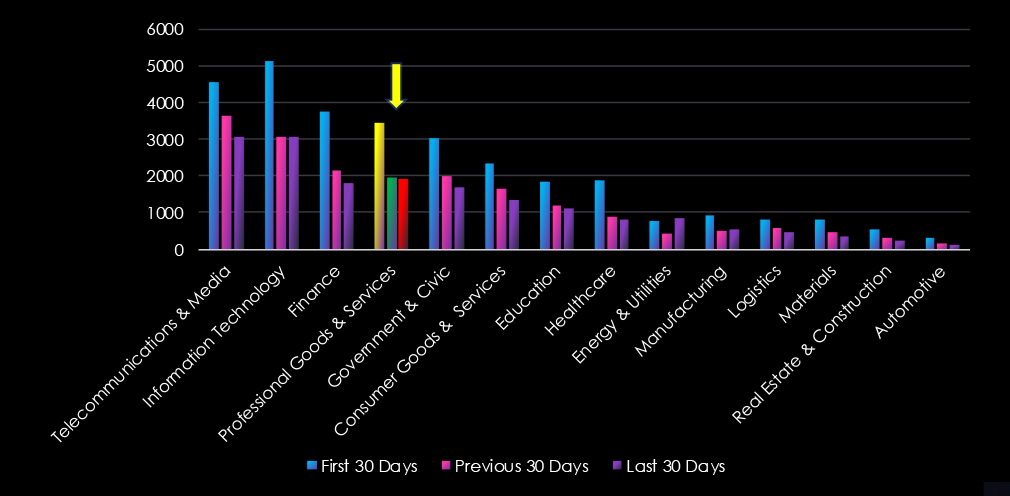
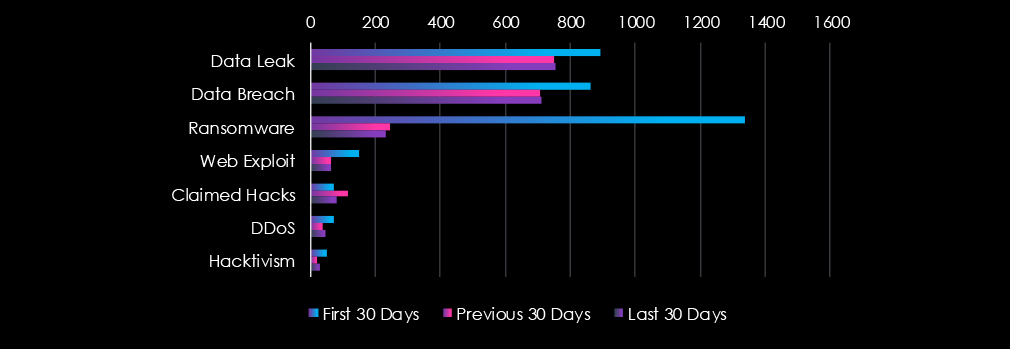
Data Leaks and Data Breaches are the most common category of recorded chatter for this industry. Ransomware chatter was very high in the first 30 days and declined sharply during the last 60 days.

In total, the professional goods & services industry comprises 10.98% of all detected industry underground and dark web chatter in the last 90 days, ranking 4th out of 14 industries.
Below are observed key trends across 90 days:
Sharp Drop in Ransomware Activity
1337 → 246 → 231 (↓83% from initial spike)
After an extremely high initial wave, ransomware chatter has significantly decreased but remains active.
Data Breach & Leak Levels Stabilizing
Data Leak: 893 → 751 → 753
Data Breach: 860 → 708 → 710
Suggests consistent targeting or exposure of sensitive business/client data, despite initial drop from peak.
Web Exploit Activity Significantly Reduced
149 → 63 → 62
A sustained drop indicates fewer active exploit attempts or successful mitigation efforts.
Claimed Hacks Remain Elevated
71 → 115 → 80
Still above baseline, reflecting ongoing underground bragging, extortion, or sales of breached data.
DDoS & Hacktivism Showing Mild Resurgence
DDoS: 72 → 38 → 45
Hacktivism: 51 → 20 → 28
While reduced from early highs, both show signs of renewed activity, potentially event- or politically-driven.
Over the past three months, CYFIRMA’s telemetry has identified 215 mentions of the professional goods & services industry out of a total of 3,181 industry mentions. This is from total of 11,138 CVE reported in 90 days.
Professional goods & services industry ranked 6th out of 14 industries in the last 90 days with a share of 6.76% of all detected industry- linked vulnerabilities.
Below is a breakdown by 30-day periods of all mentions.
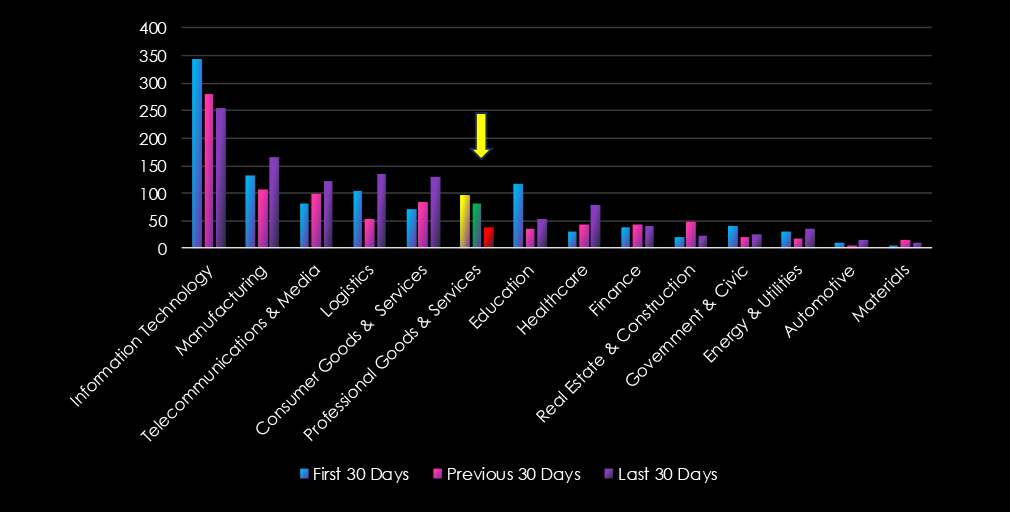
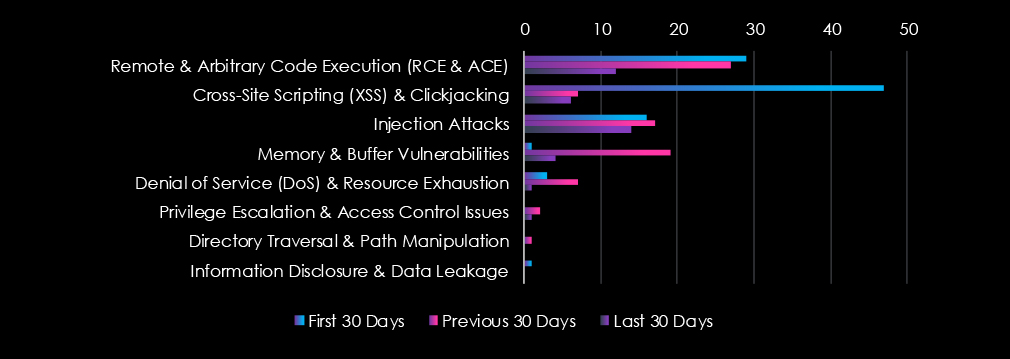
Arbitrary Code Execution (RCE, ACE) is leading the chart. Cross-Site Scripting (XSS) & Clickjacking are in second place, however dropped sharply after first 30 days.

In total, professional goods & services comprise of 6.76% of all detected industry-linked vulnerabilities in the last 90 days, ranking 6th out of 14 industries.
Below are the observed key trends across 90 days.
Steep Drop in Critical Exploits (RCE)
29 → 27 → 12 (↓59% since Jan)
Still present but decreasing—could indicate effective patching or fewer new exposures.
XSS & Clickjacking Spiked Then Crashed
47 → 7 → 6
Huge early risk likely mitigated—now at low levels, but not fully gone.
Injection Attacks Stay Steady
16 → 17 → 14
Persistent across all periods, showing continued relevance for attackers exploiting user input in business applications.
Memory Vulnerabilities Fluctuate
1 → 19 → 4
February spike suggests a burst of disclosures or focus on backend systems, but now tapering off.
Other CVEs Are Minimal
DoS, Privilege Escalation, Directory Traversal, and Information Disclosure remain very low across all periods—these are either well-controlled or currently under less scrutiny.
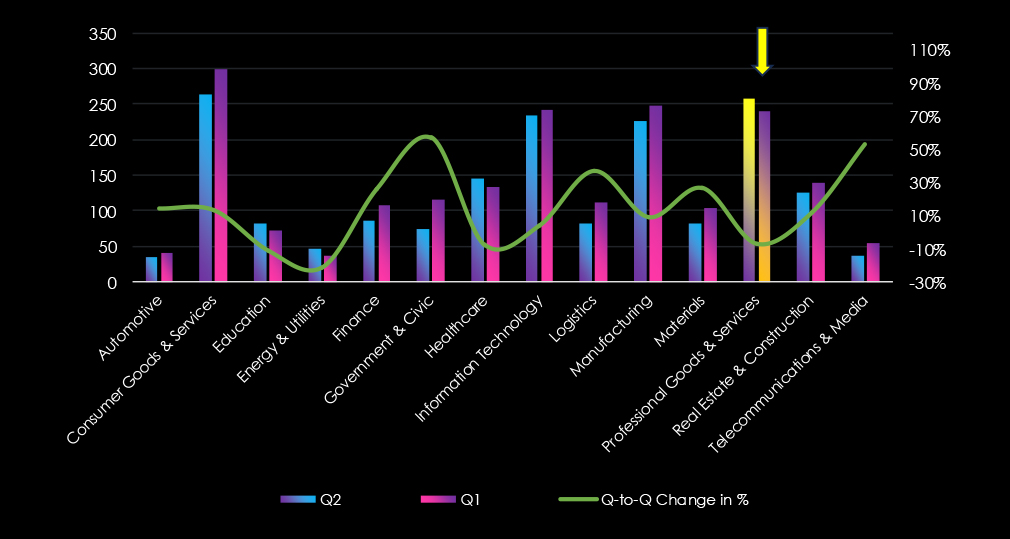
In the past 90 days, CYFIRMA has identified 229 verified ransomware victims in professional goods & services industry. This accounts for 12.1% of the overall total of 1,889 ransomware victims during the same period. Placing professional goods & services industry 3rd out of 14 industries.
Furthermore, a quarterly comparison reveals a minor decrease of interest in professional goods & services industry of -2.1% from 234 to 229 victims. The overall share decreased from 13.4% to 12.1% of all victims.
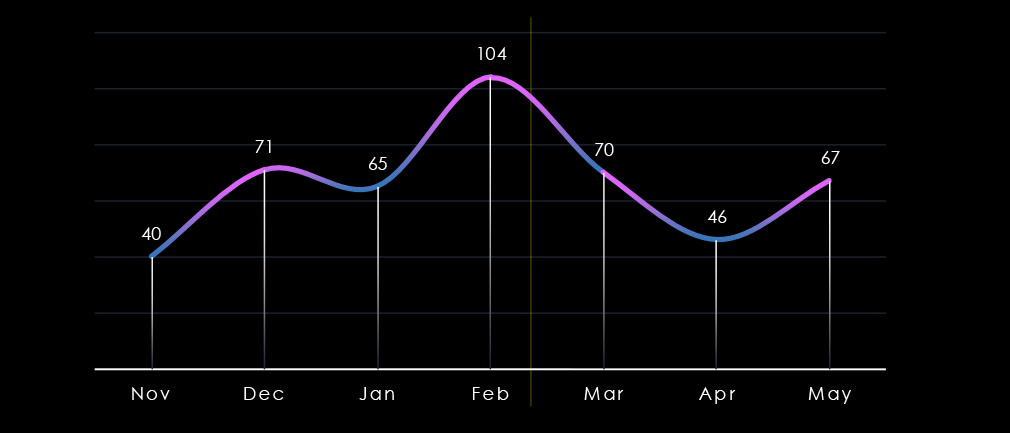
Over the past 180 days, we have observed sustained activity across months with massive spike during and around February. This was driven by Cl0p ransomware rampage. Later in May we have recorded another spike caused by SilentRansomGroup.
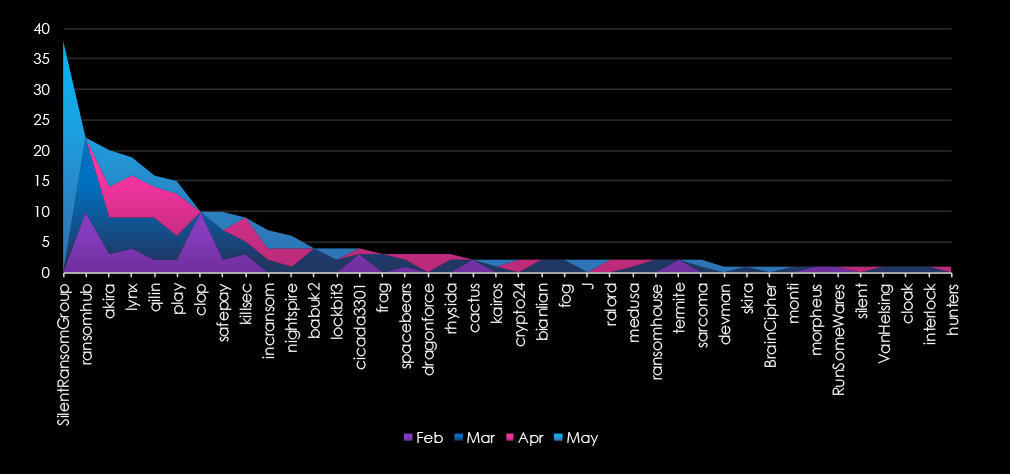
A breakdown of monthly activity per top 30 gangs provides insights into which gangs were active each month. For example, the most active gang SilentRansomGroup was behind the May spike. Whereas RansomHub and Cl0p were behind the larger February spike.
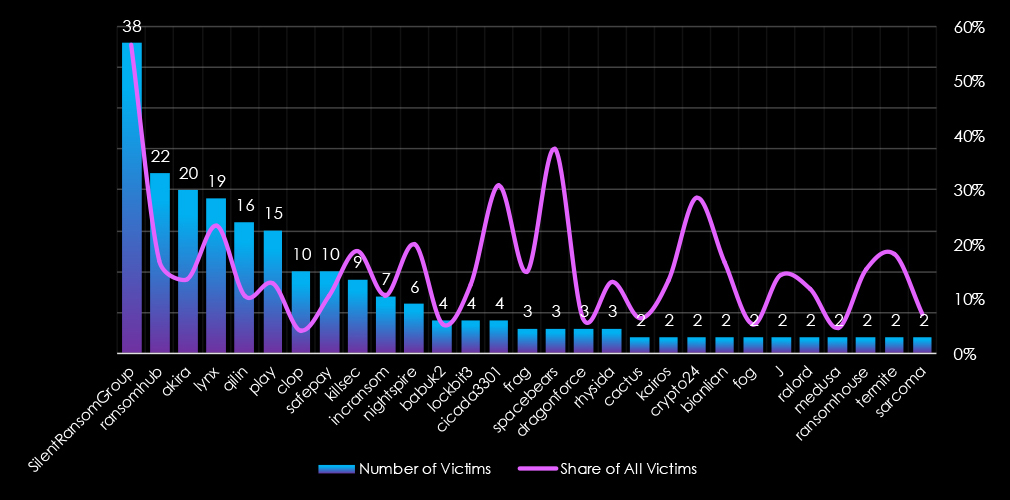
Out of the 74 gangs, 40 recorded victims in this sector in the last 90 days (54% participation). SilentRansomGroup had the highest number of victims (38), followed by RansomHub (22) and Akira (20).
The share of victims for many gangs in this industry is relatively high. All but one of the top 10 gangs recorded 10% or more of the victims in this industry.
Among the top 5 gangs, SilentRansomGroup (57%), RansomHub (17%) Lynx (24%) and Akira (14%) recorded high shares in this industry, suggesting focus on professional goods & services businesses. Particularly the SRG rampage disproportionately hit this industry.
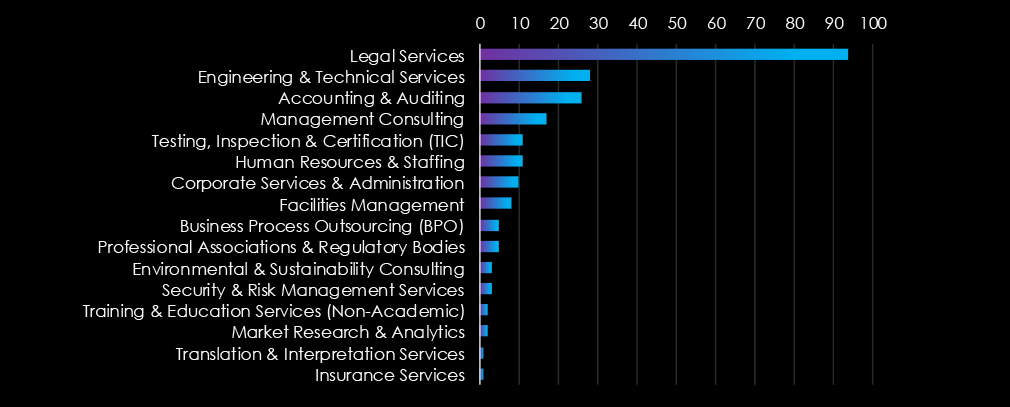
Legal firms and services were disproportionately hit by the SilentRansomGroup and are by far the most frequent victims of ransomware in this industry in the past 90 days.
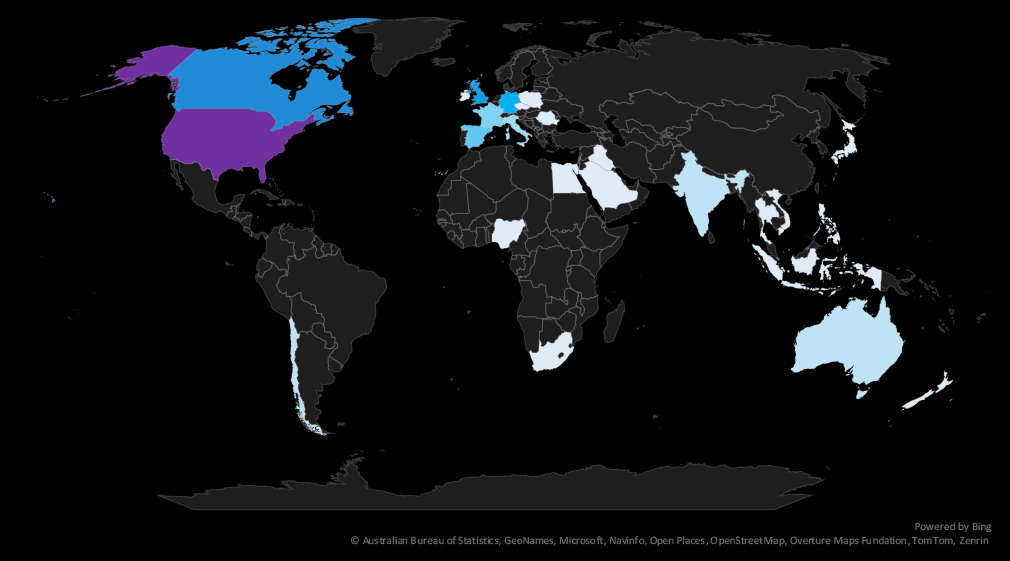
The geographic distribution heatmap underscores the widespread impact of ransomware, highlighting the countries where victims in this industry have been recorded.
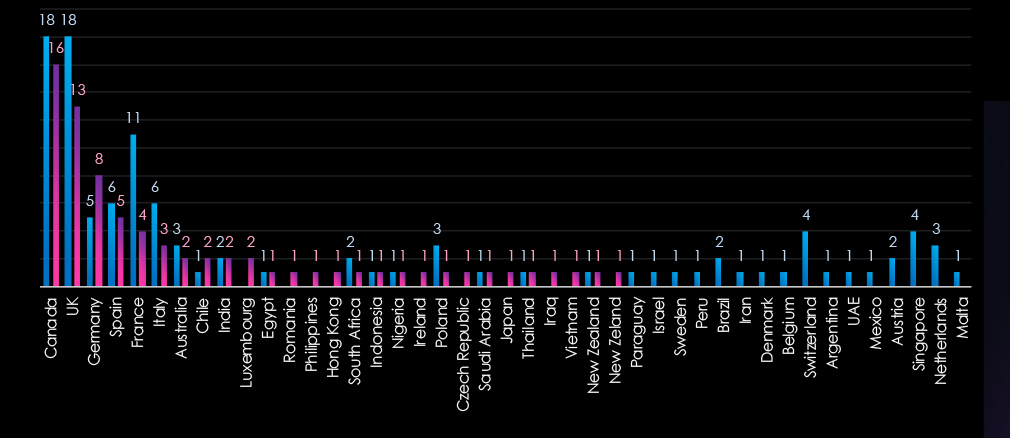
The chart shows quarter-to-quarter changes in the targeted countries. Data is sorted by the last 90 days and compared to the previous 90 days marked in blue. The USA is omitted from the chart as it skews the scale drastically.
The USA recorded 153 victims in the last 90 days, an increase from 127, and represents 67% of all victims. Canada, the UK, Germany, and Spain follow.

The Professional Goods & Services industry placed 3rd out of the 14 monitored industries, recording 229 victims in the last 90 days, a minor decrease of -2.1% from 234 victims in the previous 90-day period.
The overall share fell from 13.4% to 12.1% of all ransomware victims.
Monthly Activity Trends
Monthly activity was sustained across the last 180 days, with a massive spike in February and another during May.
Clop and RansomHub were behind the February spike and May rampage of SilentRansomGroup disproportionately hit this industry, mainly legal services.
Ransomware Gangs
A total of 40 out of 74 active ransomware groups targeted this industry in the past 90 days – 54% participation:
SilentRansomGroup: The most active with 38 victims and 57% (38 out of 67) victims.
Lynx: Second highest share of 24% (19 out of 81) victims, suggesting high interest in professional goods & services businesses.
Akira, Ransomhub: The two most active gangs in 2025 so far. Also recorded a high share of their victims (13.5%, 16.9%) in this industry, further contributing to pushing it as one of the most frequent victims of ransomware.
Geographic Distribution
The geographic distribution of ransomware victims is relatively low given the number of victims. The USA (153) accounted for 67% of all victims, followed by Canada (16), the UK (13), Germany (8), and Spain (5).
In total, 29 countries recorded ransomware victims in this industry in the last 90 days, a decline from 33 in he previous period.
For a comprehensive, up-to-date global ransomware tracking report, please refer to our new monthly “Tracking Ransomware” series here.
APT Campaigns (High): Professional goods & services organizations were targeted in 6 of 8 observed APT campaigns (67%)—a marked increase from the previous period in both count and proportion. Campaigns spanned the full quarter, peaking in May, and involved a wide mix of actors: Chinese (Stone Panda, Volt Typhoon, Salt Typhoon), Russian (TA505, FIN11), and regional groups from Pakistan, Vietnam, and Turkey. Seventeen countries were impacted, with India victimized in all six campaigns. Web apps were the primary vector, followed by frequent exploitation of operating systems, routers, network tools, and various business software platforms.
Underground & Dark Web Chatter (High): The sector accounted for 10.98% of all chatter, ranking 4th across industries. Ransomware chatter dropped sharply (−83% from an initial spike) but remains active. Data breach and leak volumes stabilized at high levels, indicating sustained exposure of sensitive client or operational data. Web exploit chatter fell substantially, while claimed hacks remained elevated. DDoS and hacktivism activity showed signs of resurgence, suggesting a potential rebound tied to political or social events.
Vulnerabilities (Moderate): Professional services ranked 6th for linked CVEs (6.76%). RCE vulnerabilities fell 59%, while XSS/clickjacking dropped sharply after an initial spike. Injection attacks held steady, reflecting continued attacker interest in exploiting user input. Memory-related issues spiked in February but dropped off. Other CVE types—DoS, privilege escalation, and information disclosure—remained minimal.
Ransomware (High): The industry recorded 229 ransomware victims—the 3rd most affected sector—though incidents declined slightly from the previous quarter. Share of total victims fell from 13.4% to 12.1%. February and May saw major spikes, driven by Cl0p, RansomHub, and especially SilentRansomGroup, which heavily targeted legal services. Of 74 active groups, 40 hit this sector. SilentRansomGroup led with 38 victims (57% of their total), followed by Lynx (24%). Akira and RansomHub also showed consistent interest. The U.S. accounted for 67% of victims. Incidents were recorded in 29 countries, down slightly from the previous quarter.