

The CYFIRMA Industry Report delivers original cybersecurity insights and telemetry-driven statistics of global industries, covering one sector each week for a quarter. This report focuses on the professional goods & services industry, presenting key trends and statistics in an engaging infographic format.
Welcome to the CYFIRMA infographic industry report, where we delve into the external threat landscape of the professional goods & services industry over the past three months. This report provides valuable insights and data-driven statistics, delivering a concise analysis of attack campaigns, phishing telemetry, and ransomware incidents targeting the professional goods & services industry.
We aim to present an industry-specific overview in a convenient, engaging, and informative format. Leveraging our cutting-edge platform telemetry and the expertise of our analysts, we bring you actionable intelligence to stay ahead in the cybersecurity landscape.
CYFIRMA provides cyber threat intelligence and external threat landscape management platforms, DeCYFIR and DeTCT, which utilize artificial intelligence and machine learning to ingest and process relevant data, complemented by manual CTI research.
For the purpose of these reports, we leverage the following data from our platform. These are data processed by AI and ML automation, based on both human research input and automated ingestions.
While this report contains statistics and graphs generated primarily by automation, it undergoes thorough review and enhancement for additional context by CYFIRMA CTI analysts to ensure the highest quality and provide valuable insights.
Professional goods & services organizations featured in 6 out of the 12 observed campaigns, which is a presence in 50% of all campaigns.

The number of observed APT campaigns targeting this industry peaked in October and has shown a gradual decline over the past 90 days.
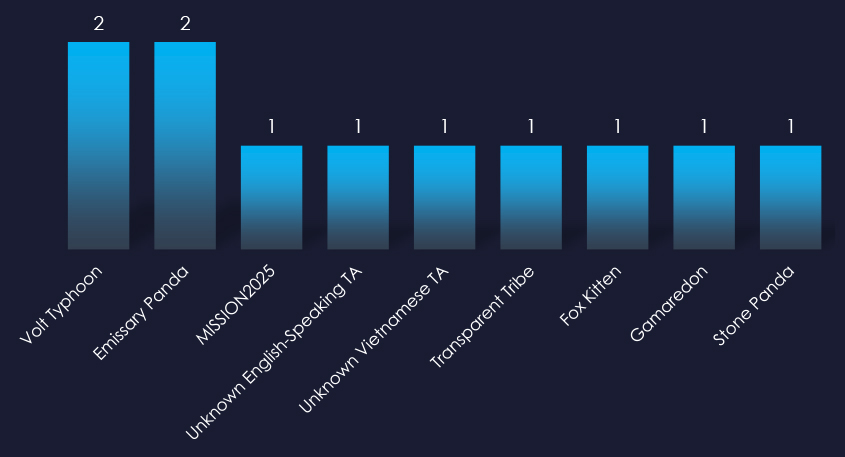
Observed threat actors originate from across the globe, including familiar names like China’s Pandas and Typhoon, which were the most active. Russia’s Gamaredon, as well as Pakistan’s Transparent Tribe, Iran’s Fox Kitten, and unattributed Vietnamese and English-speaking groups, all recorded one campaign each.
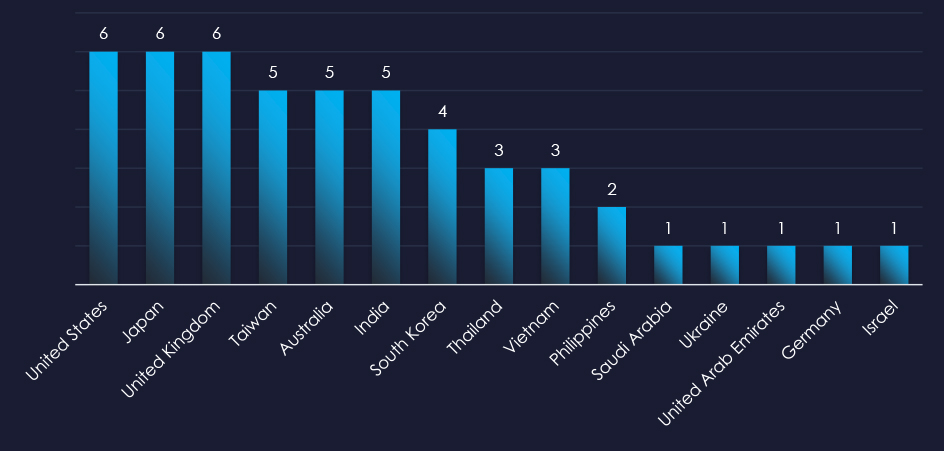
The recorded victims of observed attack campaigns span 15 countries, aligning with the known rival nations of the identified nation-state threat actors.
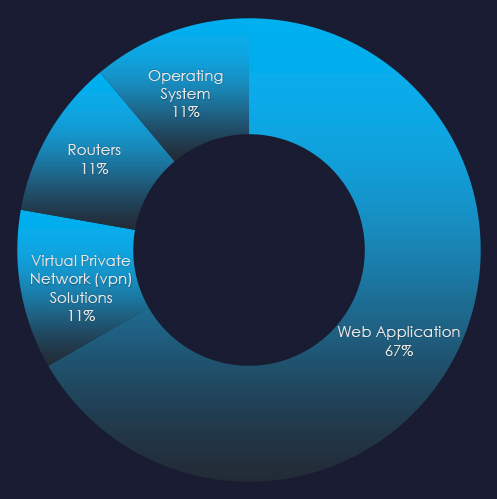
Most campaigns utilized Web Application attacks as a primary attack vector. Operating systems, routers and VPN solutions were also exploited.
Risk Level Indicator: High

In the past 90 days, professional goods & services organizations have been significantly impacted by advanced persistent threat (APT) campaigns. All 50% of observed APT campaigns recorded professional goods & services industry victims, with 6 out of 12 total campaigns.
Monthly Trends
Activity peaked in October and gradually slowed down since then.
Key Threat Actors
The professional goods & services industry, including some of the most important international corporations as well as many local small and medium businesses, attracts a wide range of nation-state threat actors. In past 90 days it was China, Russia, Pakistan, Iran, Vietnam.
Geographical Impact
The campaigns have affected a total of 15 countries, seemingly dispersed across continents, yet they appear to align with the rival nations of the active threat actors.
Targeted Technologies
Web applications remain the most frequently targeted technology with operating systems, routers, and VPN solutions also being exploited.
Over the past 3 months, CYFIRMA’s telemetry detected 321 phishing campaigns themed around professional goods & services out of a total of 205,150.
The chart below illustrates the global distribution of observed themes. Observed professional goods & services-related phishing accounts for 0.16% of all captured phishing attempts and is scattered around various tracked categories.
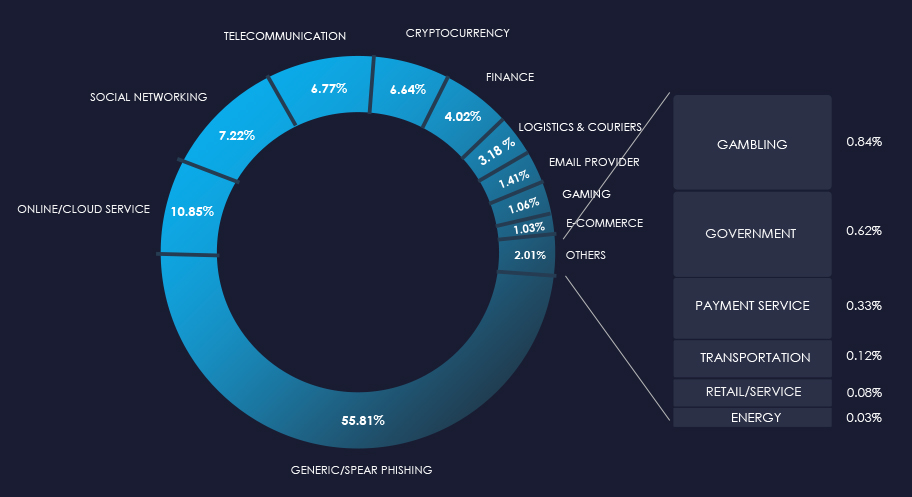
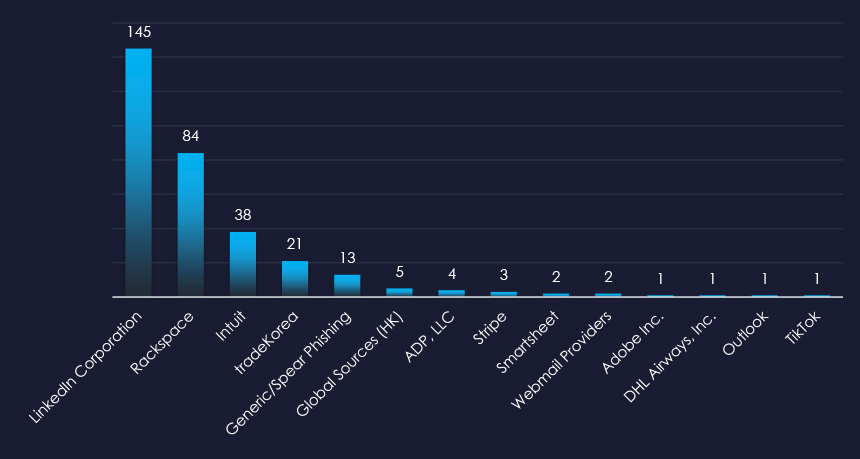
LinkedIn, Rackspace and Intuit are the most frequently impersonated professional goods & services organizations. Some other platforms such as Outlook or TikTok also served as avenue for delivering professional goods & services theme.
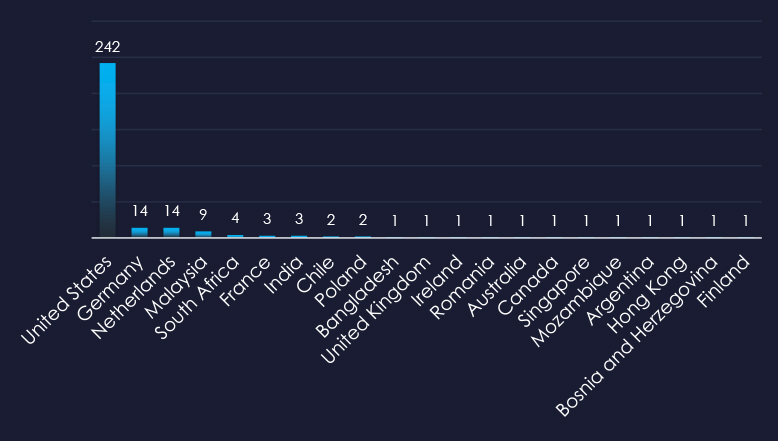
The United States is by far the largest source of observed phishing, followed by Germany, and Netherlands in distant second to third places.
Risk Level Indicator: Low

The professional goods & services sector remains an unpopular phishing theme for wide “spray & pray” campaigns. While it is a relatively frequent theme in various targeted and spear-phishing, the industry’s highly fragmented nature does not lend itself to internet-wide lures.
Overall, the list includes 14 brands; however, most, such as Outlook or LinkedIn, are vectors to deliver professional goods & services themes.
ASN-origin data reveals that the United States is the leading source of phishing emails, correlating with the country’s robust professional services industry and the vast number of compromised devices used in botnets to send phishing emails. Significant activity is also observed in the Netherlands and Germany for similar reasons.
Overall, the presence in both developed and developing nations highlights that phishing campaigns are opportunistic and globally pervasive.
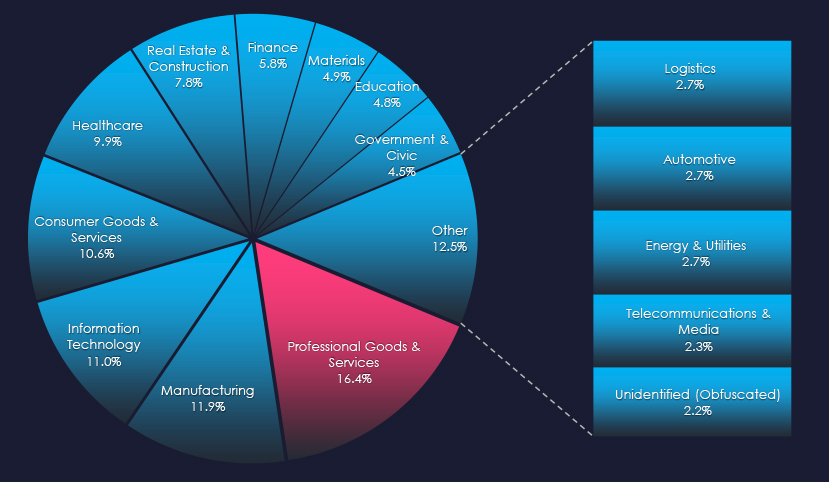
In the past 90 days, CYFIRMA has identified 277 verified ransomware victims in the professional goods & services industry. This accounts for 16.4% of the overall total of 1,693 ransomware victims during the same period, placing the professional goods & services industry as the most frequent victim of ransomware.
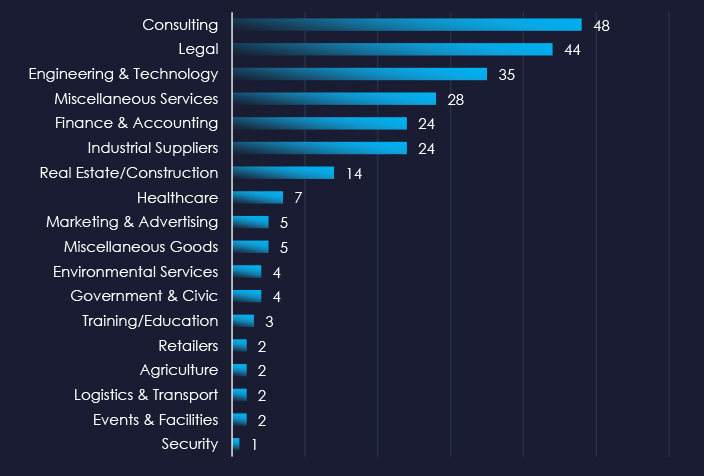
As per the consolidated sectors chart above, Consulting, Legal and Engineering services are the most frequent victims of ransomware in the professional goods & services industry. Note that some sectors, such as Real Estate/Construction or Healthcare are sectors that receive specific services of victim organizations.
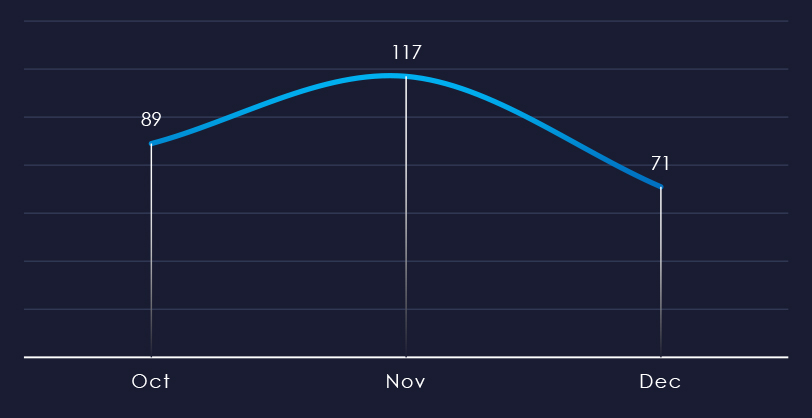
Over the past 90 days, we’ve observed a mild spike during November and a notable dip during December. This is likely due to even cybercriminals observing the holiday season, rather than downward trend of ransomware.
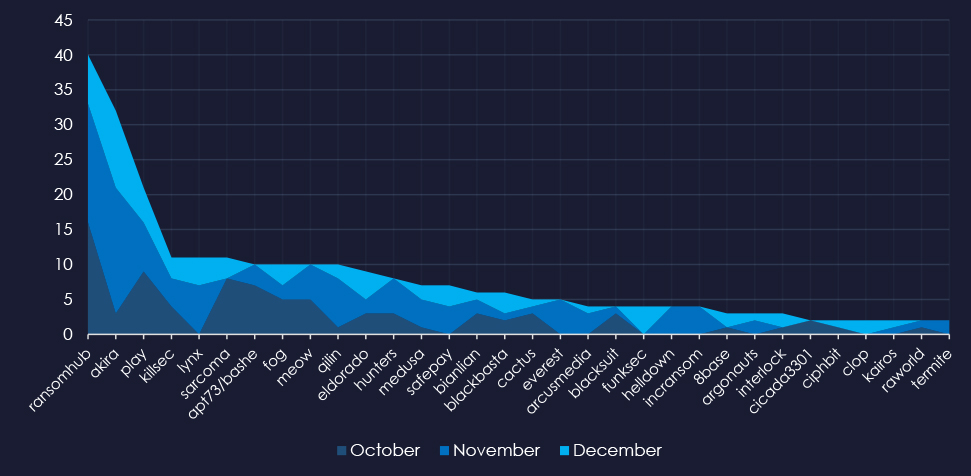
A breakdown of the monthly activity provides insights into which gangs were active each month. For example, RansomHub was active for months. Akira and Lynx were most active in November.
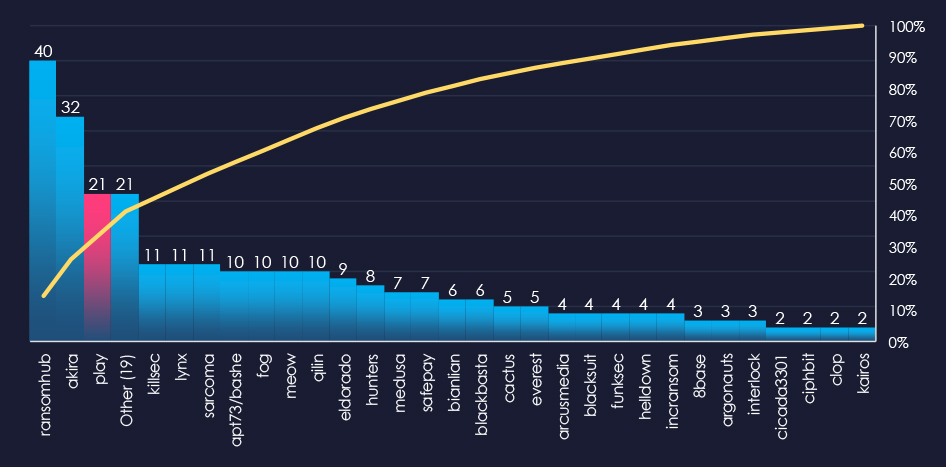
In total 50 out of 62 active groups recorded professional goods & services organizations victims in the past 90 days. Notable is the relatively high distribution among a large number of groups in this period.
When comparing the professional goods & services industry to all recorded victims, RansomHub emerges with the highest number of victims overall and a significant share of 17% of victims (40 out of 239). Lynx shows the highest targeting of this industry, with 24% (11 out of 46) of their victims coming from this industry.
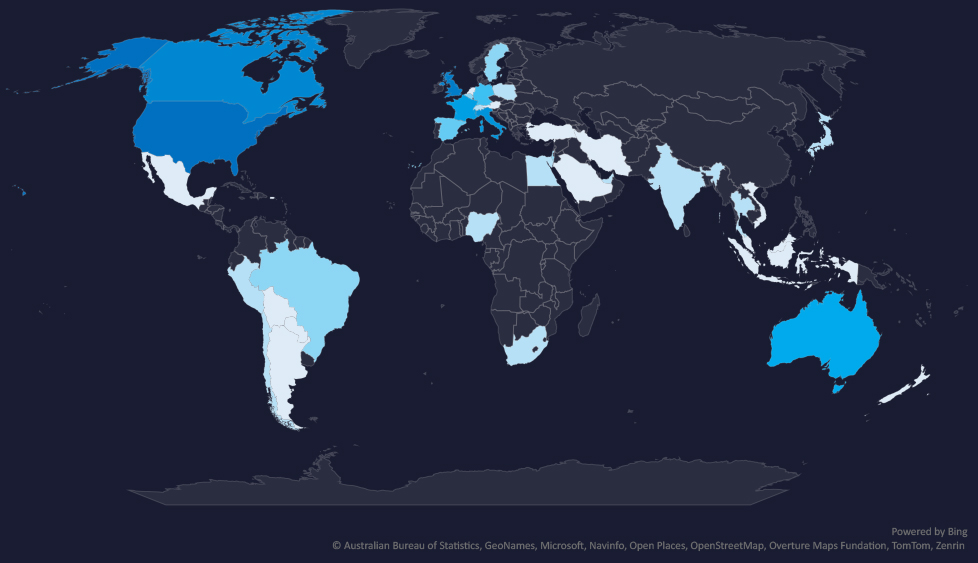
The geographic distribution heatmap underscores the widespread impact of ransomware, highlighting the countries where victims in this industry have been recorded.
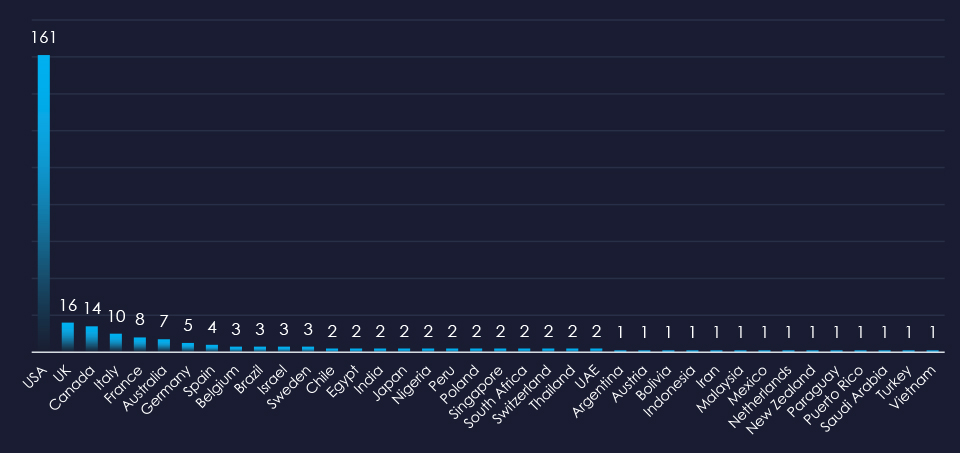
In total 39 countries recorded ransomware victims with the US alone accounting for 58% of all victims with identified geography.
Risk Level Indicator: High

The professional goods & services industry is placed 1st as the most frequent victim. It faces a sustained ransomware threat, with attacks affecting a variety of sub-sectors and a broad geographic distribution. The steady monthly activity, coupled with the involvement of numerous ransomware groups, highlights the ongoing risk.
Monthly Activity Trends
Ransomware activity in the professional goods & services industry peaked in November and mildly declined during December.
Ransomware Gangs
A total of 50 out of 62 active ransomware groups targeted the professional goods & services industry in the past 90 days:
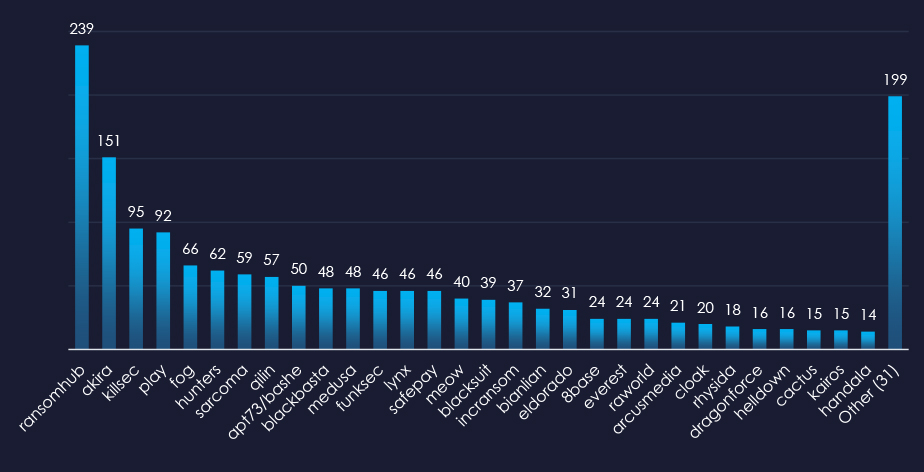
RansomHub: Recorded the most victims (40 out of 239 victims), mostly due to the sheer volume, but they also show significant focus on this industry with a 17% share of victims.
Lynx: has the highest share of victims from this industry with 24% (11 out of 46 victims).
Geographic Distribution
The geographic distribution of ransomware victims in the professional goods & services industry reflects the industry’s global nature and the widespread reach of these attacks:
58% of all victims with identified geography are located in the US.
Alongside the US, the UK, Canada, Italy, and France recorded the most victims. This correlates with robust law, accounting, and similar services industry.
In total, 39 countries recorded ransomware victims in the professional goods & services industry.
For a comprehensive, up-to-date global ransomware tracking report, please refer to our new monthly “Tracking Ransomware” series here.
Over the past 90 days, professional goods & services organizations faced low to high cyber risks across monitored categories.
APT Campaigns (High): 50% (6 out of 12) of observed campaigns targeted the sector, peaking in October with a gradual slowdown afterward. Key threat actors originated from China, Russia, Pakistan, Iran, and Vietnam, impacting 15 countries. Web applications were most frequently targeted, along with operating systems, routers, and VPNs.
Phishing (Low): The sector is generally not a major target for broad “spray & pray” campaigns due to its fragmentation. Most phishing activity involves platforms like Outlook or LinkedIn, used as vectors to deliver professional services–themed lures. While the U.S. leads as a phishing source, the Netherlands and Germany also show notable activity.
Ransomware (High): Ranked 1st as the most frequently targeted sector. Professional goods & services face a significant ransomware threat with a global reach. Activity peaked in November. Of 62 active ransomware groups, 50 targeted this industry. RansomHub recorded the highest number of victims (40 out of 239), while Lynx showed the greatest proportional focus at 24%. The U.S. accounted for 58% of identified victims, followed by the U.K., Canada, Italy, and France—totaling 39 affected countries.