



The CYFIRMA Industry Report delivers original cybersecurity insights and telemetry-driven statistics of global industries, covering one sector each week for a quarter. This report focuses on the professional goods & services industry, presenting key trends and statistics in an engaging infographic format.
Welcome to the CYFIRMA infographic industry report, where we delve into the external threat landscape of the professional goods & services industry over the past three months. This report provides valuable insights and data-driven statistics, delivering a concise analysis of attack campaigns, phishing telemetry, and ransomware incidents targeting the professional goods & services industry.
We aim to present an industry-specific overview in a convenient, engaging, and informative format. Leveraging our cutting-edge platform telemetry and the expertise of our analysts, we bring you actionable intelligence to stay ahead in the cybersecurity landscape.
CYFIRMA provides cyber threat intelligence and external threat landscape management platforms, DeCYFIR and DeTCT, which utilize artificial intelligence and machine learning to ingest and process relevant data, complemented by manual CTI research.
For the purpose of these reports, we leverage the following data from our platform. These are data processed by AI and ML automation based on both human research input and automated ingestions.
While this report contains statistics and graphs generated primarily by automation, it undergoes thorough review and enhancement for additional context by CYFIRMA CTI analysts to ensure the highest quality and provide valuable insights.
Professional goods & services organizations featured in 4 out of the 10 observed campaigns, which is a presence in 40% of campaigns.

We are observing a moderate, but sustained interest in last 90 days.
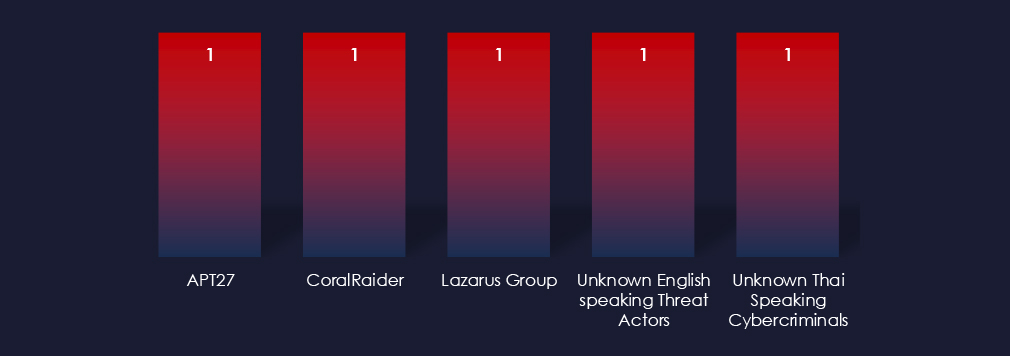
The 5 observed campaigns were carried out by a wide variety of threat actors, including APT27, CoralRaider from Vietnam and unknown English and Thai speaking groups.
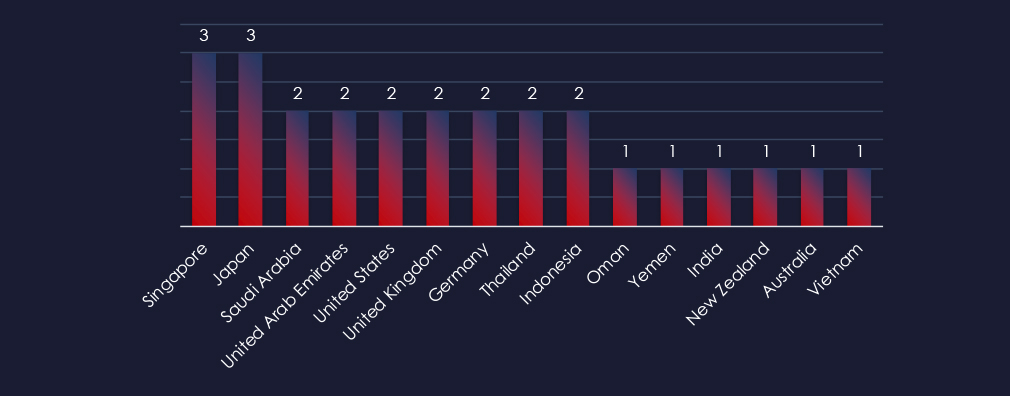
Recorded victims of observed attack campaigns span 16 different countries. Singapore and Japan recorded victims in 3 observed campaigns.

Web applications continue to rank as the most targeted technology across industries. All observed campaigns were carried out through Web Applications.
Risk Level Indicator: Moderate

In the past 90 days, professional goods & services organizations have been significantly impacted by advanced persistent threat (APT) campaigns. Notably, 40% of observed APT campaigns targeted the professional goods & services sectors, with 4 out of 10 total campaigns affecting this industry.
Monthly Trends
An analysis of monthly trends shows moderate but sustained interest over time.
Key Threat Actors
There was no single outstanding threat actor. This is most likely due to the widely diversified nature of this industry, mostly comprised of small to medium businesses.
Geographical Impact
The campaigns impacted a total of 16 countries, with Singapore and Japan being hit by 3 out of 4 observed campaigns. Other significantly affected countries included Saudi Arabia, the United States, the United Arab Emirates, the United Kingdom, and Germany.
Targeted Technologies
Web applications emerged as the most targeted technology within these campaigns.
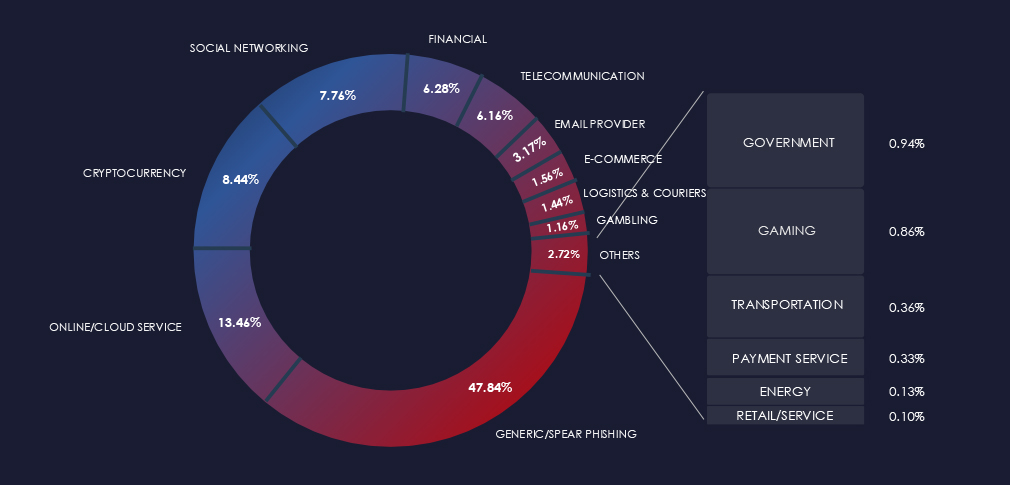
Over the past 3 months, CYFIRMA’s telemetry detected 951 phishing campaigns themed around professional goods & services out of a total of 218,394.
The chart below illustrates the global distribution of observed themes. Professional goods & services brands are scattered throughout various categories accounts for 0.43% of all captured phishing attempts.
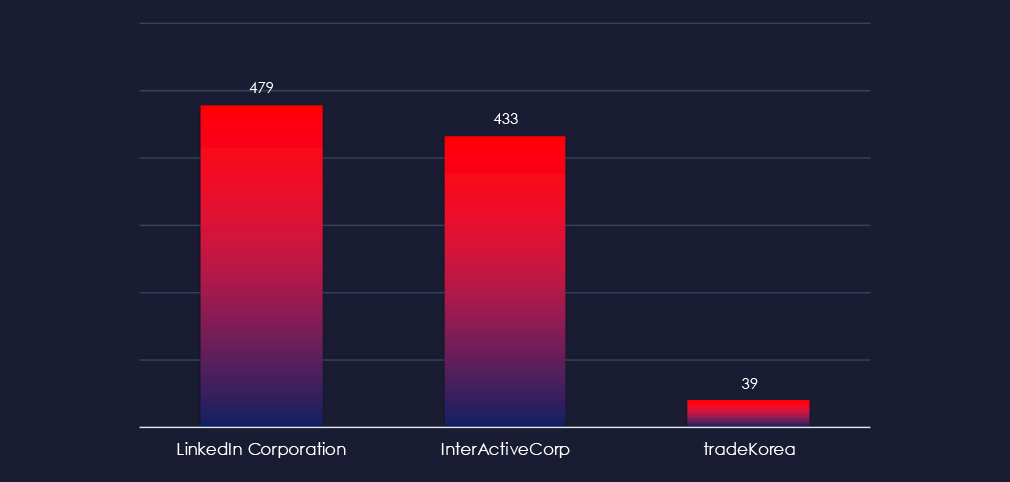
LinkedIn, InterActiveCorp and tradeKorea were the only observed impersonations in this industry.
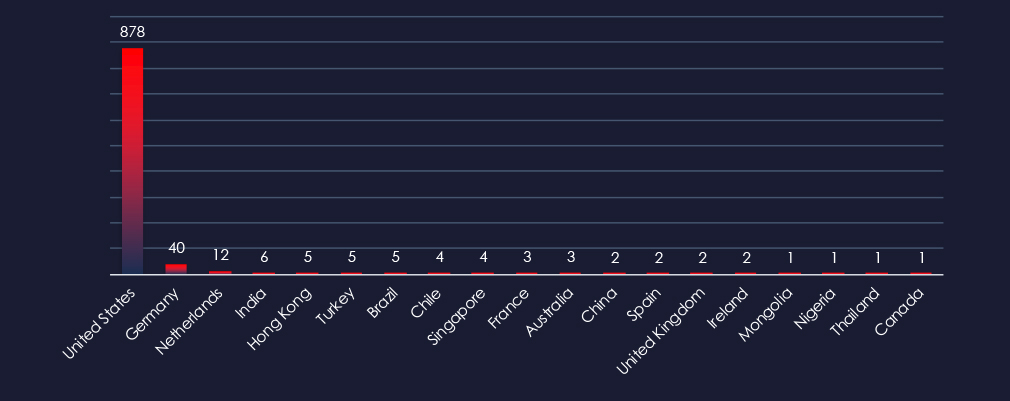
The geographical sources of observed phishing campaigns show that most of them come from the US.
Risk Level Indicator: Low

Professional goods and services industry, like manufacturing and materials, are not popular phishing lures because they represent a fragmented industry and typically do not provide direct monetization opportunities for cybercriminals.
Overall, the list includes 3 organizations from 19 countries. Many international and regional platforms are being impersonated.
ASN-origin data reveals that the United States is the leading source of phishing emails impersonating information technology organizations, reflecting the sheer size of the market in the U.S. and the vast number of compromised devices used in botnets to send phishing emails.
In the past 90 days, CYFIRMA has identified 223 verified ransomware victims in professional goods & services industry. This accounts for 16.6% of the overall total of 1,349 ransomware victims during the same period.
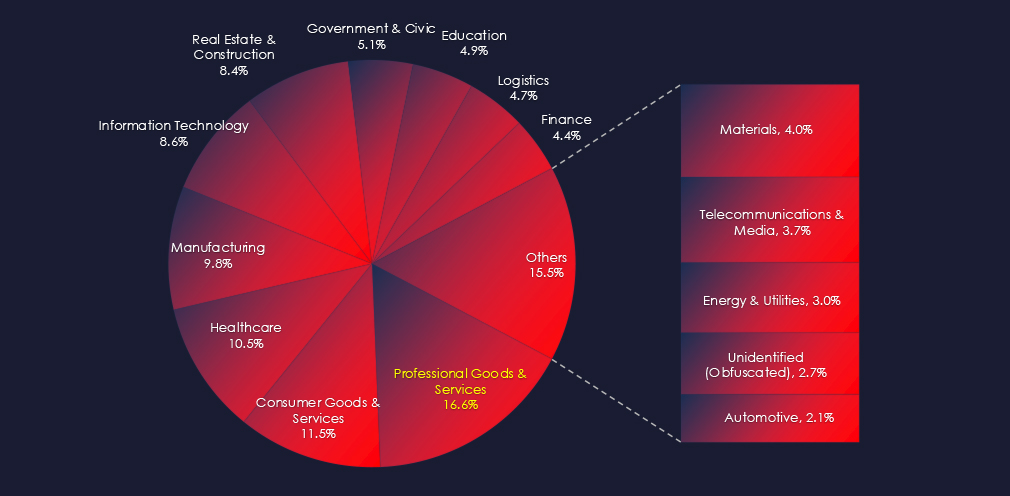
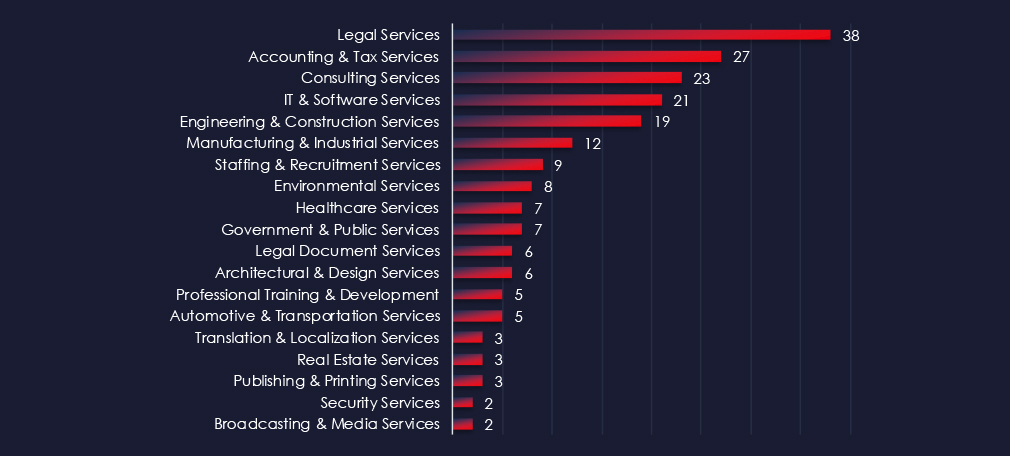
Legal and Accounting are the most frequent victims of ransomware in professional goods & services industry. Since there are so many individual sectors, we attempted grouping for more concise data and as a result naming appears to be overlapping with other industries.
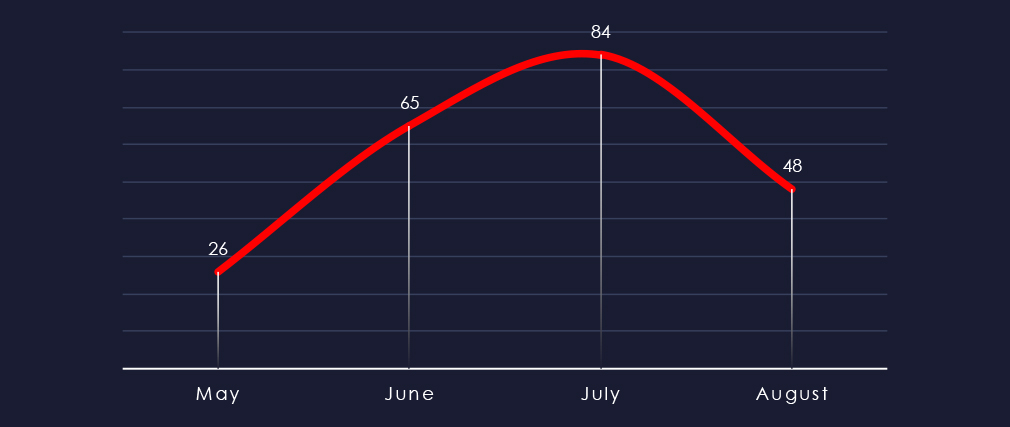
Considering May and August are split in 1/3 and 2/3 at the time of collection, we can see sustained interest with a spike in July.
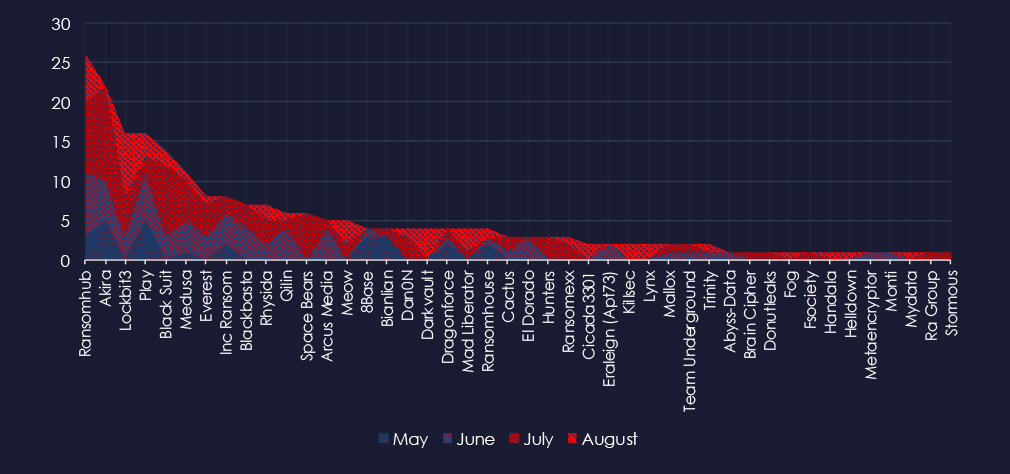
A breakdown of the monthly activity provides insights into which gangs were active each month. For example, RansomHub and Akira recorded a large number of victims in July. LockBit3 came back in May after law enforcement disruption and added a lot of victims in August.
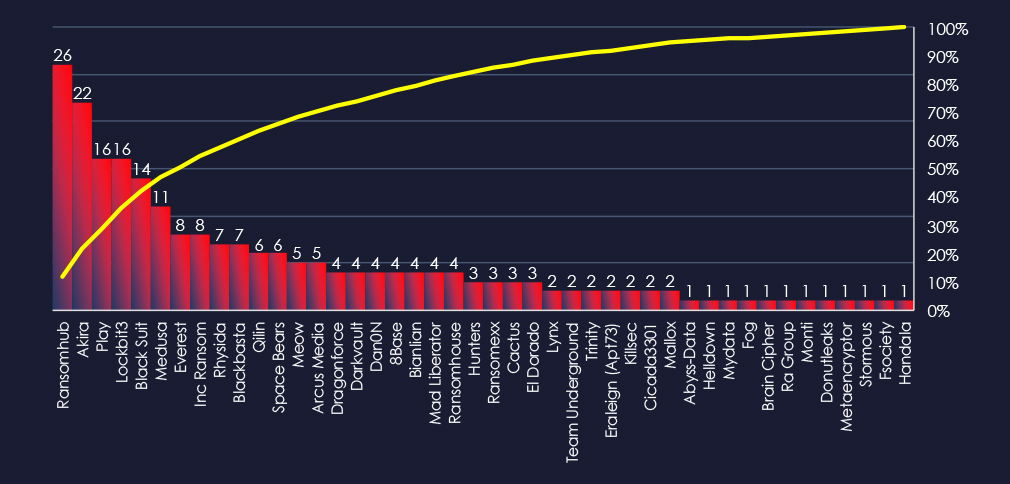
In total 44 out of 62 active groups recorded professional goods & services organizations victims in the past 90 days.
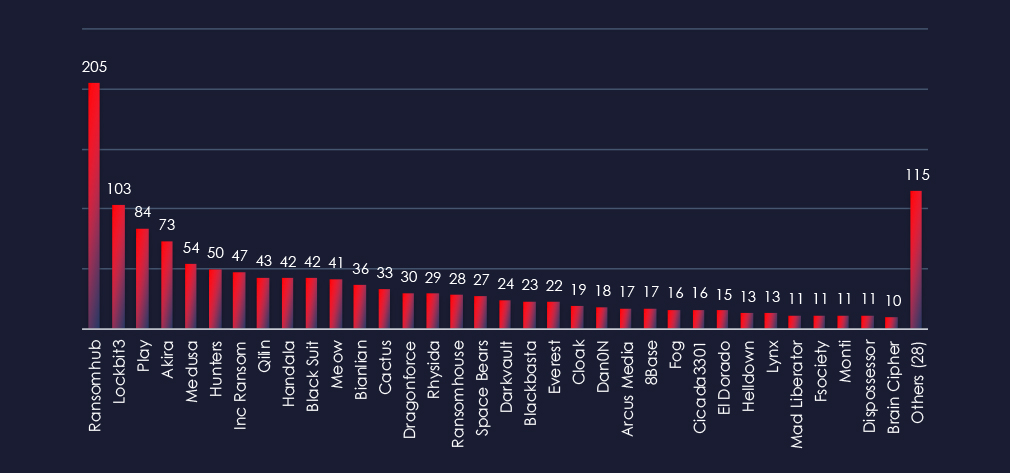
Comparing the professional goods & services industry to all recorded victims, Akira stands out with high percentage of victims in this industry with 22 out of 73 (30%). Highest share but overall lower number has Black suite with 14 out of 42 (33%) victims.
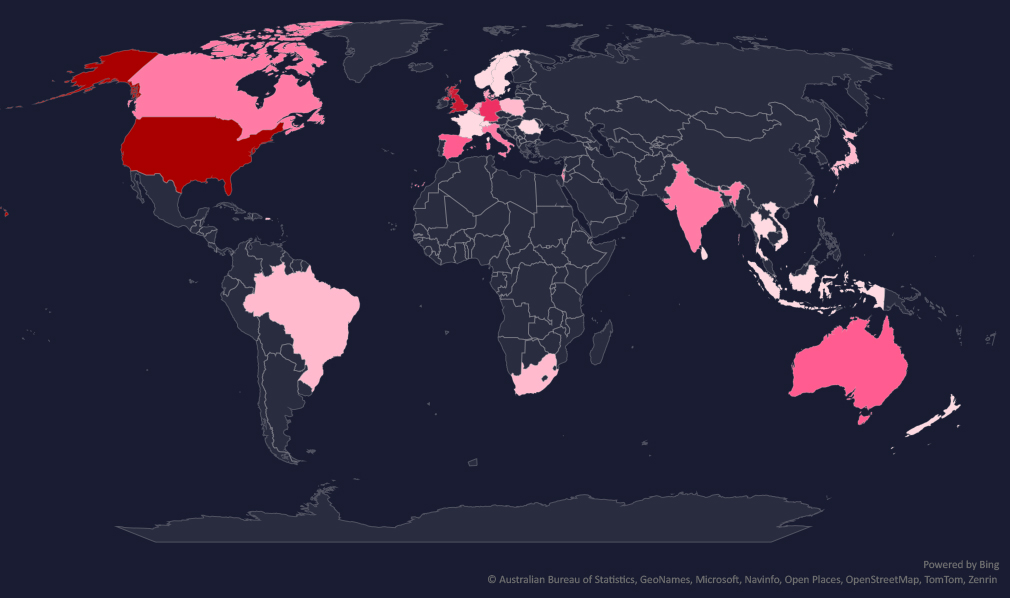
The geographic distribution heatmap underscores the widespread impact of ransomware, highlighting the countries where victims in this industry have been recorded.
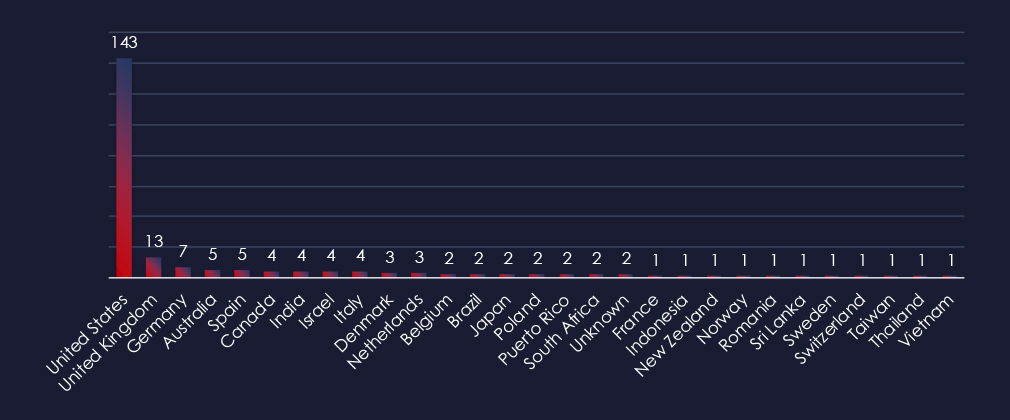
In total 29 countries recorded ransomware victims with the US alone accounting for ~65% of all victims with identified geography.
Risk Level Indicator: High*

The professional goods & services industry ranked first with the highest number of victims. Although we maintain an overall high risk, it is largely due to the sheer number of small and medium businesses in this industry.
That said, sectors like Legal, Accounting & Tax, and Consulting services are the most frequent victims truly warranting high-risk factors.
Ransomware activity in the professional goods & services industry has shown steady numbers of victims each month with an uptick during July.
This uptick is due to increased activity of RansomHub and Akira in the same month.
Ransomware Gangs
A total of 44 out of 62 active ransomware groups targeted this industry in the past 90 days:
Akira: 30% of their victims were in this industry (22 out of 73 victims), Implying significant interest.
Black suit: 33% of their victims were in this industry (14 out of 44 victims). It has the highest overall share of victims in this industry.
Geographic Distribution
The geographic distribution of ransomware victims in the professional goods & services industry highlights the widespread nature of these attacks:
65% of all victims with identified geography are located in the US. The UK and Germany appear to be also frequently targeted in this sector in the last 90 days with 13 and 7 victims respectively.
In total, 29 countries reported ransomware victims in this industry.
For a comprehensive, up-to-date global ransomware tracking report, please refer to our new monthly “Tracking Ransomware” series here.
Over the past 90 days, the professional goods & services industry has faced varying levels of cyber risk across different threat categories.
APT Campaigns: The industry faces a moderate risk, with 40% of observed APT campaigns targeting this sector. Although no single threat actor stands out, the industry’s diversity, largely comprised of small to medium businesses, likely contributes to this. The campaigns affected 16 countries, with Singapore and Japan being the most impacted. Web applications are the primary targets of these attacks.
Phishing: The risk from phishing impersonations is low in this sector, primarily due to its fragmented nature and limited direct monetization opportunities. Only 3 organizations were impersonated, with the United States being the leading source of phishing emails, reflecting its large digital infrastructure and the prevalence of compromised devices used in botnets.
Ransomware: The industry faces a high risk from ransomware, with the highest number of victims among all industries. Legal, Accounting & Tax, and Consulting services are the most frequently targeted subsectors, driving the high-risk assessment. Notably, Akira and Black Suit ransomware gangs have shown significant interest, with 30% and 33% of their victims, respectively, coming from this industry. The majority of ransomware victims are located in the US, with significant activity also observed in the UK and Germany.