


The CYFIRMA Industry Report delivers original cybersecurity insights and telemetry- driven statistics of global industries, covering one sector each week for a quarter. This report focuses on the materials industry, presenting key trends and statistics in an engaging infographic format.
Welcome to CYFIRMA infographic industry report, where we delve into the external threat landscape of the materials industry over the past three months. This report provides valuable insights and data-driven statistics, delivering a concise analysis of attack campaigns, phishing telemetry, and ransomware incidents targeting the materials industry, including Mining, Chemicals, Construction Materials, Packaging (glass and plastic), Paper and Forest products.
We aim to present an industry-specific overview in a convenient, engaging, and informative format. Leveraging our cutting-edge platform telemetry and the expertise of our analysts, we bring you actionable intelligence to stay ahead in the cybersecurity landscape.
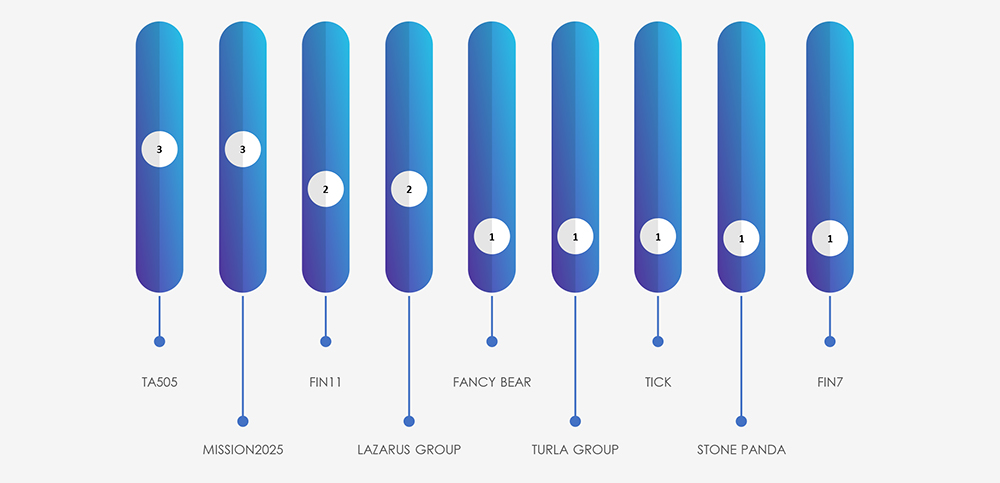
The materials industry organizations were involved in 8 out of the 67 observed campaigns (12%) during the same time period, which is a relatively low number compared to other industries.

Data clearly shows low interest by Nation-State APTs in the materials industry and dominance of financially motivated threat actors, including Lazarus Group, which is also operating mostly for financial gains.
GEOGRAPHICAL DISTRIBUTION
The attack campaigns that involved materials industry victims are by a large margin European. This is most likely due to involved financially motivated threat actors having links to the Russian Government and aligned with Ukraine-Russia conflict strategic objectives.
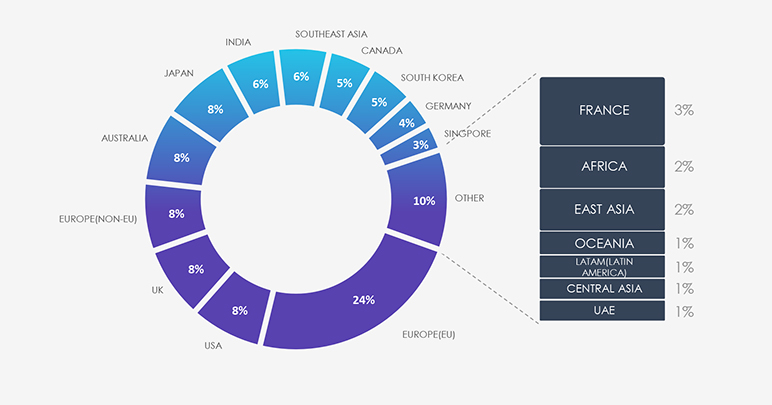
Due to the overlapping nature of monitoring telemetry, further breakdown beyond the top 10 countries is calculated for regions rather than individual countries to maintain clarity.
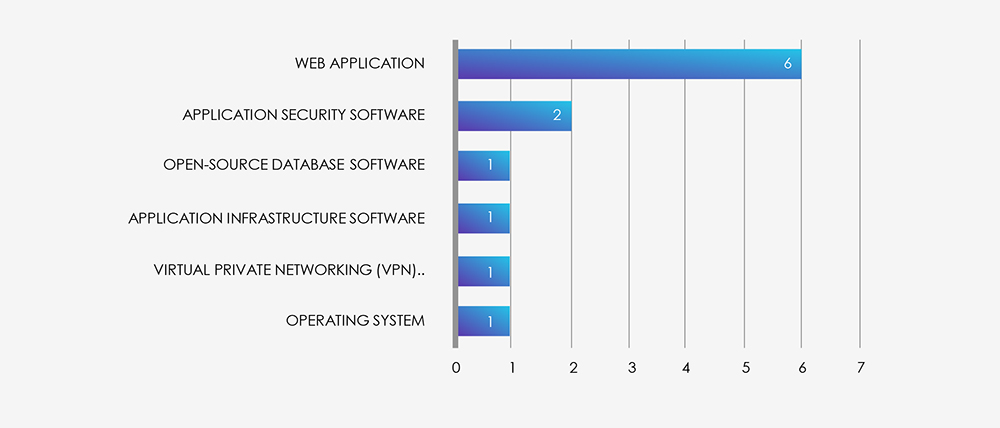
Despite the materials industry being considered mostly an “offline” industry, most common attack vectors are web applications, followed by application security, open-source database and infrastructure software as well as compromised VPN.
Phishing campaigns explicitly targeting or impersonating the materials industry are very rare. The materials industry is in a similar spot as manufacturing, which is heavily targeted through tailored spear-phishing by ransomware gangs, but they are seldom involved in entire campaigns, as they do not present a good lure, due to the nature of their business.
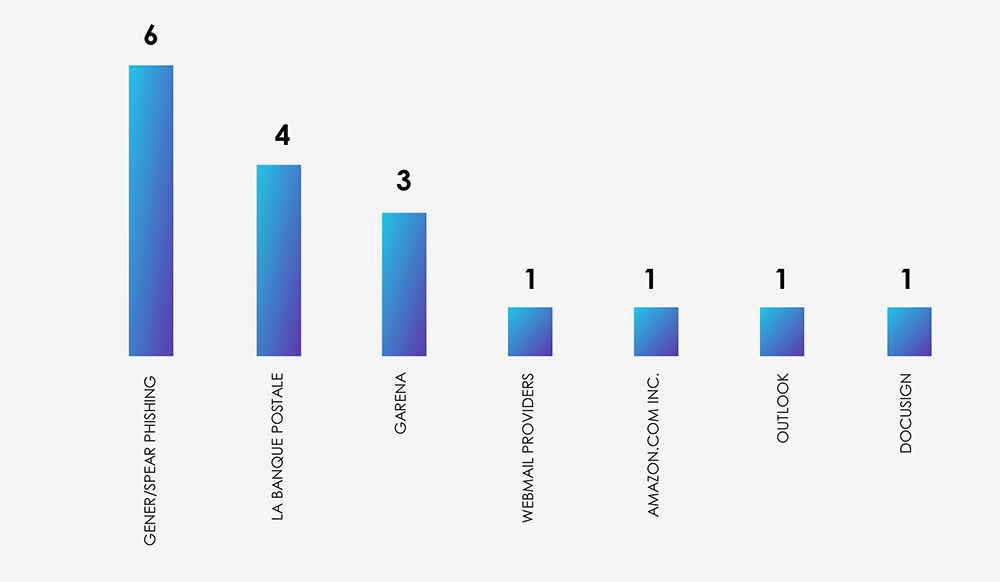
Over the past 3 months, CYFIRMA’s telemetry recorded only 17 phishing attacks out of a total of 213,812, making up 0.0079% of all observed phishing attack campaigns. The number is so small that we did not track the materials industry as a category in the chart below.
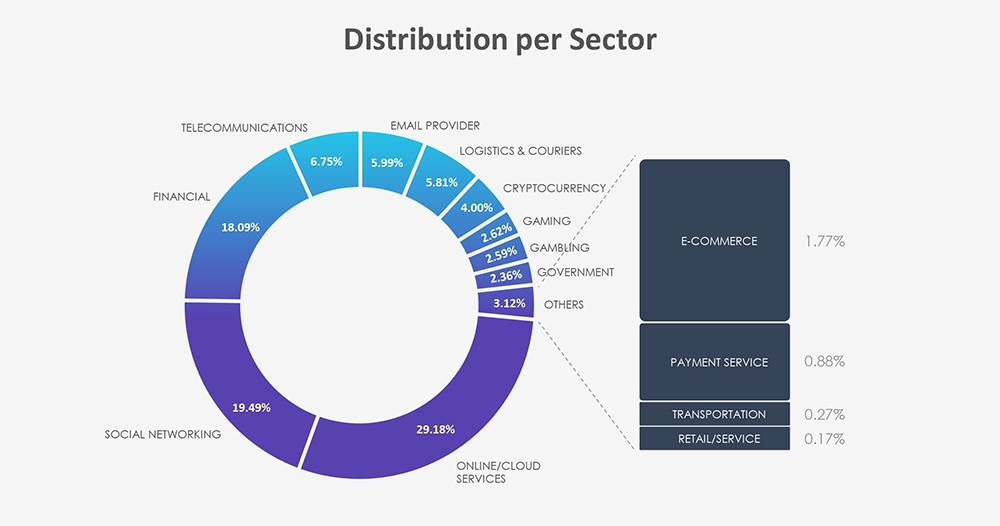
Out of 17 observed phishing attacks involving materials industry companies, none were impersonation.
From the 17 phishing attacks, we can see most are of generic “spray and pray” nature.
In the past 90 days, CYFIRMA has identified 94 verified ransomware victims within the materials industry sectors. This accounts for 5.6% of the overall total of 1,675 ransomware incidents during the same period.
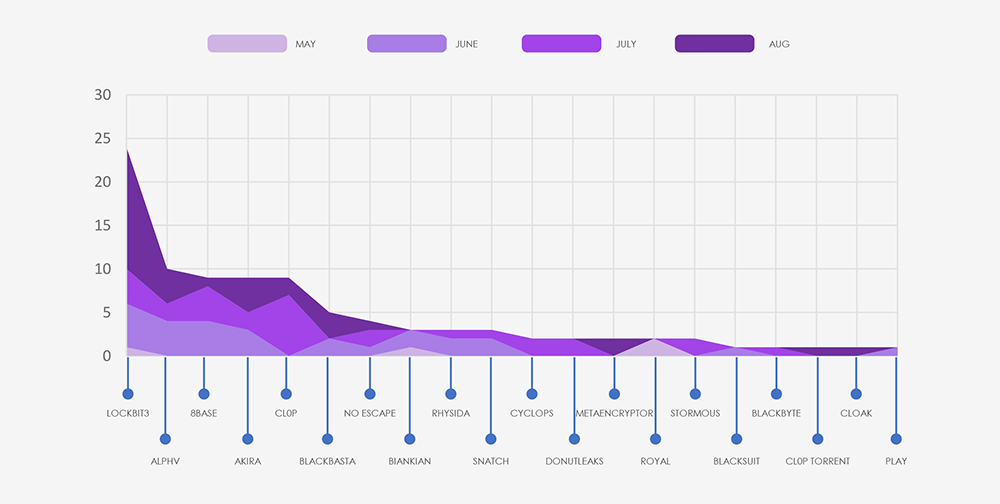
The chart below shows consistently high numbers of attacks, when adjusted for partial months in May and August and slightly growing trend.

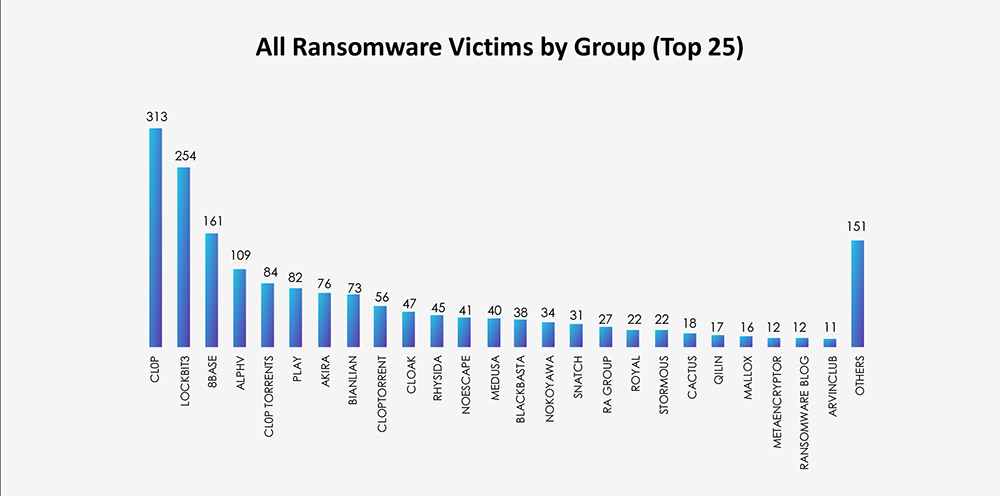
Breaking down monthly activity by gangs, Lockbit3 is the most active with 24 victims. Surprising is a relatively low number of Cl0p victims; including Cl0p Torrent, they add up to “only” 10 victims. In last weeks’ manufacturing report, they surpassed Lockbit3 and given similar nature of both materials and manufacturing industries, we expected to see high numbers again.
The subsequent chart underscores the dominance of major ransomware gangs, with the top 5 accounting for 65% of all victims. Simultaneously, the chart illustrates how the collective activity of smaller groups contributes to a substantial number of victims.
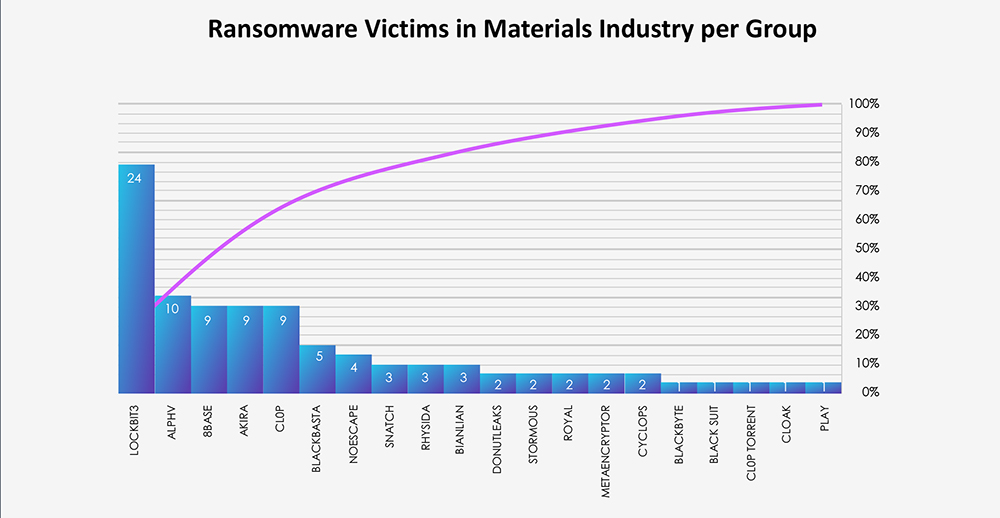
From 59 gangs active in the past 90 days, 20 recorded verified materials industry victims. This is an increase compared to other industries. Average gang participation is between 12-15 for industry.
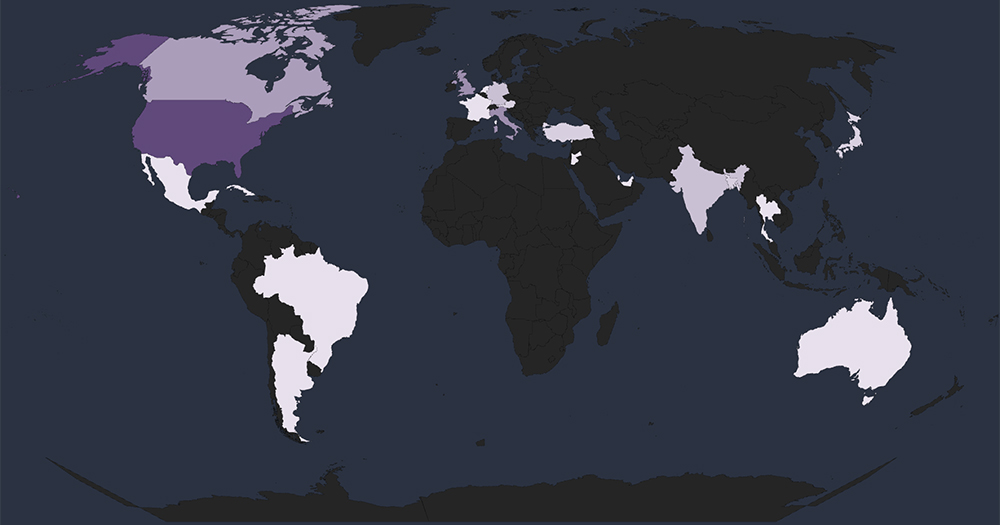
Global Spread – Out of the 70 victims with identified geography, the United States emerges as the most affected with 27 victims, followed by nations known for their materials industry such as the UK, Italy, Canada and India.
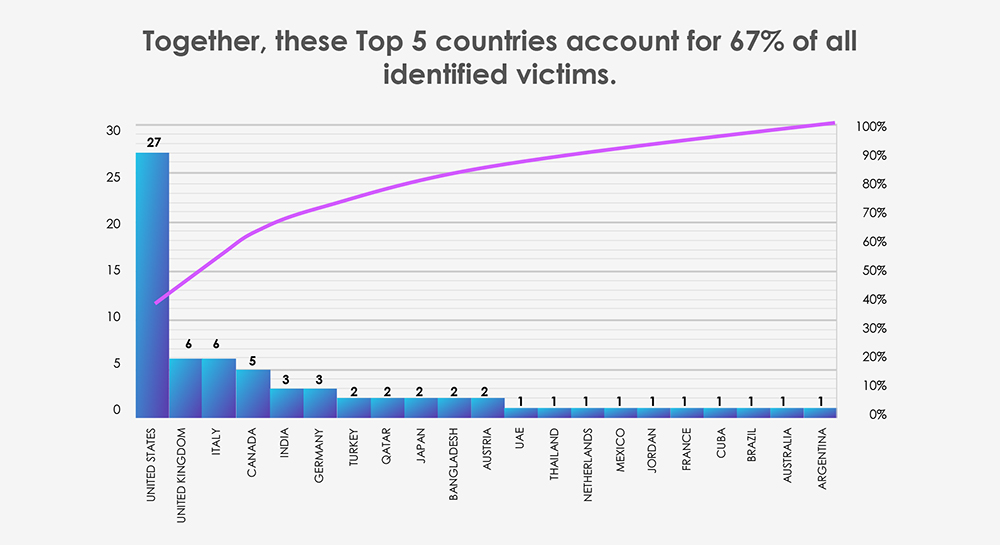
Geographical Vulnerability – The distribution of victims serves as a reminder that no region is exempt from ransomware threats. Cyber attackers have the capability to breach and target vulnerable organizations globally. This trend indicates that many threat actors prioritize exploiting vulnerabilities within organizations, regardless of their geographical locations.
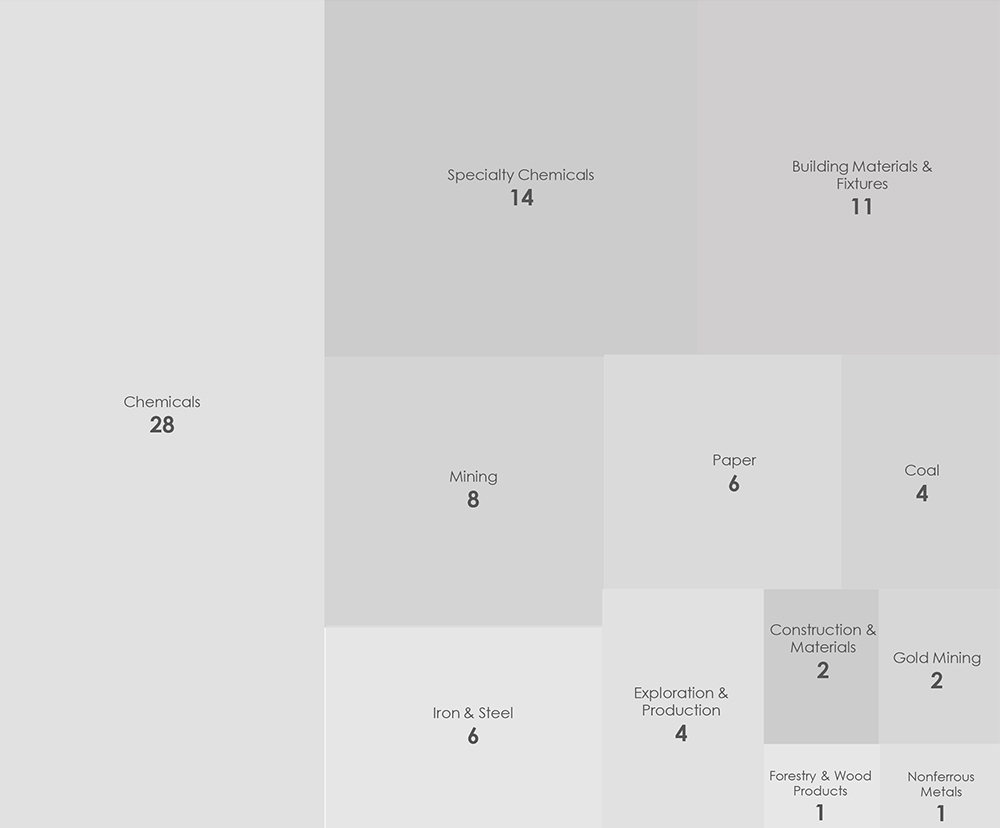
Sectors Distribution – The chart below illustrates the distribution of ransomware incidents over the past 90 days. Chemicals are by far the most attacked sector within the materials industry. In distant second and third place are building materials and mining.
Our data suggests that the materials industry receives relatively less attention from nation-state APTs, except for European companies, likely influenced by the Ukraine-Russian conflict. Some overlap exists between Russian financially motivated APTs like TA505 and FIN11 with Fancy Bear.
The materials industry’s nature doesn’t lend itself to a compelling phishing bait, so we haven’t observed any instances of brands being impersonated for phishing campaigns. Instead, phishing themes used in attacks on this industry have been quite generic, such as Outlook, Office365, or Amazon-related.
Notably, ransomware victimology reveals an above-average share of victims from the materials industry, accounting for roughly 1 in 20 victims. The most affected sectors within this industry include chemicals, building materials, and mining.