
The CYFIRMA Industry Report delivers original cybersecurity insights and telemetry-driven statistics of global industries, covering one sector each week for a quarter. This report focuses on the materials industry, presenting key trends and statistics in an engaging infographic format.
Welcome to the CYFIRMA infographic industry report, where we delve into the external threat landscape of the materials industry over the past three months. This report provides valuable insights and data-driven statistics, delivering a concise analysis of attack campaigns, phishing telemetry, and ransomware incidents targeting materials organizations.
We aim to present an industry-specific overview in a convenient, engaging, and informative format. Leveraging our cutting-edge platform telemetry and the expertise of our analysts, we bring you actionable intelligence to stay ahead in the cybersecurity landscape.
CYFIRMA provides cyber threat intelligence and external threat landscape management platforms, DeCYFIR and DeTCT, which utilize artificial intelligence and machine learning to ingest and process relevant data, complemented by manual CTI research.
For the purpose of these reports, we leverage the following data from our platform. These are data processed by AI and ML automation based on both human research input and automated ingestions.
While this report contains statistics and graphs generated primarily by automation, it undergoes thorough review and enhancement for additional context by CYFIRMA CTI analysts to ensure the highest quality and provide valuable insights.
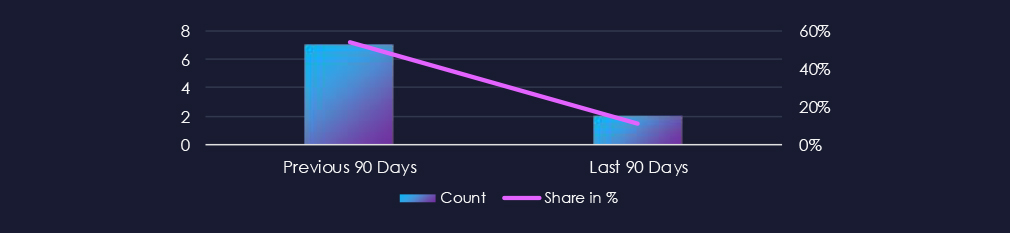
Over the past 90 days, the Materials industry appeared in 2 out of the 18 observed campaigns, representing a presence in 11% of all activity. This marks a decline from 7 in the previous 90-day period, and a notable drop in overall share from 54% (7 out of 13).
The chemicals sector was unusually frequently targeted during the previous 90-day period.

Both of the campaigns with victims in this industry were observed in October.

Observed campaigns were carried out by Turkish cybercriminals (CCTR2501, CCPH2501) and Chinese APT Leviathan, also known as APT40.
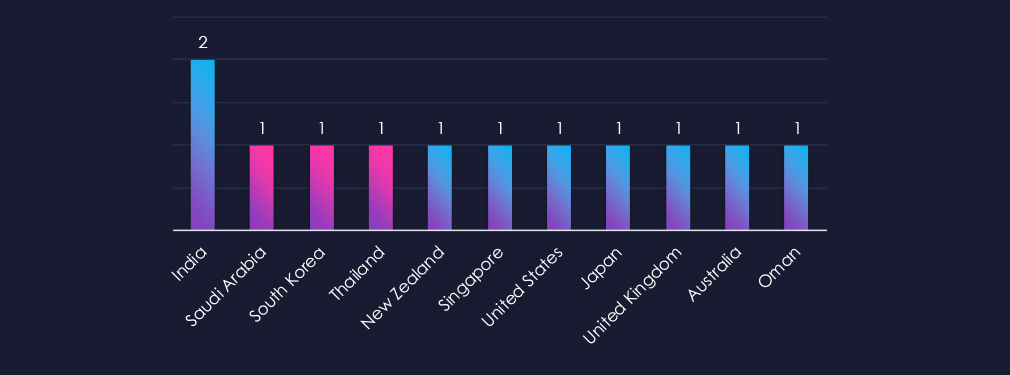
India recorded victims in both campaigns. Saudi Arabia, South Korea, and Thailand victims were recorded in the CCTR2501 campaign.
New Zealand, Singapore, the US, Japan, the UK, Australia, and Oman recorded victims in a campaign by Leviathan (APT40).
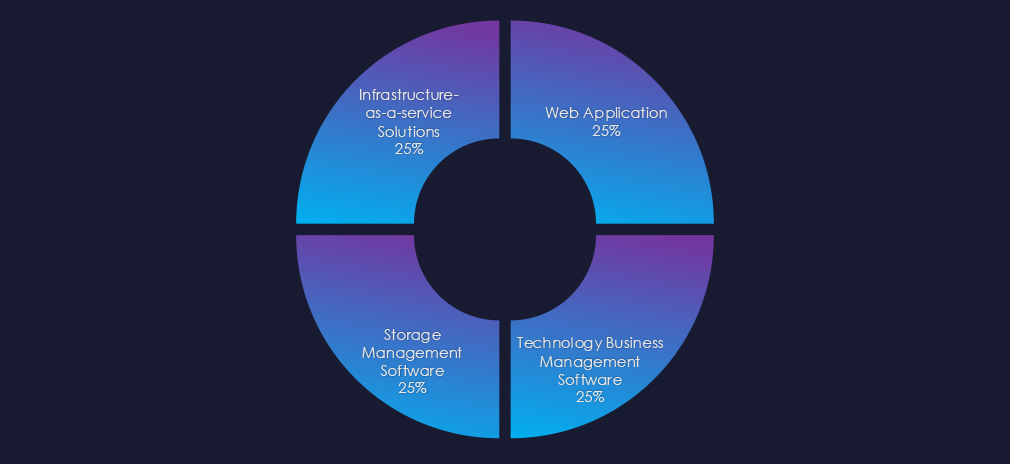
Turkish APT campaigns observed by researchers primarily targeted storage management, IaaS, and business management tools, while Leviathan focused on Web Apps.

Over the past 90 days, the materials industry has experienced declining disruptions due to advanced persistent threat (APT) campaigns. In the previous 90 days, the chemicals sector was unusually frequently targeted.
Out of the 18 observed APT campaigns, 2 targeted this industry, accounting for 11% of the total. This represents a decline from the previous 90-day period, during which 7 out of the 13 campaigns targeted this industry..
Monthly Trends:
Both observed APT campaigns were observed during October.
Key Threat Actors:
The campaigns were conducted by two identified Turkish cybercriminal entities (CCTR2501 and CCPH2501), as well as the Chinese advanced persistent threat group Leviathan, also referred to as APT40.
Geographical Impact:
India reported victims in both campaigns. Additional victims linked to the CCTR2501 campaign were identified in Saudi Arabia, South Korea, and Thailand. The campaign attributed to Leviathan (APT40) affected targets in New Zealand, Singapore, the United States, Japan, the United Kingdom, Australia, and Oman.
Targeted Technologies:
Turkish CCTR2501 campaigns primarily targeted storage management, IaaS, and business management tools, while Leviathan activity focused on web applications.
Over the past three months, CYFIRMA’s telemetry has identified 1,893 mentions of the materials industry out of a total of 71,137 industry mentions. This is from a total of 300k+ posts across various underground and dark web channels and forums.
The materials industry placed 10th out of 14 industries in the last 90 days, with a share of 2.66% of all detected industry-linked chatter.
Below is a breakdown by 30-day periods of all mentions.
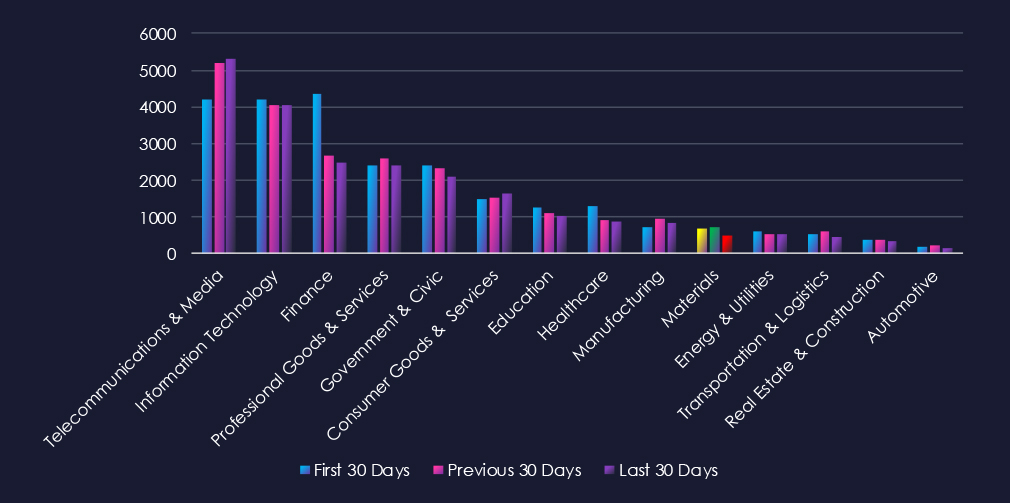

Data Leaks and Data Breaches are the most common category of recorded chatter for this industry. Both recorded a dip in activity during the last 30 days. Ransomware is the third most frequent category, and activity was sustained across the last 90 days. Notably, there is a spike in Claimed Hacks in the previous 30-day period.
In total, the materials industry comprises 2.66% of all detected industry underground and dark web chatter in the last 90 days. And ranking 10th out of 14 industries. Below are observed key trends across 90 days:
Data Breach
281 → 257 → 186, A steady decline across all periods. This suggests reduced successful intrusions or fewer breach disclosures involving materials suppliers, chemical producers, or mining companies. Attackers may be shifting toward higher-value manufacturing or logistics targets instead.
Data Leak
230 → 256 → 144, Similar downward pattern, with a sharp drop in the latest period. Indicates fewer leak postings or data resale events, potentially due to reduced targeting or more private, closed-channel monetization.
Ransomware
100 → 96 → 112, A renewed increase in the latest period after two near-flat months. This jump aligns with ransomware groups’ interest in industries where operational disruption can have an immediate financial impact (e.g., refining, processing, or materials supply chains).
DDoS
28 → 38 → 33, Elevated and fluctuating but generally high. Materials-sector entities—often linked to critical infrastructure—continue to face availability-based extortion or ideologically motivated disruption campaigns.
Claimed Hacks
12 → 57 → 9, Major spike mid-period followed by a return to low levels. The spike likely indicates a cluster of publicly claimed intrusions, while the drop suggests threat actors moved back to quieter access-broker models or simply had fewer high-profile successes.
Hacktivism
15 → 8 → 11, Moderate but persistent activity with slight rebound lately. Often tied to environmental, geopolitical, or resource-related activism targeting mining, refining, or chemical companies.
Web Exploit
5 → 12 → 3, Significant drop after a mid-period rise. Suggests attackers are finding fewer valuable web-facing weaknesses recently or shifting toward credential compromise and lateral movement instead of pure web exploitation.
Over the past three months, CYFIRMA’s telemetry has identified only 26 mentions of the materials industry out of a total of 3,034 industry mentions. This is from over 10k CVEs reported and updated in the last 90 days. However, due to major overlap in technology used with manufacturing, we also point towards 115 manufacturing mentions.
The materials industry ranked 13th out of 14 industries in the last 90 days, with a share of 0.86% of all detected industry-linked vulnerabilities. (8th out of 14 and 4.7% including manufacturing)
Below is a breakdown by 30-day periods of all mentions.
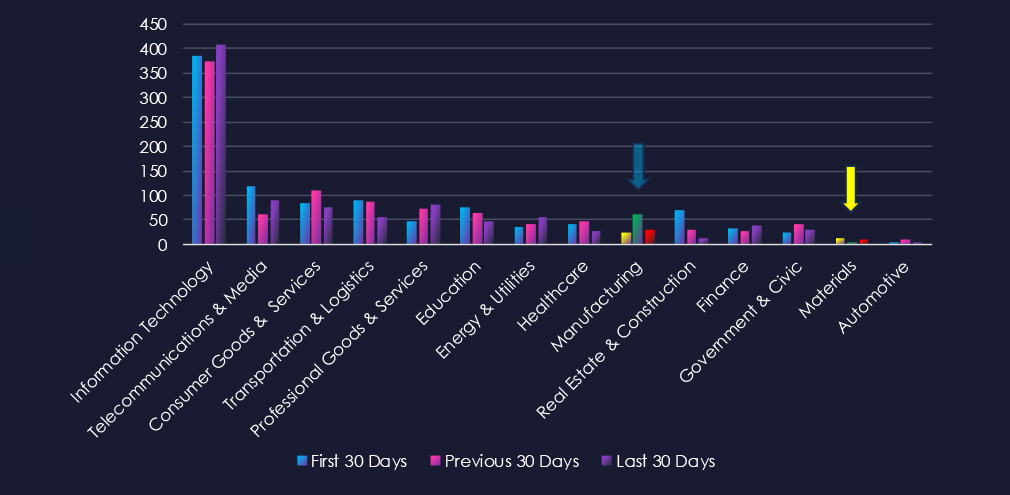
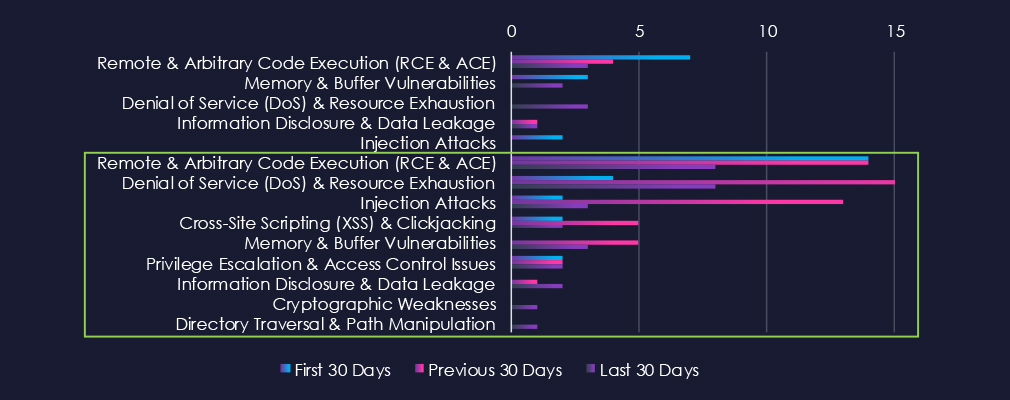
Remote & Arbitrary Code Execution (RCE & ACE) were most prominent in the materials industry. Including the overlapping manufacturing sector (green box). Denial of Service (DoS) & Resource Exhaustion vulnerabilities are in second place, as they recorded a spike during the previous 30 days. Injection attacks are third, with a spike during the previous 30 days.

In total, the materials industry comprises 0.87% of all detected industry-linked vulnerabilities in the last 90 days. And ranking 13th out of 14 industries. However, in the breakdown below, we also include the overlapping manufacturing (3.79% of industry mentions). Below are observed key trends across 90 days.
Remote & Arbitrary Code Execution (RCE & ACE)
21 → 18 → 11, A steady downward trend. While still one of the most critical vulnerability classes for industrial systems, disclosures have tapered, suggesting fewer newly discovered high-impact remote execution flaws or that earlier waves of OT/ICS research have slowed.
Memory & Buffer Vulnerabilities
3 → 5 → 5, Rising and holding. These vulnerabilities remain common in legacy industrial control equipment and embedded systems typical in materials and manufacturing operations.
Denial of Service (DoS) & Resource Exhaustion
4 → 21 → 11, A major mid-period spike followed by a decline — but still elevated compared to the first period. This reflects intensified researcher focus on availability risks in OT environments, where disruption can halt physical operations.
Information Disclosure & Data Leakage
0 → 2 → 3, A gradual increase. While not a dominant vulnerability type, more disclosures are emerging where sensitive configuration or operational data could be exposed.
Injection Attacks
4 → 13 → 3, A significant mid-period spike followed by a sharp decline. Suggests targeted research periods focusing on industrial web interfaces, HMIs, and management consoles with input-parsing weaknesses.
Cross-Site Scripting (XSS) & Clickjacking
2 → 5 → 2, Stable and low overall. These web/UI-layer vulnerabilities appear sporadically, usually in vendor dashboards or management tools rather than core industrial systems.
Privilege Escalation & Access Control Issues
2 → 2 → 2, Flat and consistently low. Indicates only occasional findings related to role mismanagement or weak privilege boundaries in OT/IT hybrid systems.
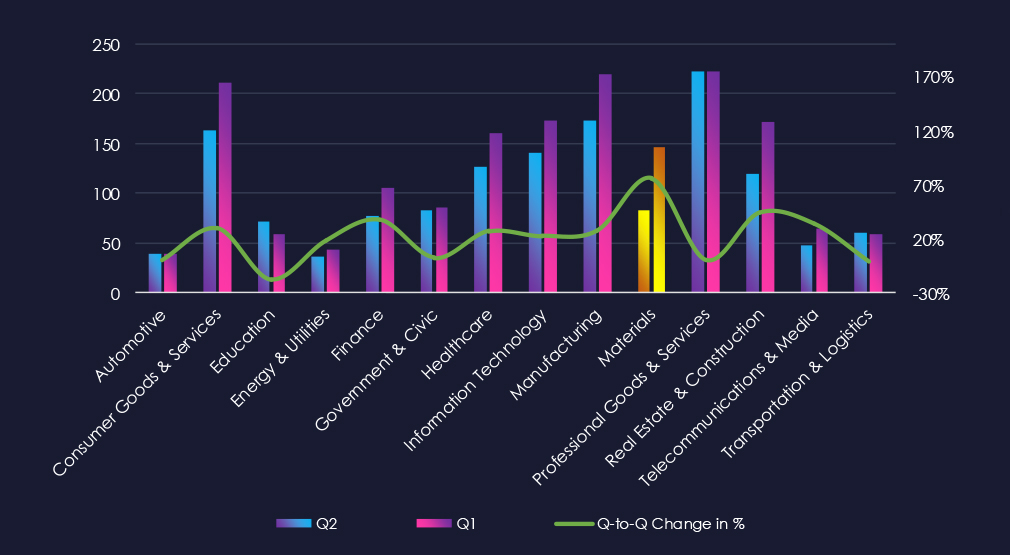
In the past 90 days, CYFIRMA has identified 146 verified ransomware victims in the materials industry. This accounts for 8.1% of the overall total of 1,1799 ransomware victims during the same period, placing the materials industry 7th out of 14 industries.

Furthermore, a quarterly comparison shows a significant jump in victims in the materials industry. The number of victims increased by 75.9%, from 83 to 146. The overall share of victims also jumped, growing from 5.57% to 8.12% of all victims.

On the monthly trendline over the past 180 days, we can clearly observe the doubling of the monthly average during October. Furthermore, we are in the middle of November, and the number of victims is already at 31.

A breakdown of monthly activity per gang provides insights into which gangs were active each month. For example, we can see Qilin and Sinobi being the main culprits behind the October spike. Meanwhile, Ransomhouse and Cl0p are contributing to the November count.

Out of the 71 gangs, 34 recorded victims in this industry in the last 90 days (48% participation). Qilin had the highest number of victims (28).
The share of victims for most gangs in this industry is moderate. From the top 10 gangs, five have 10%+, and Ransomhouse is reaching 22.7%, suggesting high focus.
Among the top gangs, Akira (13%), Play (14%), and The Gentlemen (13%) had the highest share of victims.

Steel & Iron Products, Specialty Chemicals, Metals & Mining, and Construction materials are the most frequent victims of ransomware in this industry.

The geographic distribution heatmap underscores the widespread impact of ransomware, highlighting the countries where victims in this industry have been recorded in the last 90 days.

The chart shows quarter-to-quarter changes in targeted countries. Data is sorted by the last 90 days and compared to the previous 90 days, marked in blue.
In the last 90 days, the USA recorded 77 victims (53% of all victims), a jump from 36 in the previous 90 days. Canada, Indonesia, Spain, Singapore, and France follow on top, all recording an increase in victims.

The materials industry placed 7th out of 14 monitored industries, recording 146 victims in the last 90 days. Major spike of 76% from 83 victims in the previous 90-day period.
Overall share also grew from 5.57% to 8.12% of all ransomware victims. Due to such elevation, the Materials Industry warrants a high-risk factor.
Monthly Activity Trends
After mostly sustained activity around 30 victims per month, October recorded a spike of 63 victims. November is also elevated with 31 victims so far.
Ransomware Gangs
A total of 34 out of 71 active ransomware groups targeted this industry in the past 90 days, representing a 38% participation:
Qilin: The most active, with 28 victims and 8% (28 out of 344) of all their victims. They recorded most victims due to the sheer volume of activity, rather than showing a high focus on this industry.
Ransomhouse: Highest shares of 22% (5 out of 22) victims among the top 10 gangs. Implying focus on the Materials sector.
Akira, Play, The Gentlemen: All ~13% share of their victims, high in the top 10 of most active gangs in this industry.
Geographic Distribution
The geographic distribution of ransomware victims is relatively high yet heavily concentrated in the USA, accounting for 53% of all victims.
Canada, Indonesia, Spain, Singapore, and France are behind the US, and all recorded an increase in victims.
In total, 32 countries recorded ransomware victims in this industry in the last 90 days, four more than 28 in the previous period.
For a comprehensive, up-to-date global ransomware tracking report, please refer to our new monthly “Tracking Ransomware” series here.
APT Campaigns (Low): Targeting of the materials sector fell sharply this period. Only 2 of 18 observed APT campaigns (11%) affected the industry, down from 7 of 13 previously. Both campaigns occurred in October. Threat activity was led by Turkish cybercriminal groups CCTR2501 and CCPH2501, and China’s Leviathan (APT40). India was impacted in both campaigns. CCTR2501 also hit Saudi Arabia, South Korea, and Thailand, while APT40 activity extended to New Zealand, Singapore, the US, Japan, the UK, Australia, and Oman. Turkish campaigns targeted storage management, IaaS, and business management platforms, while APT40 focused on web applications.
Underground & Dark Web Chatter (Low): The sector accounted for 2.66% of industry chatter (10th of 14), continuing a decline in threat actor focus. Data breaches and leaks declined significantly, suggesting reduced successful intrusions or a shift to less public data monetization. Ransomware chatter rebounded in the latest period, pointing to renewed interest in disrupting processing and resource supply chains. DDoS activity remained elevated, consistent with ideological and extortion-driven targeting of mining, refining, and chemical firms. Claimed hacks spiked mid-period then dropped, likely reflecting a brief cluster of public intrusions. Hacktivism persisted and remains tied to environmental and geopolitical activism. Web exploit chatter dropped after a temporary rise, indicating fewer attractive exposed assets or a pivot toward credential and access brokerage.
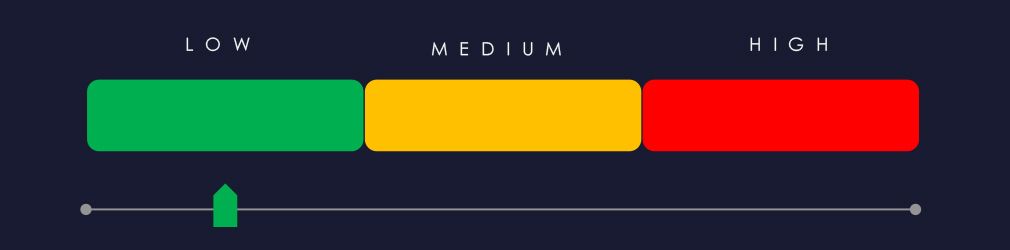
Vulnerabilities (Moderate): The sector represents 0.87% of industry-linked CVEs (13th of 14), though overlaps with manufacturing environments remain relevant. RCE disclosures declined but remain operationally critical. Memory and buffer flaws remain steady, consistent with legacy ICS/OT equipment. DoS vulnerabilities spiked mid-period, reflecting heightened scrutiny of availability risks in continuous processing environments. Injection disclosures surged mid-period, then fell sharply. Other categories saw low but ongoing findings, including data leakage, XSS, and access control weaknesses.
Ransomware (High): Ransomware surged, with 146 victims (+76%), placing the sector 7th of 14 and increasing its share from 5.57% to 8.12% of all observed ransomware. A major spike hit in October (63 victims), with continued elevation in November. 34 ransomware groups (38% of active) targeted the sector. Qilin was most active (28 victims, driven by scale, not industry focus). Ransomhouse showed the highest proportional focus (22% of its total victims), with Akira, Play, and The Gentlemen also showing elevated targeting. The US accounted for 53% of all victims, followed by increased activity in Canada, Indonesia, Spain, Singapore, and France. Impact reached 32 countries, up from 28.