

The CYFIRMA Industry Report delivers original cybersecurity insights and telemetry-driven statistics of global industries, covering one sector each week for a quarter. This report focuses on the materials industry, presenting key trends and statistics in an engaging infographic format.
Welcome to the CYFIRMA infographic industry report, where we delve into the external threat landscape of the materials industry over the past three months. This report provides valuable insights and data-driven statistics, delivering a concise analysis of attack campaigns, phishing telemetry, and ransomware incidents targeting materials organizations.
We aim to present an industry-specific overview in a convenient, engaging, and informative format. Leveraging our cutting-edge platform telemetry and the expertise of our analysts, we bring you actionable intelligence to stay ahead in the cybersecurity landscape.
CYFIRMA provides cyber threat intelligence and external threat landscape management platforms, DeCYFIR and DeTCT, which utilize artificial intelligence and machine learning to ingest and process relevant data, complemented by manual CTI research.
For the purpose of these reports, we leverage the following data from our platform. These are data processed by AI and ML automation based on both human research input and automated ingestions.
While this report contains statistics and graphs generated primarily by automation, it undergoes thorough review and enhancement for additional context by CYFIRMA CTI analysts to ensure the highest quality and provide valuable insights.
Over the past 90 days, the Materials industry appeared in 3 out of the 10 observed campaigns, representing a presence in 30% of all activity. This marks an increase from 0 in the previous 90-day period, and a notable jump in overall share from 0% (0 out of 6).
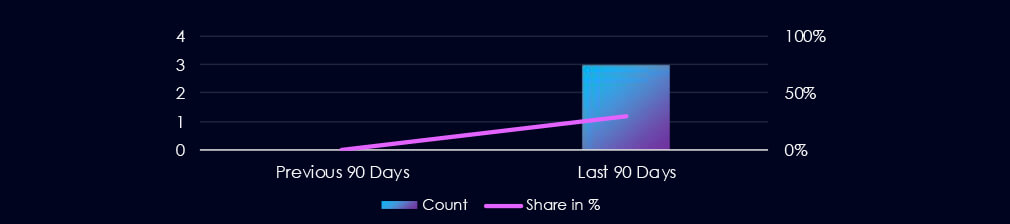
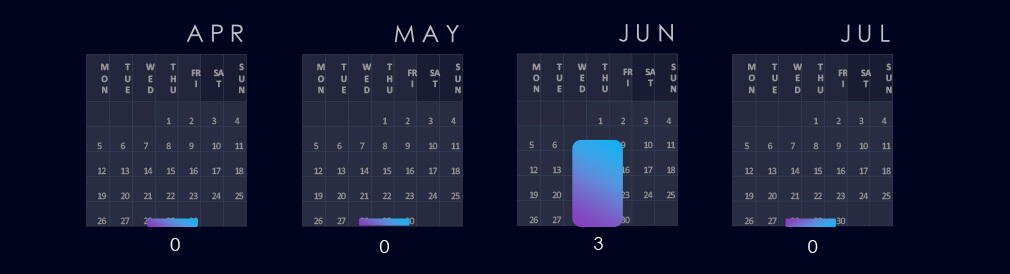
All three observed campaigns were active during June.

The observed campaigns were carried out by Turkish and Philippine-linked cybercriminals (CCTR2501, CCPH2501) and a suspected nation-state-linked English-speaking group (NSEN2401).
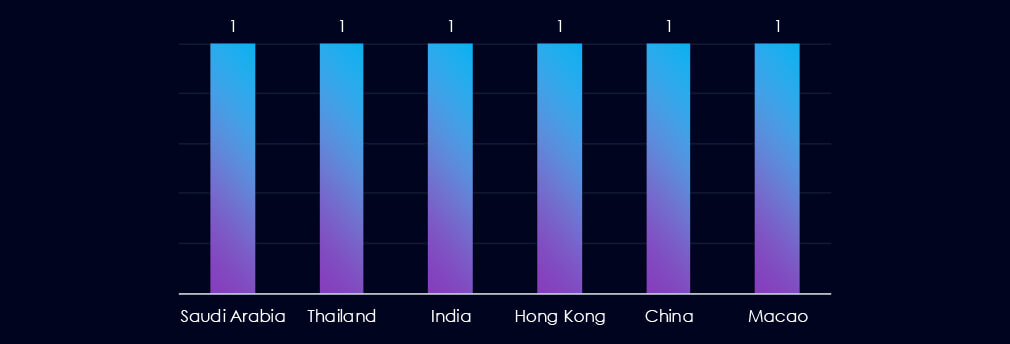
None of the countries recorded victims in more than one campaign. Philippine-linked group targeted China, Hong Kong, and Macao. The Turkish group targeted Saudi Arabia, and the English-speaking group Thailand and India.
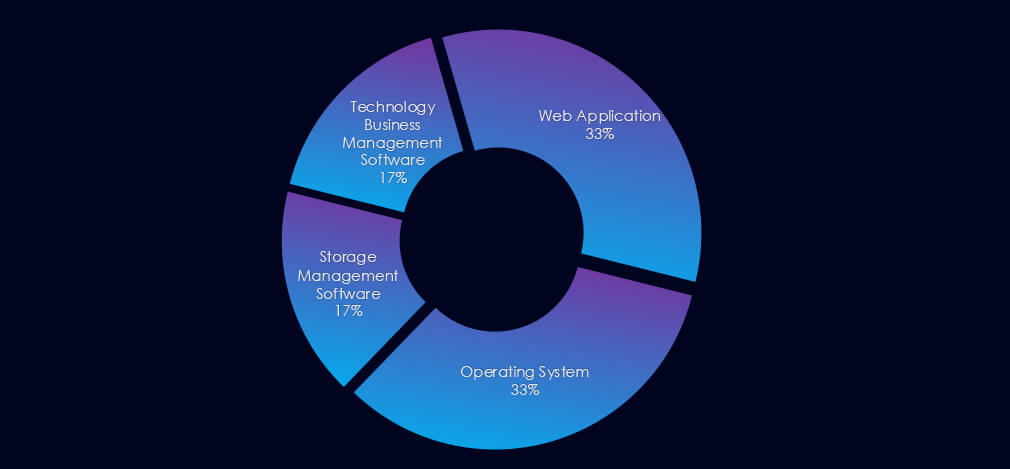
Turkish APT campaigns observed by researchers primarily targeted storage management and business management tools, while the other two focused on Web Apps and operating systems.

Over the past 90 days, the materials industry has experienced moderate disruptions due to advanced persistent threat (APT) campaigns, *particularly in the chemicals sector. Out of the 10 observed APT campaigns, three targeted this industry, accounting for 30% of the total. This represents an increase from the previous 90-day period, during which none of the six campaigns targeted this industry.
Monthly Trends:
All three observed APT campaigns were active during June.
Key Threat Actors:
Observed campaigns were carried out by Turkish and Philippine-linked cybercriminals (CCTR2501 and CCPH2501) and a suspected nation-state-linked English-speaking group (NSEN2401).
Geographical Impact:
None of the countries was involved in more than one campaign. The Philippines-linked cybercriminals targeted China, Hong Kong, and Macau, while the Turkish group targeted Saudi Arabia. The English-speaking group targeted Thailand and India.
Targeted Technologies:
Turkish APT campaigns observed by researchers primarily targeted storage management and business management tools. The other two campaigns focused on web applications and operating systems.
Over the past three months, CYFIRMA’s telemetry has identified 1,386 mentions of the materials industry out of a total of 57,390 industry mentions. This is from a total of 300k+ posts across various underground and dark web channels and forums.
The materials industry placed 12th out of 14 industries in the last 90 days with a share of 2.42% of all detected industry-linked chatter.
Below is a breakdown by 30-day periods of all mentions.
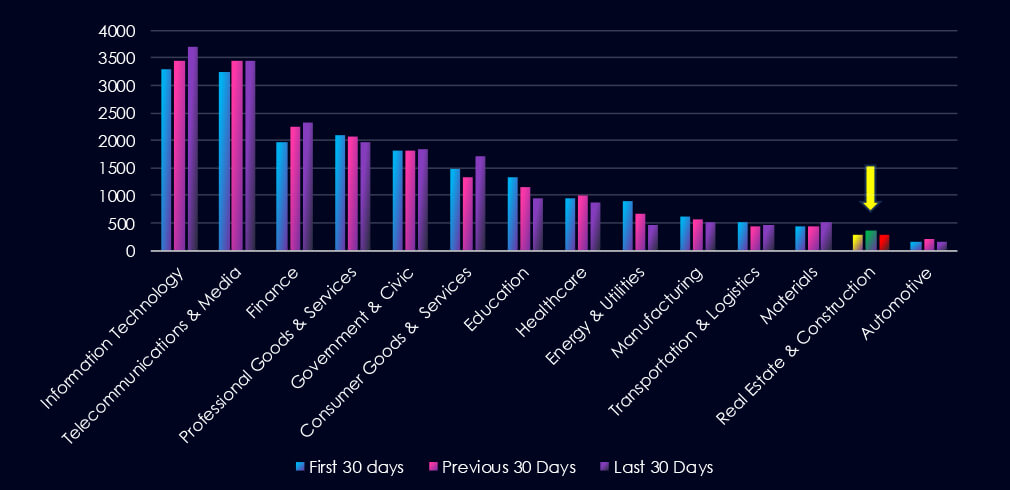
Data Leaks and Data Breaches are the most common category of recorded chatter for this industry. Data Breaches are the third most frequent category. Ransomware recorded a mild dip in the previous 30 days and rebounded into a spike in the last 30 days.

In total, the materials industry comprises 2.42% of all detected industry underground and dark web chatter in the last 90 days, ranking 12th out of 14 industries.
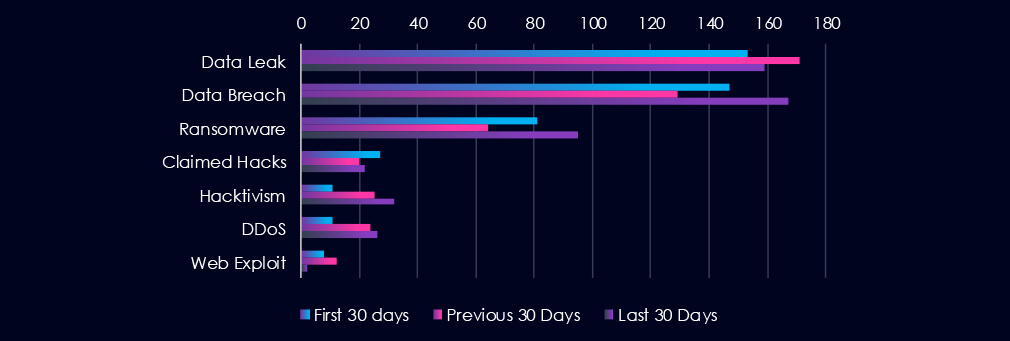
Below are the observed key trends across 90 days:
Data Leak
153 → 171 → 159, Elevated but relatively stable, suggesting ongoing third-party or insider-driven exposure of sensitive corporate or operational data.
Data Breach
147 → 129 → 167, After a slight dip, data breach chatter has sharply increased, signalling a rise in compromised access to internal systems or repositories.
Ransomware
81 → 64 → 95, Noticeable spike in the last 30 days, indicating renewed targeting of the industry by ransomware operators—potentially due to weak defences or supply chain leverage.
Claimed Hacks
27 → 20 → 22, Relatively consistent, showing ongoing low-level activity, likely stemming from smaller actors or unsuccessful exploit attempts being publicized.
Hacktivism
11 → 25 → 32, Rapid escalation suggests the industry may be increasingly targeted for ideological or environmental motives, possibly tied to extraction, pollution, or geopolitical concerns.
DDoS
11 → 24 → 26, A steady increase in disruption-focused attacks, likely used for sabotage or ransom demands. It could also reflect testing of critical infrastructure resiliency.
Web Exploit
8 → 12 → 2, Sharp decline, likely due to either patching efforts or shift away from web-facing vulnerabilities.
Over the past three months, CYFIRMA’s telemetry has identified only 19 mentions of the materials industry out of a total of 2,413 industry mentions. This is from over 10k CVEs reported and updated in the last 90 days. However, due to major overlap in technology used with manufacturing, we also point towards 94 manufacturing mentions.
The materials industry ranked 14th out of 14 industries in the last 90 days, with a share of 0.76% of all detected industry-linked vulnerabilities. (8th out of 14 and 4.5% including manufacturing).
Below is a breakdown by 30-day periods of all mentions.

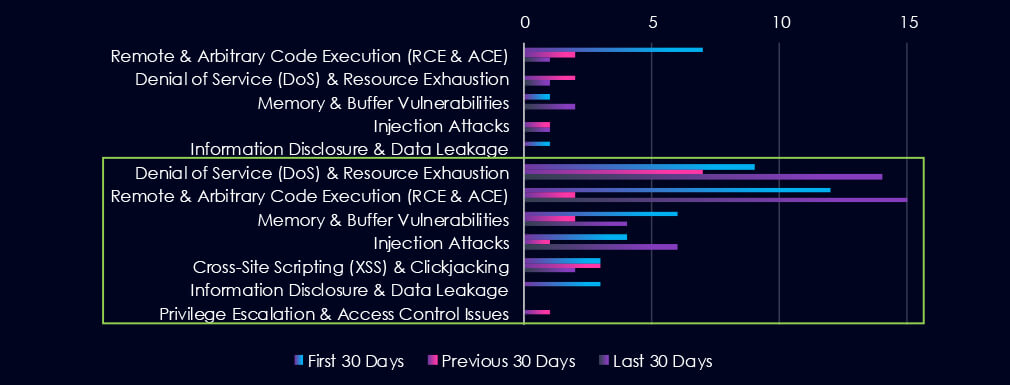
Remote & Arbitrary Code Execution (RCE & ACE) was most prominent in the materials industry. However, in the overlapping manufacturing sector (green box), Denial of Service (DoS) & Resource Exhaustion vulnerabilities are leading the chart, as they recorded a spike during the last 30 days. Remote & Arbitrary Code Execution (RCE & ACE) vulnerabilities are second with a dip in the previous 30 days.

In total, the materials industry comprises 0.76% of all detected industry-linked vulnerabilities in the last 90 days, ranking 14th out of 14 industries. However, in the breakdown below, we also include the overlapping manufacturing (3.74% of industry mentions).
Below are observed key trends across 90 days.
Remote & Arbitrary Code Execution (RCE & ACE)
19 → 4 → 16, After a sharp drop, RCE counts have spiked again, signalling the return of high-severity risks—especially threatening for any OT or ICS systems tied to material processing or logistics.
Denial of Service (DoS) & Resource Exhaustion
9 → 9 → 15, Now at the highest level in 90 days. This could reflect vulnerabilities in IoT, SCADA systems, or exposed APIs, which may be targets for disruption.
Injection Attacks
4 → 2 → 7, On the rise again—indicative of weak input validation in apps, platforms, or middleware, potentially allowing manipulation or database access.
Memory & Buffer Vulnerabilities
7 → 2 → 6, Rebounding slightly. These flaws can often be exploited for RCE or DoS in legacy software/hardware commonly found in manufacturing or extraction operations.
Cross-Site Scripting (XSS) & Clickjacking
3 → 3 → 2, Low and steady. Minor concern, but still relevant for web interfaces, internal dashboards, or supplier platforms.
Information Disclosure & Data Leakage
4 → 0 → 0, No recent disclosures—however, rising chatter around data breaches suggests that undisclosed or zero-day vectors may still be active.
Privilege Escalation & Access Control Issues
0 → 1 → 0, Minimal recent activity; may indicate effective access control policies, though low detection or reporting can’t be ruled out.
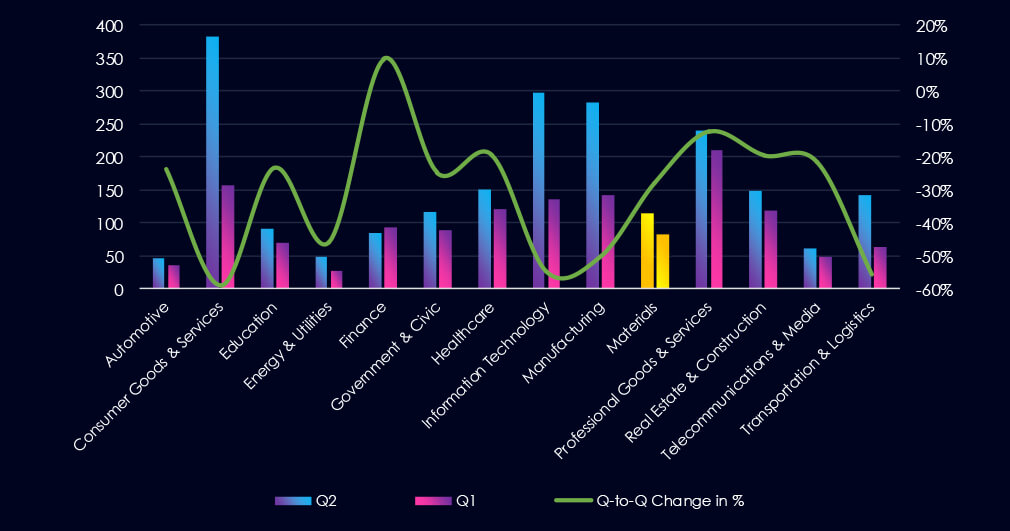
In the past 90 days, CYFIRMA has identified 82 verified ransomware victims in the materials industry. This accounts for 5.9% of the overall total of 1,385 ransomware victims during the same period, placing the materials industry 9th out of 14 industries.
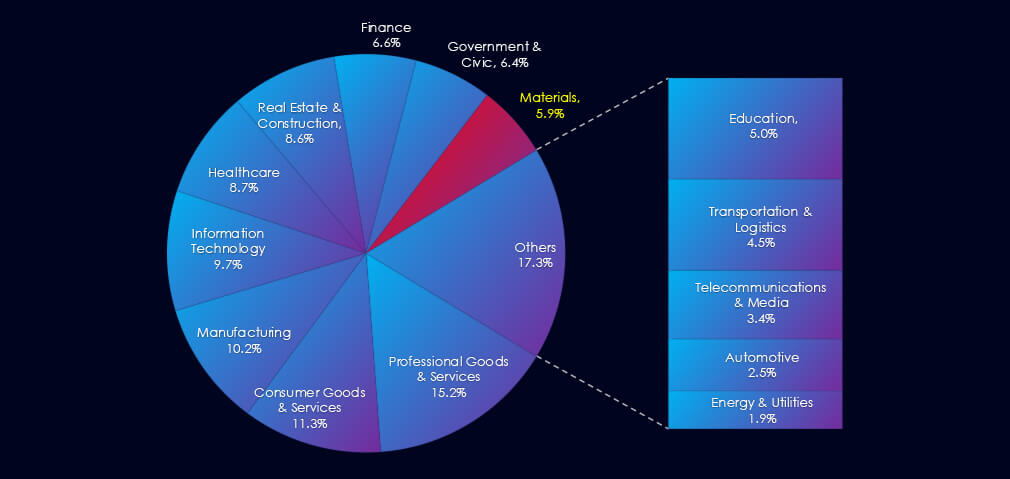
Furthermore, a quarterly comparison shows a significant decline in victims in the materials industry. The number of victims decreased by -28.1%, from 114 to 82. While the overall share of victims increased slightly, growing from 5.08% to 5.75% of all victims.
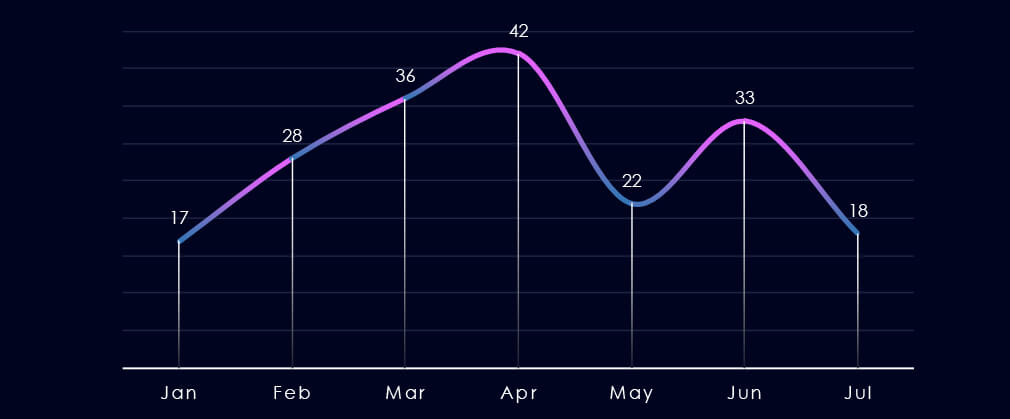
Over the past 180 days, ignoring partial months of January and July, we have observed gradual growth until a spike during April, then a sharp drop in May, and a return to 33 victims in June.
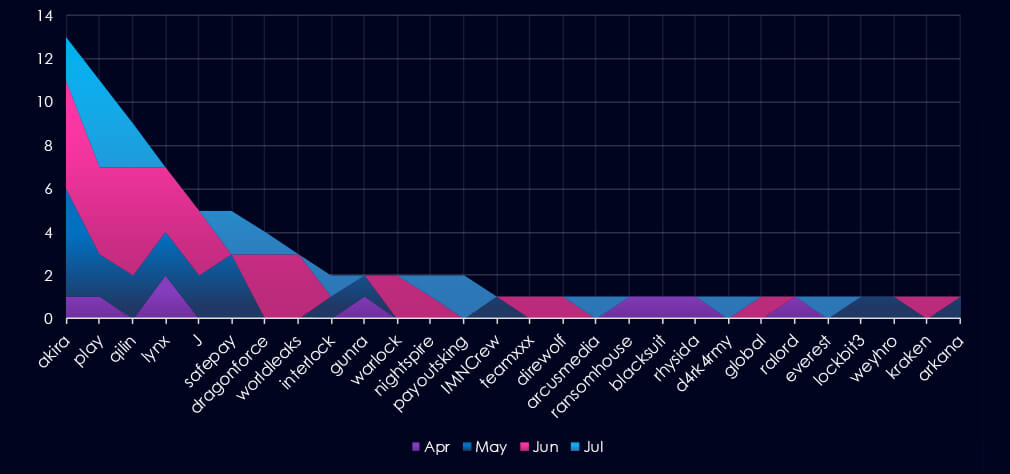
A breakdown of monthly activity per gang provides insights into which gangs were active each month. For example, the most active gangs, Akira, Play, and Qilin, were highly active across all months. On the other hand, gangs like Safepay or Dragonforce were active only in two out of four months.
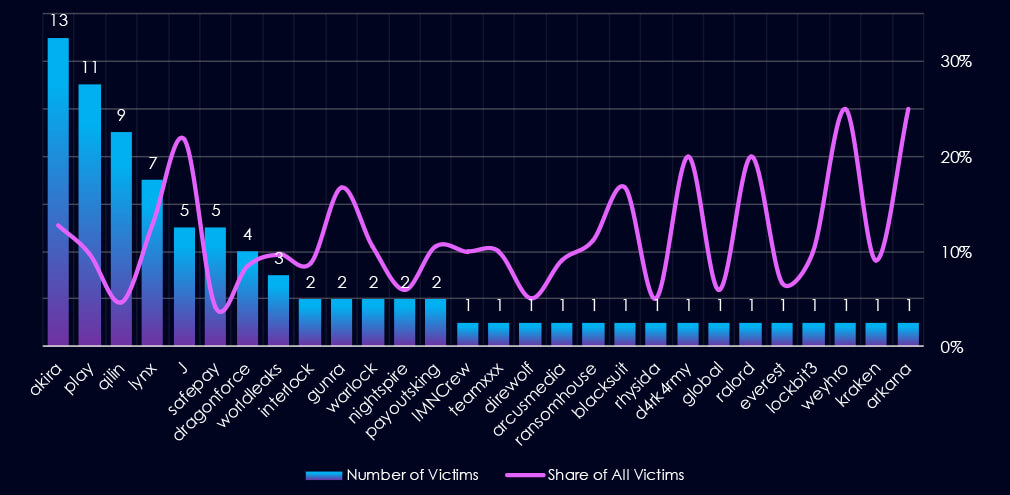
Out of the 73 gangs, 28 recorded victims in this industry in the last 90 days (38% participation). Akira had the highest number of victims (13).
The share of victims for most gangs in this industry is moderate. From the top 10 gangs, five have 10%+ and only two gangs recorded a share below 5%.
Among the top gangs, Akira (13%), Lynx (13%), and J (22%) had the highest share of victims, implying a higher focus on this industry.
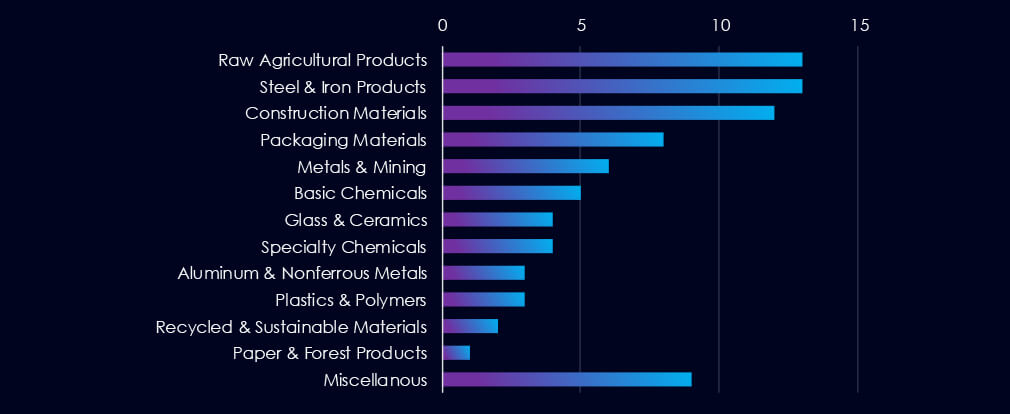
Raw Agricultural Products, Steel & Iron Products, and Construction materials are the most frequent victims of ransomware in this industry.
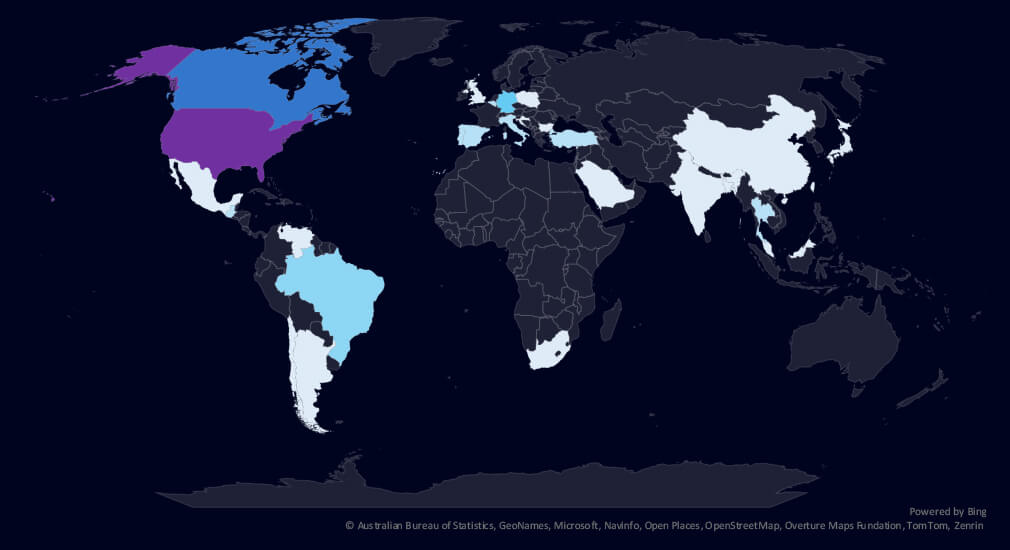
The geographic distribution heatmap underscores the widespread impact of ransomware, highlighting the countries where victims in this industry have been recorded in the last 90 days.
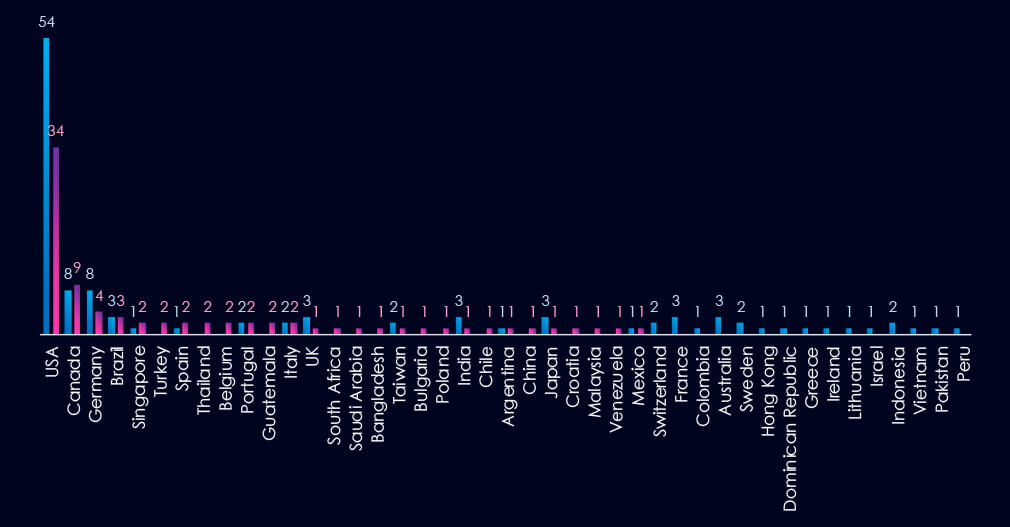
The chart shows quarter-to-quarter changes in targeted countries. Data is sorted by the last 90 days and compared to the previous 90 days, marked in blue.
In the last 90 days, the USA recorded 34 victims (41% of all victims), a drop from 54 in the previous 90 days. Canada, Germany, and Brazil follow at the top.

The materials industry placed 9th out of 14 monitored industries, recording 82 victims in the last 90 days, registering a major decrease of -28% from 114 victims in the previous 90-day period.
Overall share, however, increased, but only slightly from 5.08% to 5.75% of all ransomware victims.
Monthly Activity Trends
After a spike of activity in April, there was a dip during May, and a rebound followed during June.
Ransomware Gangs
A total of 28 out of 73 active ransomware groups targeted this industry in the past 90 days, representing a 38% participation:
Akira: The most active with 13 victims and 13% (13 out of 102) of all their victims.
Play: Second most active with 11 victims and a smaller 10% (11 out of 112) share.
J: Highest shares of 22% (5 out of 23) victims among top 10 gangs.
Geographic Distribution
The geographic distribution of ransomware victims is relatively high, yet heavily concentrated in the USA, accounting for 41% of all victims. Canada, Germany, and Brazil follow on top. Notably, there is a relatively high spread across countries, following less developed countries where mineral and other material resources are extracted and produced.
In total, 28 countries recorded ransomware victims in this industry in the last 90 days, one less than 29 in the previous period.
For a comprehensive, up-to-date global ransomware tracking report, please refer to our new monthly “Tracking Ransomware” series here.
APT Campaigns (Low): 3 out of 10 APT campaigns (30%) targeted the materials industry in the last 90 days, up from 0 previously. All were active in June. Actors included Turkish and Philippine cybercriminals (CCTR2501, CCPH2501) and an English-speaking suspected nation-state group (NSEN2401). Campaigns targeted China, Hong Kong, Macau, Saudi Arabia, Thailand, and India. Techniques varied—ranging from attacks on storage/business tools to web apps and OS-level intrusions.
Underground & Dark Web Chatter (Low): The industry represented 2.42% of total chatter, ranking 12th. Data leaks and breaches remain elevated; ransomware mentions spiked again in June. Hacktivism surged (↑191%)—likely tied to environmental or geopolitical motivations. DDoS attacks rose steadily, while web exploit chatter collapsed (↓83%), suggesting effective patching or vector shift.
Vulnerabilities (Moderate): Though accounting for only 0.76% of all CVEs (14th place), overlapping manufacturing CVEs raise concern. RCE (16) rebounded sharply—posing a risk to OT/ICS environments. DoS flaws reached 90-day highs (15), possibly tied to SCADA/API exposures. Injection and memory issues also climbed. XSS stayed low; no new data disclosure CVEs were observed, but risks persist given breach chatter.
Ransomware (Moderate): 82 victims (↓28% from 114 prior), ranking 9th overall. Despite the drop, the industry’s share rose slightly to 5.75%. Akira (13 victims), Play (11), and Qilin (5) were most active. Victims were highly geographically distributed—the USA (41%) led, followed by Canada, Germany, and Brazil. Attacks were more common in countries with resource extraction industries. The victim count declined by one to 28 countries total.