
The CYFIRMA Industry Report delivers original cybersecurity insights and telemetry-driven statistics of global industries, covering one sector each week for a quarter. This report focuses on the materials industry, presenting key trends and statistics in an engaging infographic format.
Welcome to the CYFIRMA infographic industry report, where we delve into the external threat landscape of the materials industry over the past three months. This report provides valuable insights and data-driven statistics, delivering a concise analysis of attack campaigns, phishing telemetry, and ransomware incidents targeting the materials industry.
We aim to present an industry-specific overview in a convenient, engaging, and informative format. Leveraging our cutting-edge platform telemetry and the expertise of our analysts, we bring you actionable intelligence to stay ahead in the cybersecurity landscape.
CYFIRMA provides cyber threat intelligence and external threat landscape management platforms, DeCYFIR and DeTCT, which utilize artificial intelligence and machine learning to ingest and process relevant data, complemented by manual CTI research.
For the purpose of these reports, we leverage the following data from our platform. These are data processed by AI and ML automation, based on both human research input and automated ingestions.
While this report contains statistics and graphs generated primarily by automation, it undergoes thorough review and enhancement for additional context by CYFIRMA CTI analysts to ensure the highest quality and provide valuable insights.
Materials organizations featured in 2 out of the 12 observed campaigns, which is a presence in 17% of all campaigns.

The number of observed APT campaigns peaked in September and since then we have not observed new campaigns with victims in the materials industry.
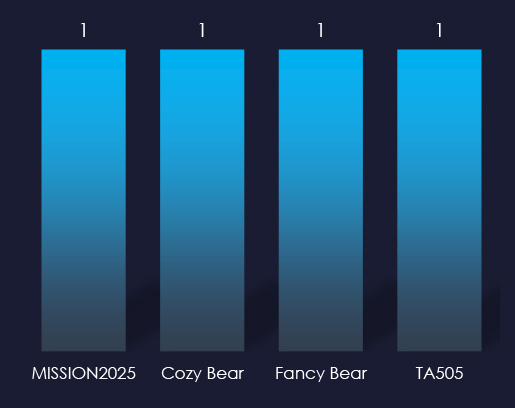
Despite observing only 2 campaigns, we have 4 suspected threat actors. One campaign is firmly attributed to the Chinese APT41 nexus of activities while the other shows overlapping TTPs of Russian Bears and the notorious Russian cybercrime syndicate TA505, also known to be linked to the government.
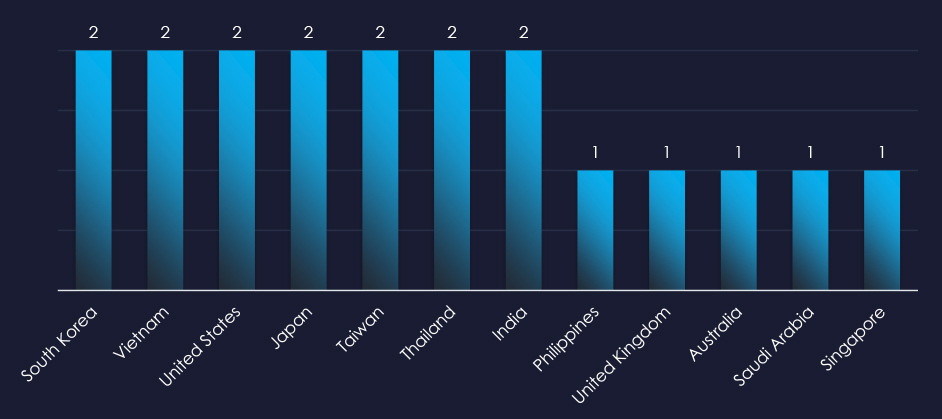
The recorded victims of observed attack campaigns span 12 countries. Significant focus appears to be on Asia-Pacific.

Most campaigns utilize Web Application attacks as a primary attack vector. This is also the case in both observed campaigns.
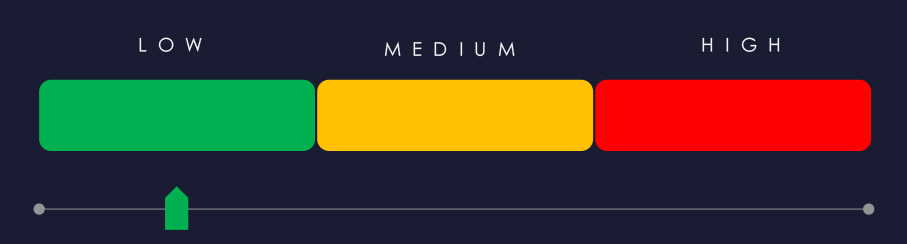
Risk Level Indicator: Low
In the past 90 days, materials organizations have not been significantly impacted by advanced persistent threat (APT) campaigns. Only 17% of observed APT campaigns recorded materials industry victims, with 2 out of 12 total campaigns.
Monthly Trends
Activity peaked in September and we have not observed new materials industry victims since.
Key Threat Actors
The materials industry, which includes mining and processing of critical natural resources, being a critical part of national security, attracts the attention of nation-state threat actors. However, it is largely an analog industry and not a frequent victim. Observed threat actors are from China and Russia. The TTPs of the latter are leaning toward financially motivated cybercrime syndicates.
Geographical Impact
The campaigns affected a total of 12 countries, mostly focusing on the Asia-Pacific region.
Targeted Technologies
Web applications remain the most frequently targeted technology and were used as the primary attack vector in both observed campaigns.
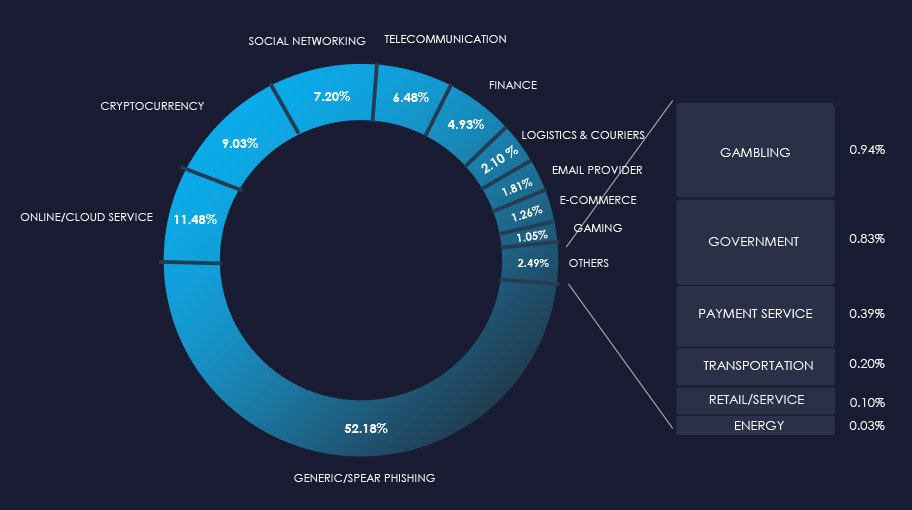
Over the past 3 months, CYFIRMA’s telemetry detected 0 phishing campaigns themed around the materials industry out of a total of 190,725.
The chart below illustrates the global distribution of observed themes. Due to a lack of materials industry detections in phishing themes, we do not track this industry as a category.
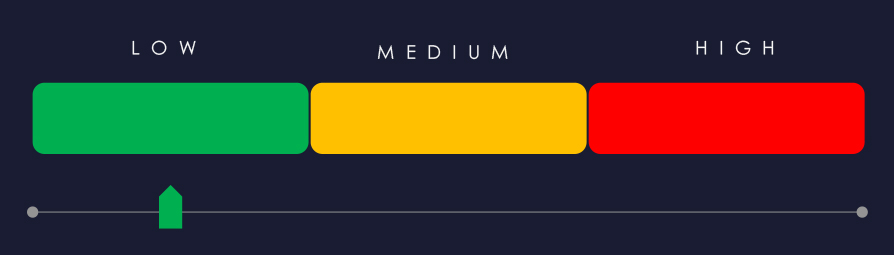
Risk Level Indicator: Low
Phishing in the materials industry continues to present a low-risk factor.
Beyond the occasional spear-phishing attempts by nation-state Advanced Persistent Threats (APTs) and ransomware groups, the materials sector still attracts minimal attention from broader phishing campaigns. Several reasons contribute to this ongoing assessment:
Complex Operations and Technology: The materials industry relies on specialized machinery, intricate production methods, and proprietary technologies. This complexity makes it difficult for cybercriminals to understand the environment, reducing the appeal of launching phishing campaigns when easier, more profitable targets are available.
Limited Valuable Personal Data: Unlike industries that handle significant volumes of personal or financial information—such as credit card numbers or social security details—the materials sector typically possesses minimal high-value data. With fewer opportunities for direct monetization, attackers often look elsewhere.
Absence of Large Customer Repositories: The materials industry generally maintains smaller customer databases. Large-scale phishing operations often depend on bulk personal data for profitable returns, a factor largely absent in this sector.
In summary, the materials industry remains a less attractive target for lower-level cybercriminals. Without meaningful financial incentives or the necessary conditions to facilitate lucrative phishing activities, the risk level remains consistently low this quarter.
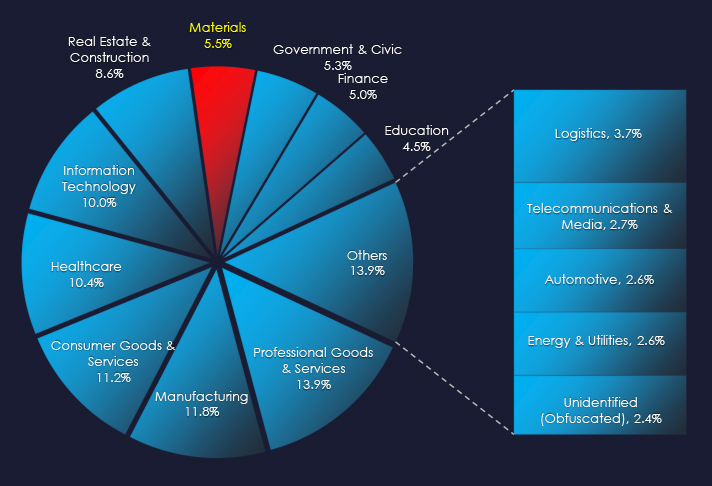
In the past 90 days, CYFIRMA has identified 92 verified ransomware victims in the materials industry. This accounts for 5.5% of the overall total of 1,684 ransomware victims during the same period, placing the materials industry as the 7th most frequent victim of ransomware.
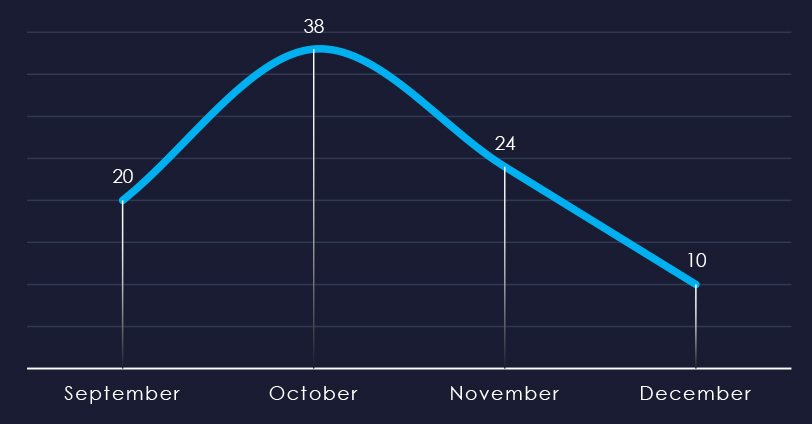
Over the past 90 days, number of victims mildly spiked in October, however adjusting for partial months, threat of ransomware is sustained.
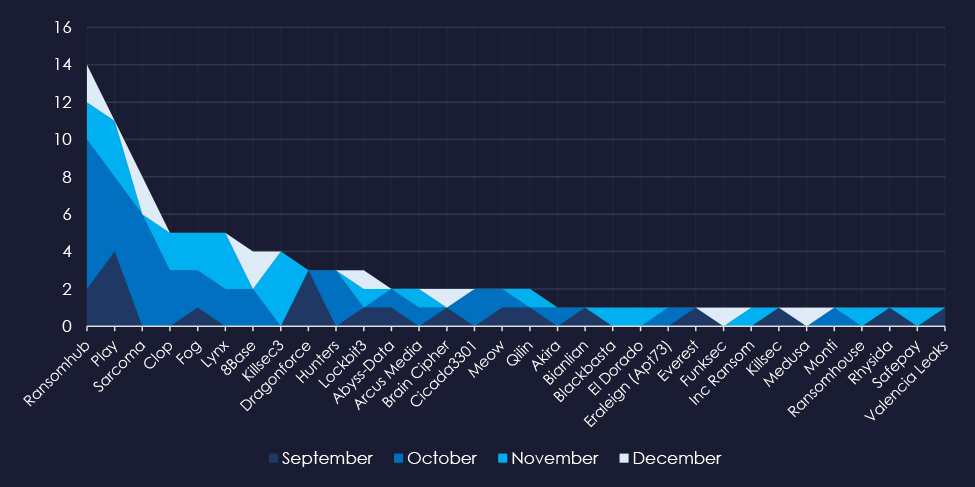
A breakdown of the monthly activity provides insights into which gangs were active each month. For example, RansomHub was very active in October and contributed to the observed spike. Play and Dragonforce were active in September, 8base only in October, and now December again.
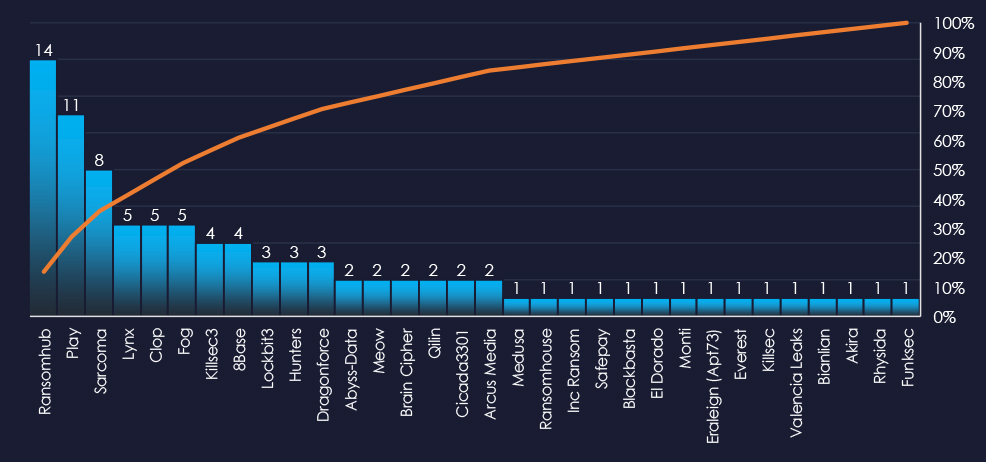
In total 32 out of 67 active groups recorded materials industry organizations victims in the past 90 days. That is a 48% participation. Notable is the relatively high distribution among a large number of groups in this period.
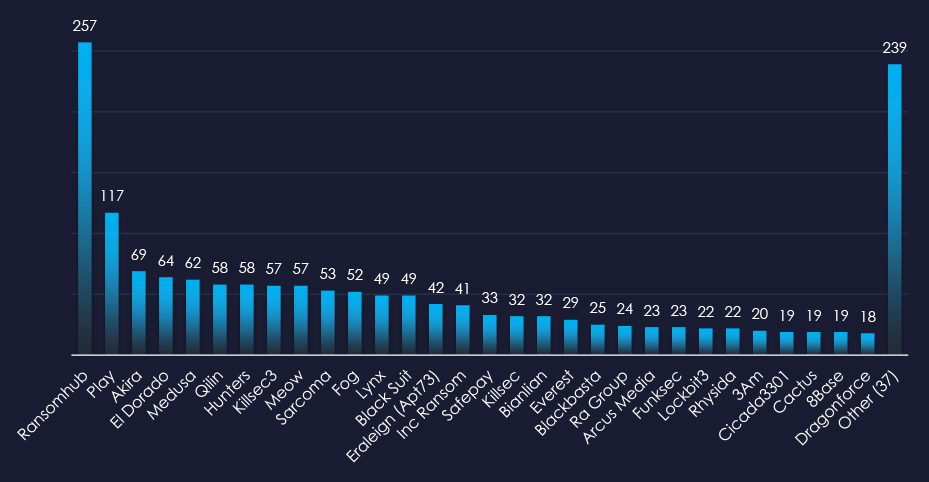
When comparing the materials industry to all recorded victims, RansomHub emerges with the highest number of victims overall. Additionally, Sarcoma shows the highest targeting of the materials sector, with 15% (8 out of 53) of their victims coming from this industry.
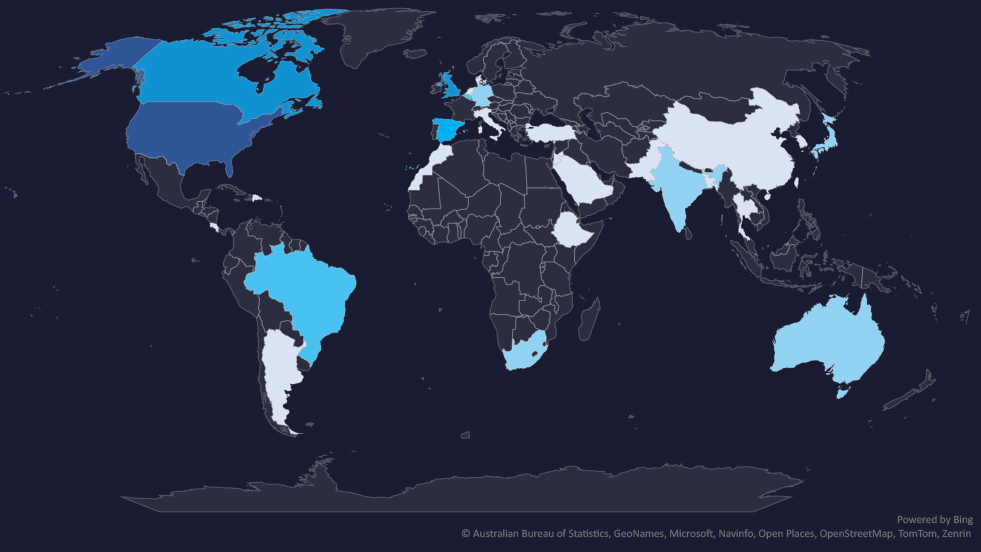
The geographic distribution heatmap underscores the widespread impact of ransomware, highlighting the countries where victims in this industry have been recorded.
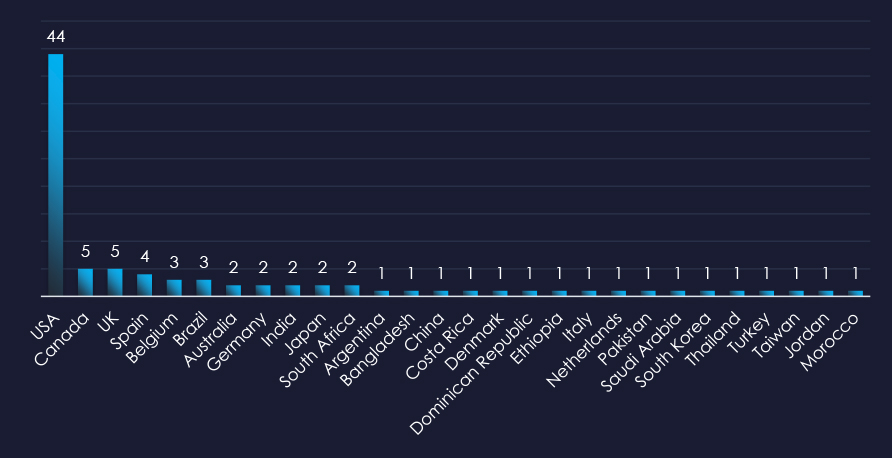
In total 28 countries recorded ransomware victims with the US alone accounting for ~52% of all victims with identified geography.

Risk Level Indicator: Moderate
The materials industry is placed as the 7th most frequent victim. It faces a sustained ransomware threat. Attacks affect a variety of sub-sectors and a broad geographic distribution. The steady monthly activity, coupled with the involvement of numerous ransomware groups, highlights the ongoing risk.
Monthly Activity Trends
Ransomware activity in the materials industry peaked in October but retained sustained numbers of victims across months.
Ransomware Gangs
A total of 32 out of 67 active ransomware groups targeted the materials industry in the past 90 days. Which is a 48% participation.
RansomHub: Recorded the most victims (14 out of 257, 5.4%), however, only due to the sheer volume, they do not show significant focus on this industry.
Sarcoma: The highest share of victims were from this industry with 15% (8 out of 53 victims).
The relatively even distribution among many groups indicates no single gang currently dominates the ransomware landscape in the materials sectors.
Geographic Distribution
The geographic distribution of ransomware victims in the materials industry reflects the industry’s global nature and the widespread reach of these attacks:
52% of all victims with identified geography are located in the US.
Notable is the presence in Africa and, Latin & Central America.
In total, 28 countries recorded ransomware victims in the materials industry.
For a comprehensive, up-to-date global ransomware tracking report, please refer to our new monthly “Tracking Ransomware” series here.
Over the past 3 months, CYFIRMA’s DECYFIR platform recorded 14,374 vulnerabilities with scores higher than 8. This is out of a total of 52,053 newly reported or updated vulnerabilities.
Filtered by relevant vendors, we have observed 699 vulnerabilities out of which 448 with a score of 8 or above, and were related specifically to the materials industry.
7 of those reported vulnerabilities have a known exploit.
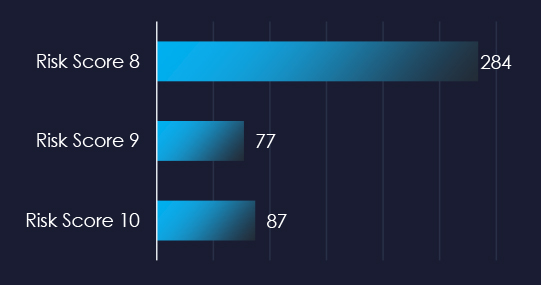
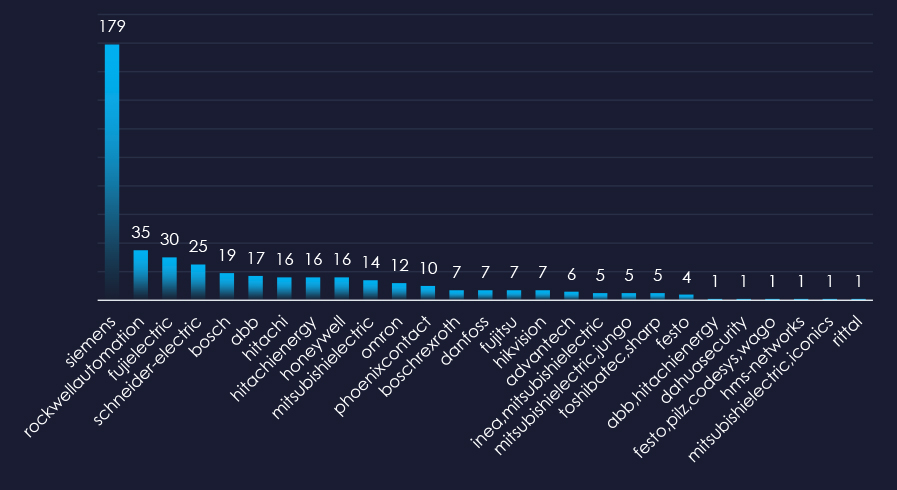
Siemens, Rockwell Automation, and Fuji Electric are top vendors with reported vulnerabilities with risk scores of 8 or above.
| Title | NIST LINK |
| SMU versions prior to 14.8.7825.01 are susceptible to unintended information disclosure through URL manipulation. Authenticated users in a Storage administrative role are able to access HNAS configuration backup and diagnostic data that would normally be barred to that specific administrative role. | https://nvd.nist.gov/vuln/detail/CVE-2023-5808 |
| SMU versions prior to 14.8.7825.01 are susceptible to unintended information disclosure through URL manipulation. Authenticated users in Storage Server or combined Server plus Storage administrative roles are able to access SMU configuration backup that would normally be barred to those specific administrative roles. | https://nvd.nist.gov/vuln/detail/CVE-2023-6538 |
| An issue was discovered on Mitsubishi Electric Europe B.V. ME-RTU devices through 2.02 and INEA ME-RTU devices through 3.0. An unauthenticated remote configuration download vulnerability allows an attacker to download the smartRTU’s configuration file (which contains data, such as usernames passwords, and other sensitive RTU data). | https://nvd.nist.gov/vuln/detail/CVE-2019-14927 |
| An issue was discovered on Mitsubishi Electric Europe B.V. ME-RTU devices through 2.02 and INEA ME-RTU devices through 3.0. An unauthenticated remote OS Command Injection vulnerability allows an attacker to execute arbitrary commands on the RTU due to the passing of unsafe usersupplied data to the RTU’s system shell. Functionality in mobile.php provides users with the ability to ping sites or IP addresses via Mobile Connection Test. When the Mobile Connection Test is submitted action.php is called to execute the test. An attacker can use a shell command separator (;) in the host variable to execute operating system commands upon submitting the test data. | https://nvd.nist.gov/vuln/detail/CVE-2019-14931 |
| Mitsubishi Electric Europe B.V. SmartRTU devices allow XSS via the username parameter or PATH_INFO to login.php. | https://nvd.nist.gov/vuln/detail/CVE-2018-16061 |
| Mitsubishi Electric Europe B.V. SmartRTU devices allow remote attackers to obtain sensitive information (directory listing and source code) via a direct request to the /web URI. | https://nvd.nist.gov/vuln/detail/CVE-2018-16060 |
| Improper Input Validation vulnerability in Honeywell PM43 on 32-bit ARM (Printer web page modules) allows Command Injection. This issue affects PM43 versions prior to P10.19.050004. Update to the latest available firmware version of the respective printers to version MR19.5 (e.g. P10.19.050006). | https://nvd.nist.gov/vuln/detail/CVE-2023-3710 |
Over the past 90 days, materials industry organizations have faced high to moderate cyber risks:
APT Campaigns: Only 17% (2 out of 12) of observed campaigns targeted this sector, with activity peaking in September and then declining. Threat actors from China and Russia were identified, focusing on Asia-Pacific countries and exploiting web applications.
Phishing: Phishing remains minimal due to the industry’s complexity, limited access to high-value personal data, and the absence of large customer repositories. Occasional spear-phishing by APT groups and ransomware operators occurs, but the sector’s specialized nature makes it an unattractive target for widespread phishing campaigns.
Ransomware: Placed as the 7th most frequent victim, the industry faces sustained ransomware activity across a broad geographical range, with 32 out of 67 groups (48%) showing involvement. While RansomHub claimed the most victims, Sarcoma displayed the strongest relative focus (15% of their victims were from this sector). Over half of the identified victims were located in the U.S., with notable cases in Africa and Latin & Central America.
Vulnerabilities: Of 52,053 reported vulnerabilities, 14,374 were high-severity (scored above 8). Specifically, 699 related to the materials industry were identified, with 448 scoring above 8. Seven of these vulnerabilities have known exploits and require immediate attention.