

The CYFIRMA Industry Report delivers original cybersecurity insights and telemetry-driven statistics of global industries, covering one sector each week for a quarter. This report focuses on the logistics industry, presenting key trends and statistics in an engaging infographic format.
Welcome to the CYFIRMA infographic industry report, where we delve into the external threat landscape of the logistics industry over the past three months. This report provides valuable insights and data-driven statistics, delivering a concise analysis of attack campaigns, phishing telemetry, and ransomware incidents targeting the logistics industry.
We aim to present an industry-specific overview in a convenient, engaging, and informative format. Leveraging our cutting-edge platform telemetry and the expertise of our analysts, we bring you actionable intelligence to stay ahead in the cybersecurity landscape.
CYFIRMA provides cyber threat intelligence and external threat landscape management platforms, DeCYFIR and DeTCT, which utilize artificial intelligence and machine learning to ingest and process relevant data, complemented by manual CTI research.
Includeing that we are only presenting verified data, no extrapolation, simulation or estimates
For the purpose of these reports, we leverage the following data from our platform. These are data processed by AI and ML automation based on both human research input and automated ingestions.
While this report contains statistics and graphs generated primarily by automation, it undergoes thorough review and enhancement for additional context by CYFIRMA CTI analysts to ensure the highest quality and provide valuable insights.
Logistics organizations featured in 5 out of the 11 observed campaigns, which is a presence in 45% of campaigns.
Observed Campaigns per Month

The monthly chart shows a significant drop in active campaigns since the spike in July.
Suspected Threat Actors
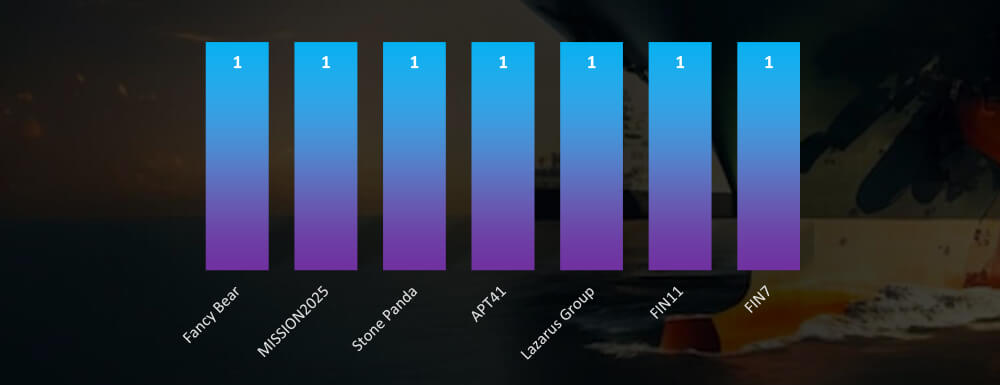
Accounting for overlaps between Mission2025 and Stone Panda both nation-state and financially motivated threat actors, including Lazarus Group are about evenly represented.
GEOGRAPHICAL DISTRIBUTION
Note: Due to the overlapping nature of monitoring telemetry, further breakdown beyond the top 10 countries is calculated for regions rather than individual countries to maintain clarity.
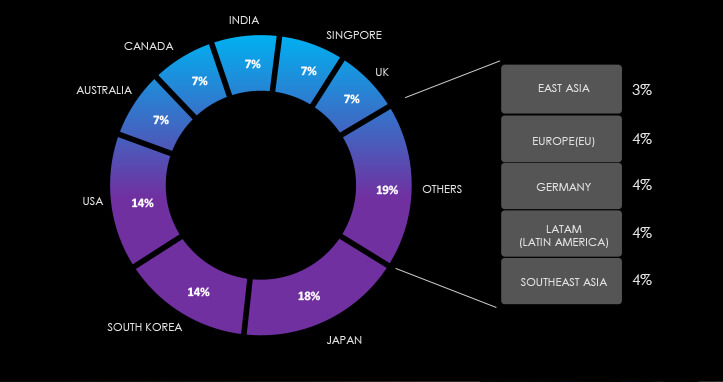
The EU, is most attacked region by a large margin, followed by Japan and the USA.
TOP ATTACKED TECHNOLOGY
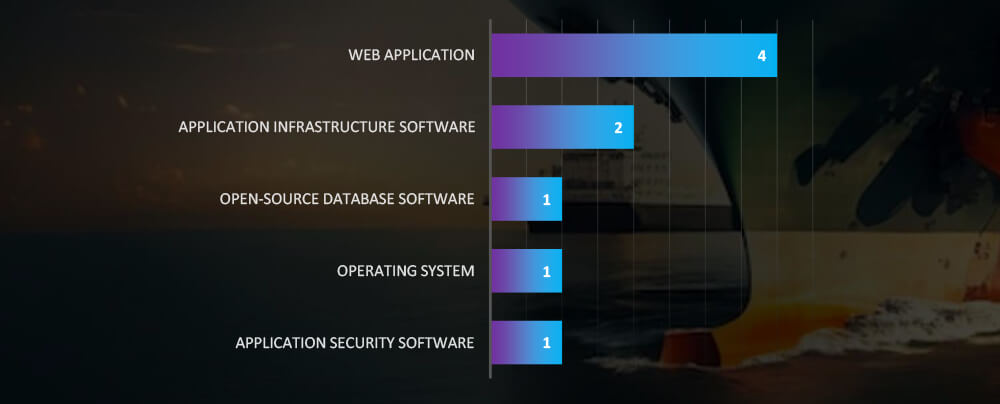
Web applications continue to be the most attacked technology across industries. While application infrastructure is of high interest in logistics industry.
Risk Level Indicator: Moderate

Monthly activity experienced a significant decline, since the summer spike caused by North Korean and Chinese threat actors. Since then, only a limited number of new campaigns have been discovered. Our telemetry data suggests a cyclical pattern, where newly identified TTPs result in a high number of discovered campaigns, followed by a period of relative calm. However, we assume that threat actors are still active, possibly temporarily withdrawn or using yet-to-be-detected TTPs.
Regarding suspected threat actors targeting logistics organizations, the landscape is evenly divided between financially motivated groups, including the well-known Lazarus Group, and entities like FIN11, FIN7, and TA505, alongside nation-state threat actors from China and Russia.
In terms of geographical impact, Japan is the most frequently targeted country, closely followed by the USA and South Korea. However, with only five incidents each spread across multiple countries, it’s challenging to draw insightful correlations.
Web applications continue to be the most common targeted technology for cyberattacks across various industries, with application infrastructure closely following in terms of vulnerability. Additionally, we’ve observed that database software in the logistics sector is targeted more frequently.
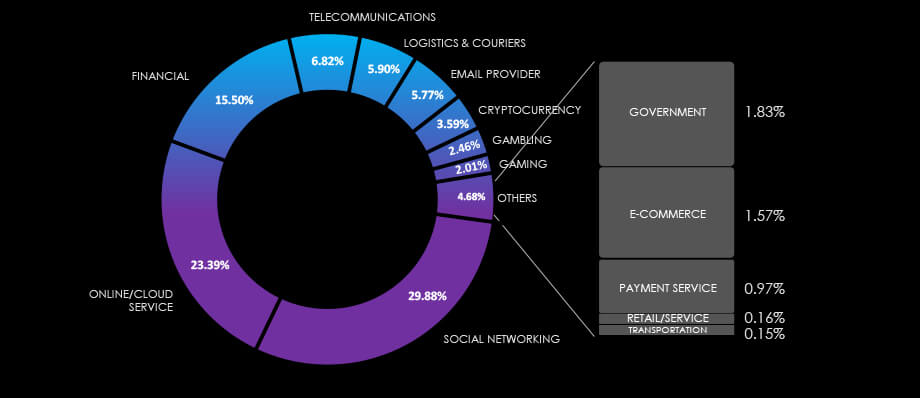
Over the past 3 months, CYFIRMA’s telemetry recorded 7,926 phishing campaigns out of a total of 208,993 that impersonated the logistics industry. As per the chart below, Logistics & Couriers’ share is 5.90% and Transportation has additional 0.15% of all observed themes CYFIRMA telemetry is tracking.
Global Distribution of Phishing Themes per Sector
Impersonated Logistics Industry Brands
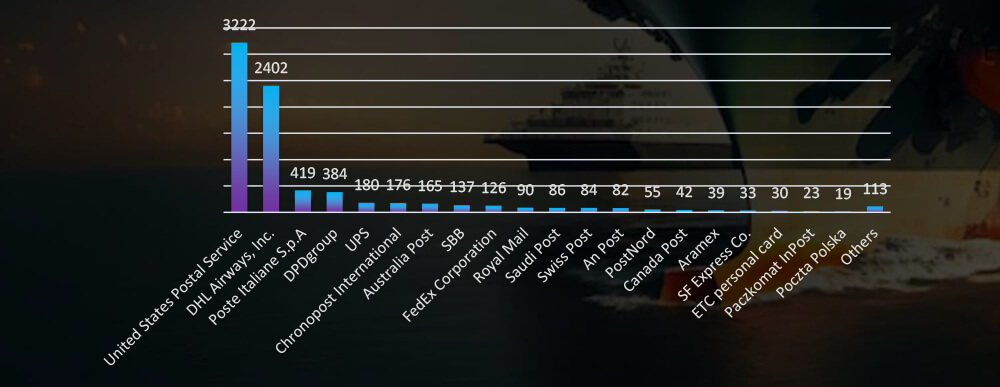
USPS and DHL Airways are by large margin the most impersonated brands in the logistics industry
Top 20 Countries of Origin
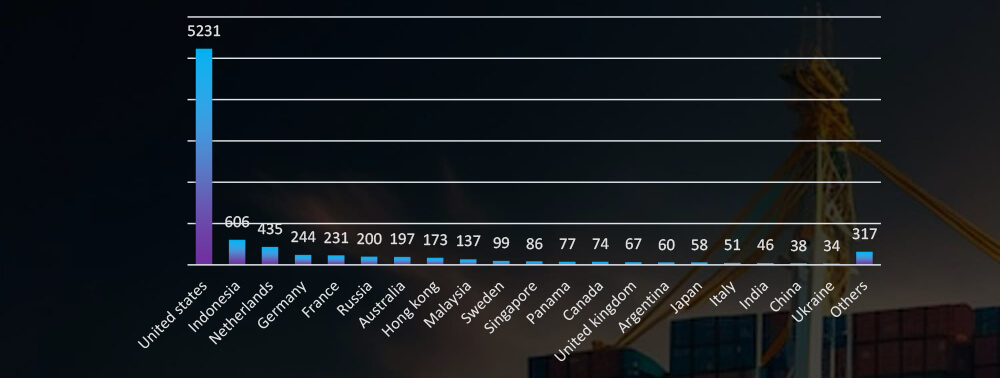
ASN-based origin of phishing campaigns shows a dominant US, followed by Indonesia and Netherlands
PHISHING EXTERNAL THREAT LANDSCAPE MANAGEMENT (ETLM) OVERVIEW
Risk Level Indicator: High
The logistics industry has recently emerged as the 5th most popular phishing lure. Various courier and delivery services have become ubiquitous worldwide, with companies like DHL achieving a truly global reach. Additionally, our telemetry data reveals that nearly every national postal service has been impersonated in phishing campaigns.
What’s particularly noteworthy is that logistics brands are often targeted in phishing attacks against both end-users and organizations.
In the past 90 days, CYFIRMA has identified 102 verified ransomware victims within the logistics industry sectors. This accounts for 6.4% of the overall total of 1,578 ransomware incidents during the same period.
The Monthly Activity Chart

Monthly trends show a significant spike above the average during September.
Breakdown of Monthly Activity by Gang
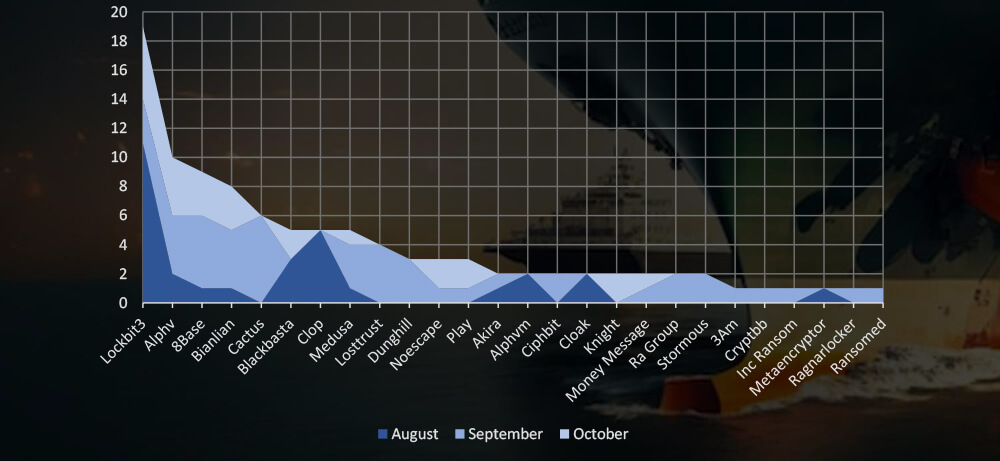
A breakdown of the monthly activity shows the Lockbit3 and Cl0p gang with their summer rampage behind the August spike. While ALPHV, 8base, Banlian Cactus and other smaller gangs were highly active in September.
Ransomware Victims in Logistics Industry per Group
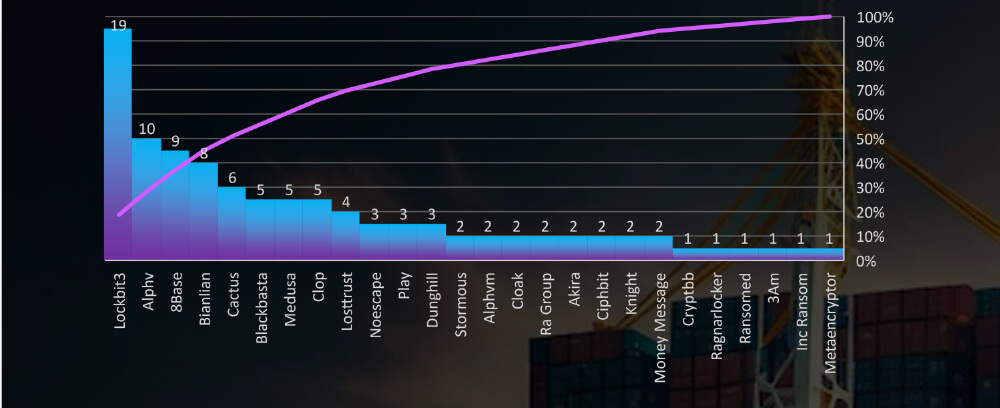
In total 26 groups recorded logistics organization victims in the past 90 days. The top 5 are responsible for half of them.
Comparison to All Ransomware Victims by Group (Top 25)
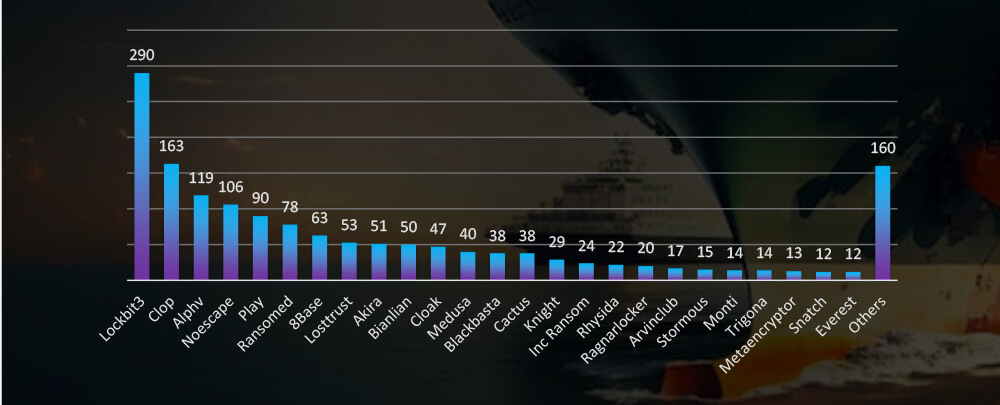
Compared to all recorded victims in the same time period, some groups, such as 8Base and Bianlian show higher share of logistics victims, implying heightened focus on this industry.
Geographical Distribution Of Victims
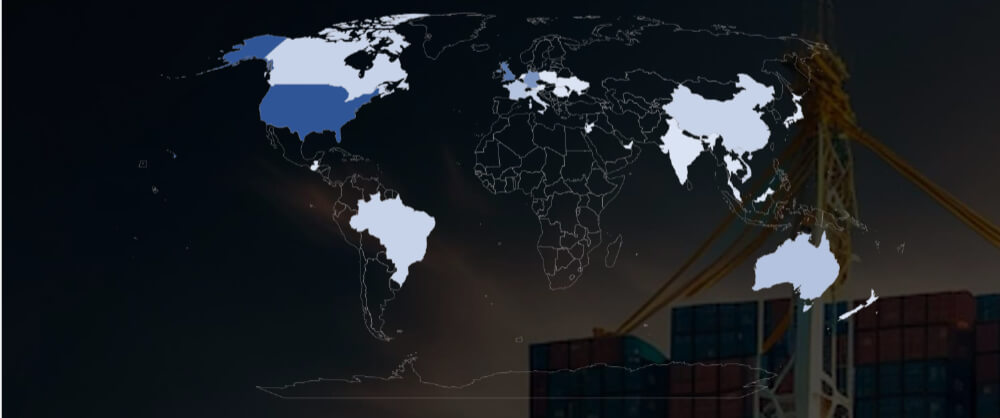
The heatmap of geographic distribution illustrates the global reach of ransomware across continents, mostly in developed economies.
Total Victims per Country
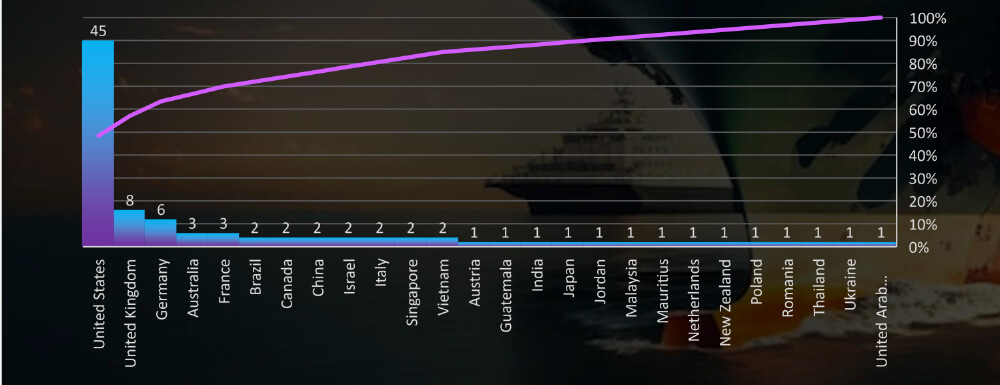
In total 26 countries recorded logistics industry ransomware victims with the US alone accounting for 90% of all.
Sectors Distribution
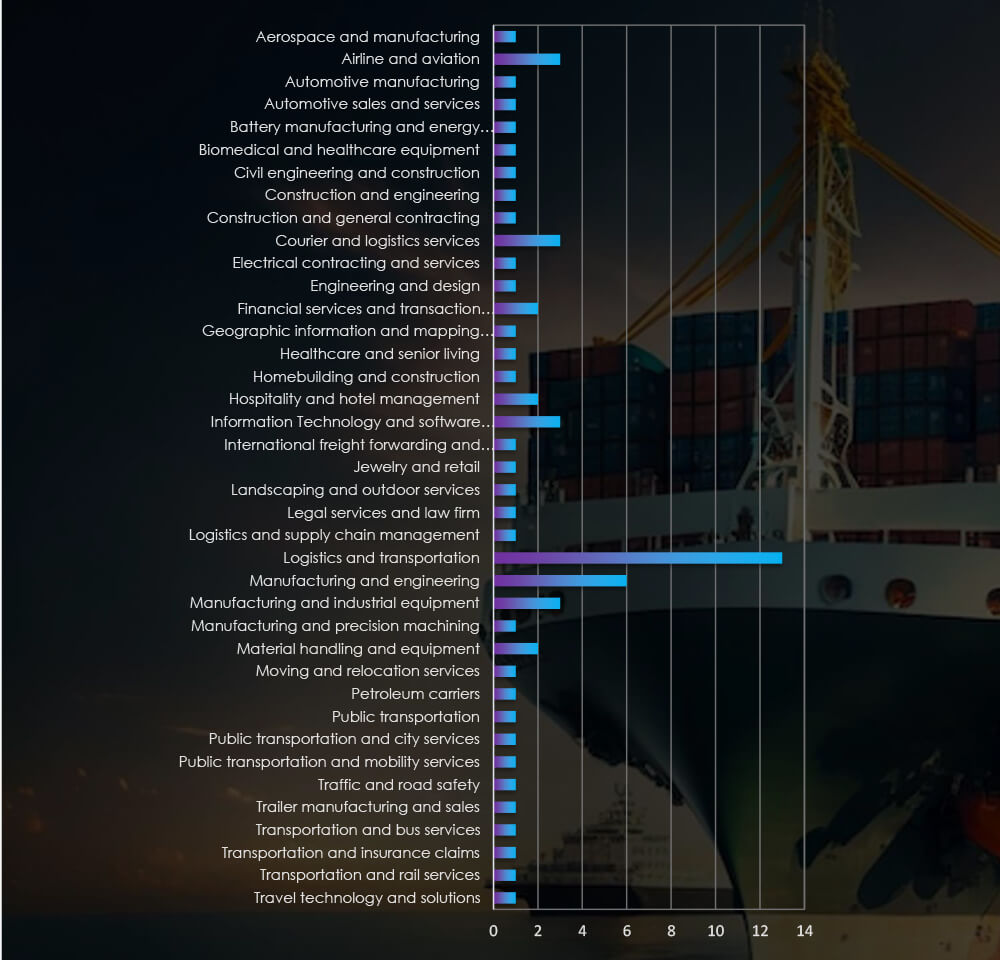
Listing all sectors matched under Logistics and Transportation Industry umbrella, including niches such as jewellery or elderly transport, various related manufacturing or IT services provided specifically for logistics companies.
Risk Level Indicator: Moderate

Monthly activity consistently reveals a substantial volume of cyberattacks, with a notable surge in September. A closer examination of the groups responsible for these attacks brings attention to the August rampage by the Lockbit3 and Cl0p gangs. In September, the ALPHV, along with 8Base, Bianlian, and other mid-size and smaller gangs, were responsible for a heightened number of victims.
Data on the total number of victims per group indicates the increasing share of mid-size ransomware gangs, with the top five accounting for half of all victims. Starting in September, we observed the emergence of many new or rebranded groups with a significant number of victims.
Out of the 55 active gangs in the past 90 days, 26 have specifically targeted the logistics industry. Notably, Lockbit3, ALPHV, 8Base, Bianlian, and Cactus have shown a keen interest in this sector.
Among the 93 victims with identified locations in 25 different countries, the United States ranks as the most affected, with 45 victims, followed by the UK and Germany. The United States remains the most targeted country across various industries, owing to its vast economy and diverse financial landscape. In the logistics industry, victims are scattered all around the world, with a particular focus on global logistics centers.
For a comprehensive, up-to-date global ransomware tracking report on a monthly basis, please refer to our new monthly “Tracking Ransomware” series here.
The logistics industry, being a critical part of infrastructure, confronts substantial risks from advanced threat actors. Our data reveals a consistent pattern of attacks across various regions, with a clear emphasis on developed economies and major global logistics hubs. Even as the detection of APT campaigns has declined, a correlation between the current geopolitical landscape and the most targeted countries remains evident.
The external threat landscape of the logistics sector is marked by the involvement of highly sophisticated groups. Notably, Chinese nation-state actors and prolific Russian ransomware gangs show a particular interest in the logistics sector. Furthermore, logistics has grown to be 5th most popular phishing theme used against both organizations and end-users.