
The CYFIRMA Industry Report delivers original cybersecurity insights and telemetry-driven statistics of global industries, covering one sector each week for a quarter. This report focuses on the Information Technology industry, presenting key trends and statistics in an engaging infographic format.
Welcome to the CYFIRMA infographic industry report, where we delve into the external threat landscape of the Information Technology industry over the past three months. This report provides valuable insights and data-driven statistics, delivering a concise analysis of attack campaigns, phishing telemetry, and ransomware incidents targeting the information Technology industry.
We aim to present an industry-specific overview in a convenient, engaging, and informative format. Leveraging our cutting-edge platform telemetry and the expertise of our analysts, we bring you actionable intelligence to stay ahead in the cybersecurity landscape.
CYFIRMA provides cyber threat intelligence and external threat landscape management platforms, DeCYFIR and DeTCT, which utilize artificial intelligence and machine learning to ingest and process relevant data, complemented by manual CTI research.
For the purpose of these reports, we leverage the following data from our platform. These are data processed by AI and ML automation, based on both human research input and automated ingestions.
While this report contains statistics and graphs generated primarily by automation, it undergoes thorough review and enhancement for additional context by CYFIRMA CTI analysts to ensure the highest quality and provide valuable insights.
Information Technology organizations featured in 9 out of the 12 observed campaigns, which is a presence in 75% of all campaigns.

After a mild spike in September, we observed a gradual decline in activity.
Observed threat actors are varied. While most are linked to China and Russia, we also observed Vietnamese, Pakistani, Iranian, North Korean, and English-speaking threat actors.
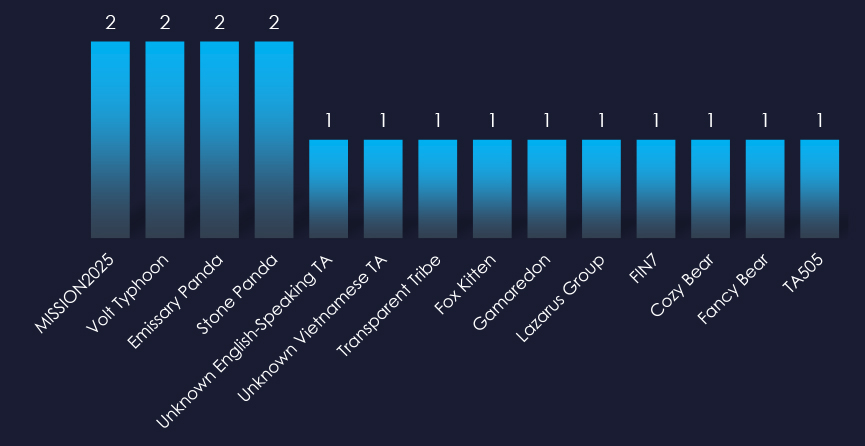
Recorded victims of observed attack campaigns span 15 different countries. Data correlates with known prominent IT industry hubs and geopolitical rivals of observed threat actors.
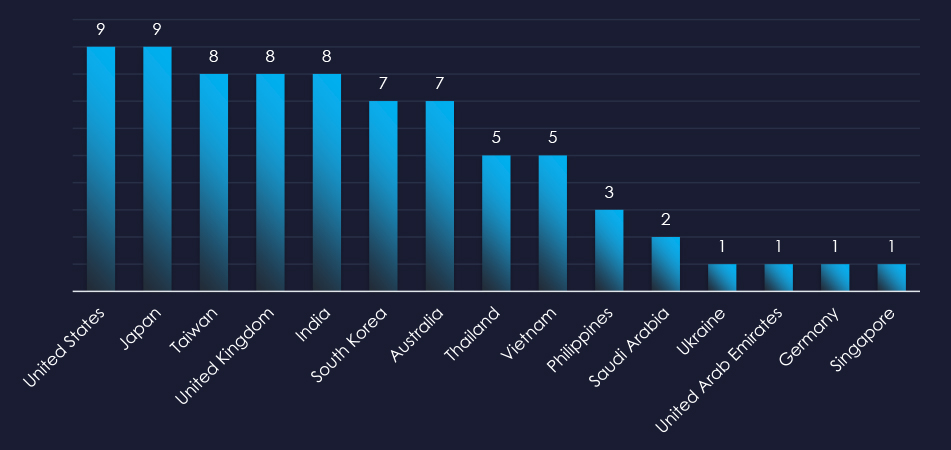
Along with web applications, we observed attacks against operating systems, routers, and VPN solutions.

Risk Level Indicator: High
In the past 90 days, IT organizations have been significantly impacted by advanced persistent threat (APT) campaigns. 75% of observed APT campaigns recorded IT industry victims, with 9 out of 12 total campaigns.
Monthly Trends
We observed a peak of activity in September and although slowing down, activity has been sustained since then, warranting a high risk factor.
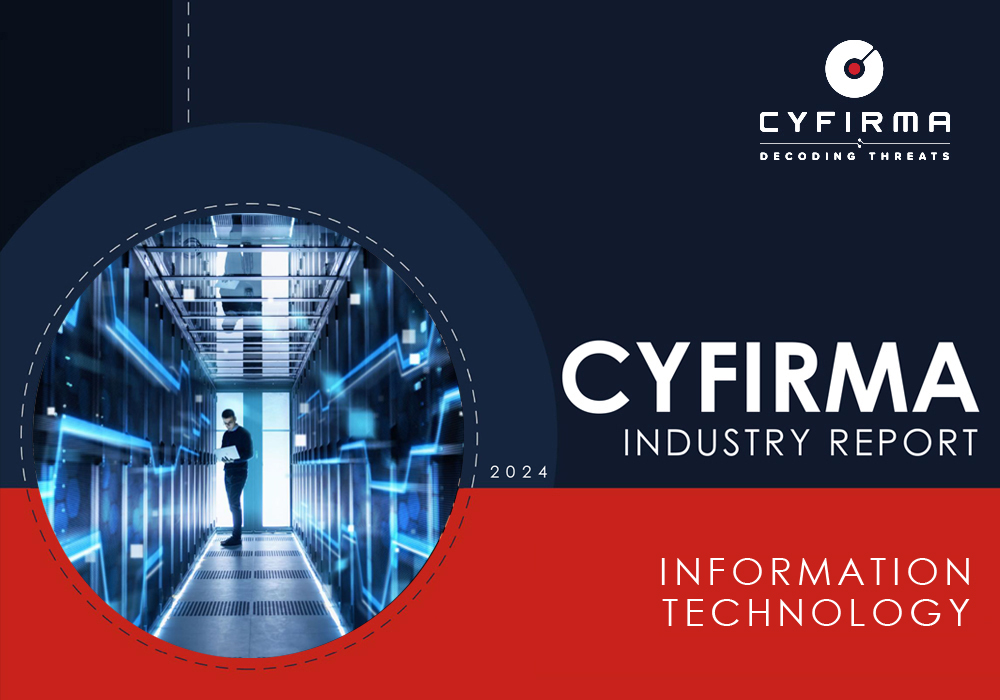
Key Threat Actors
The IT industry is crucial to global economics and geopolitics, making it a frequent target for both financially motivated cybercriminals and nation-state Advanced Persistent Threat (APT) groups.
Notable actors include China-based groups, such as Stone Panda (APT10), Emissary Panda (APT27), and Volt Typhoon. Russian-linked groups like FIN7 and Gamaredon have also been active in this sector.
Additionally, Pakistan’s Transparent Tribe (APT36), Iran’s Fox Kitten, and North Korea’s Lazarus Group have targeted the IT industry.
There are also threats from English and Vietnamese-speaking actors which remain unattributed.
Geographical Impact
Cyber campaigns have impacted 15 countries, with those possessing substantial digital economies and trade—such as the United States, the United Kingdom, Japan, Taiwan, and India—being frequent targets. Notably, Vietnam has experienced increased cyber activity.
Targeted Technologies
Web applications, operating systems, routers, and VPN solutions have been attacked in observed campaigns.
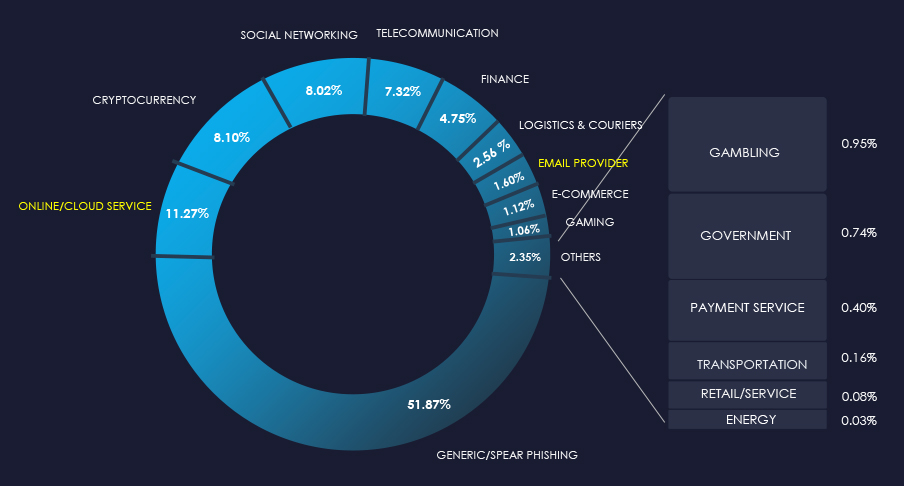
Over the past 3 months, CYFIRMA’s telemetry detected 24,492 phishing campaigns themed around the Information Technology Industry out of a total of 190,339.
The chart below illustrates the global distribution of observed themes. Observed combined IT-related phishing accounts for 12.87% of all captured phishing attempts.
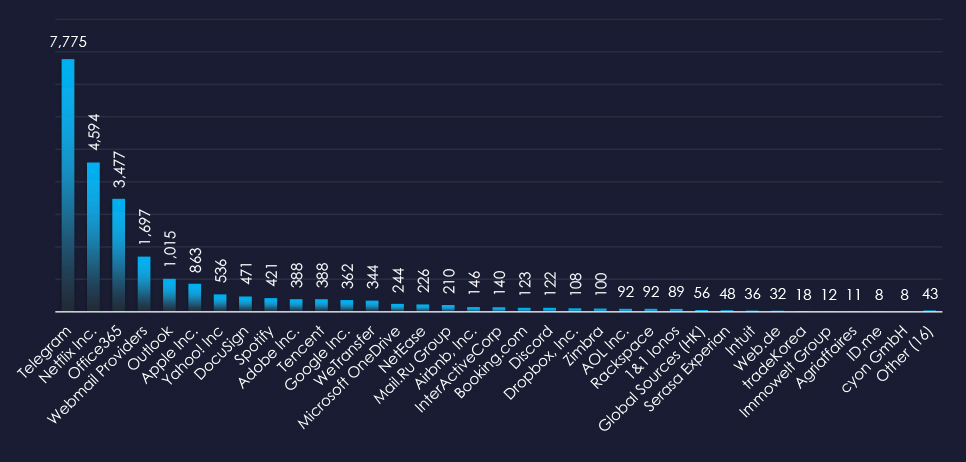
In total 50 information technology organizations were impersonated in captured phishing attempts during the last 90 days. Top amongst them are messaging platform Telegram, streaming service Netflix, and Office365.
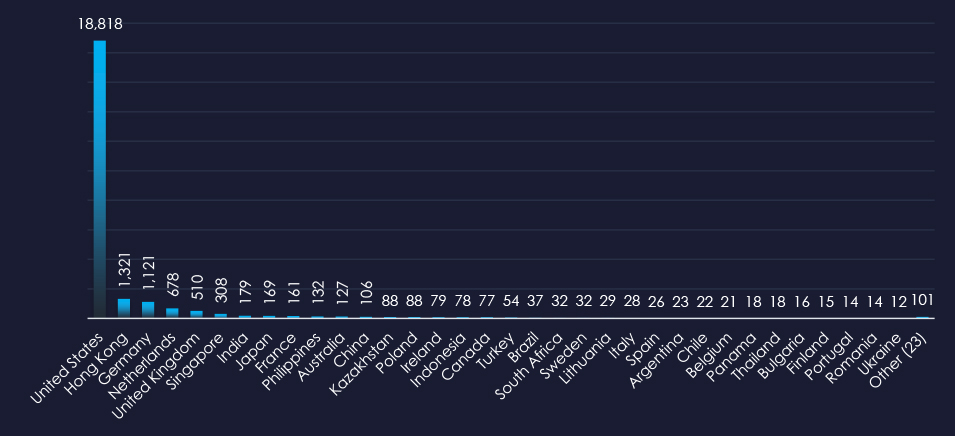
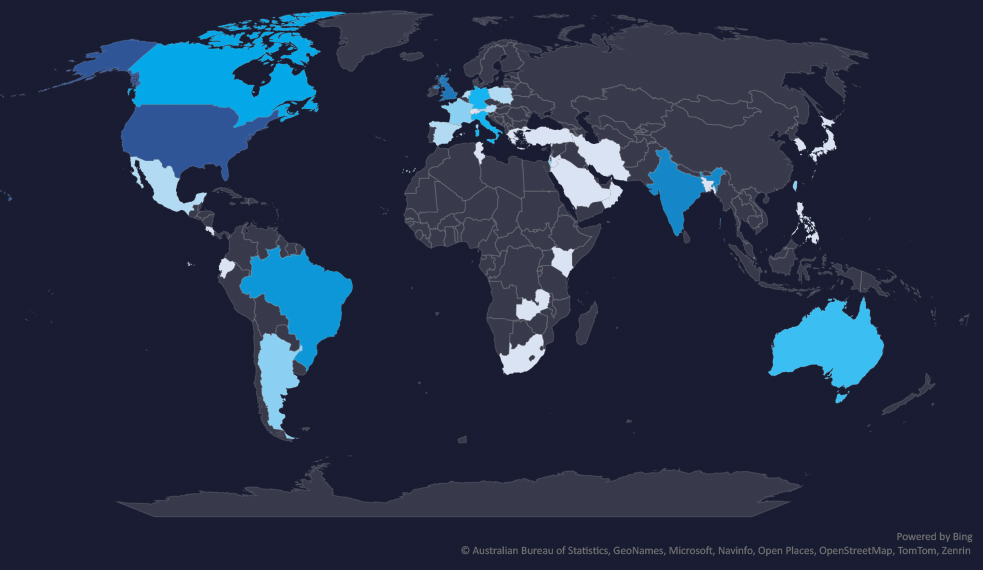
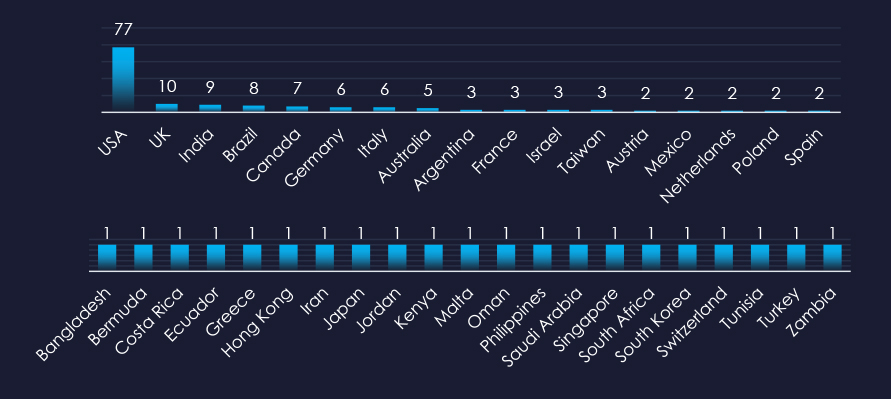
Overall, 57 countries were observed as a source of IT-themed phishing. The United States is leading the statistic, consistent with it being by far the largest digital economy.

Risk Level Indicator: Moderate
The IT sector remains a popular phishing theme being a direct monetization avenue, as well as providing an avenue to facilitate other cyberattacks. However, its share mildly decreased from 16.82% to 12.87%. This is largely due to the increasing share of unique and uncategorized Generic/Spear Phishing.
Messaging platform Telegram, streaming platform Netflix, and Office365 stand out as the most impersonated brands in the last 90 days.
Overall, the list includes 50 organizations from 57 countries, such as WeTransfer (NL), NetEase (CN), and Serasa Experian (BR), underscoring the worldwide nature of these threats.
ASN-origin data reveals that the United States is the leading source of phishing emails impersonating IT organizations, reflecting the extensive IT sector in the U.S. and the vast number of compromised devices used in botnets to send phishing emails. Significant activity is also observed in Hong Kong, and Germany for similar reasons.
India ranked as 7th most frequent. Furthermore, Hong Kong and Singapore are often used by Chinese cyber criminals as a proxy. Southeast Asia and Latin America are steadily growing as sources and targets of global phishing.
The presence in both developed and developing nations highlights that phishing campaigns are opportunistic and globally pervasive. Regional variations suggest more sophisticated attacks in high-count countries, while lesser-known regions like Bhutan or Zimbabwe show expanding attacker reach.
In the past 90 days, CYFIRMA has identified 172 verified ransomware victims in the IT industry. This accounts for 10.4% of the overall total of 1,652 ransomware victims during the same period, placing the IT industry as the 4th most frequent victim of ransomware.
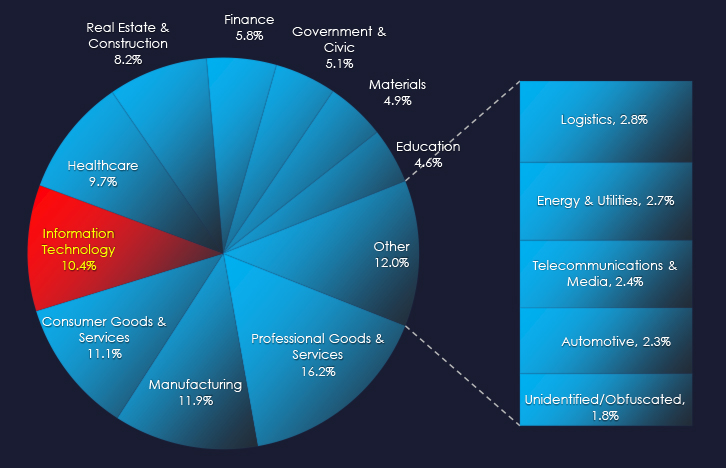
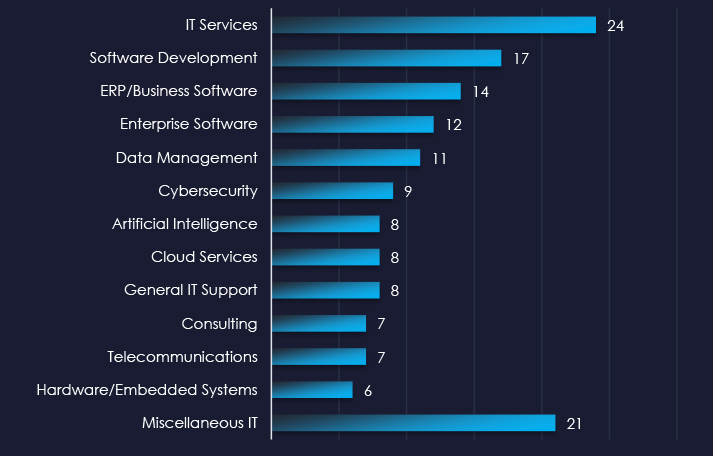
IT Services providers, software development, and ERP/Business Software are the most frequent victims of ransomware in the IT industry.
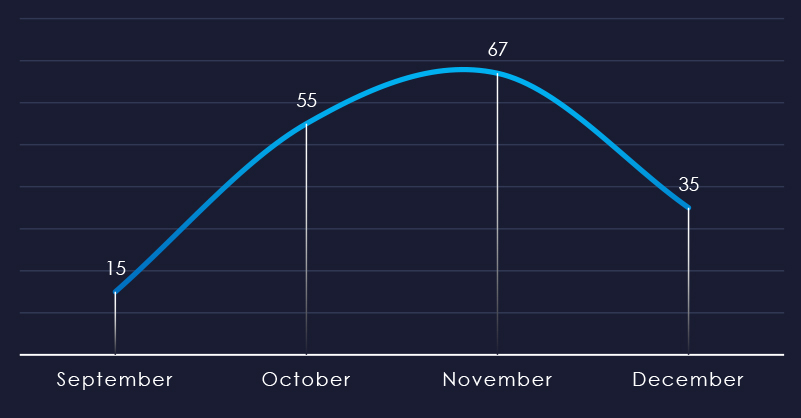
Considering the nearly equally split months of September and December, we can see sustained numbers of victims with a significant spike during November.
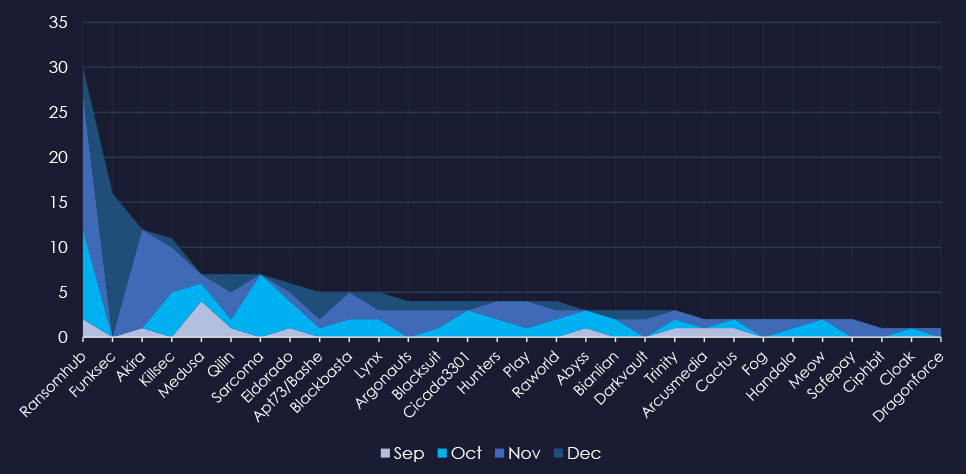
A breakdown of the monthly activity provides insights into which gangs were active each month. For example, RansomHub was very active in October and November. Funksec recorded all their victims in December.
In total 40 out of 63 active groups recorded IT organizations victims in the past 90 days. Notable is the distribution among a large number of groups in this period.
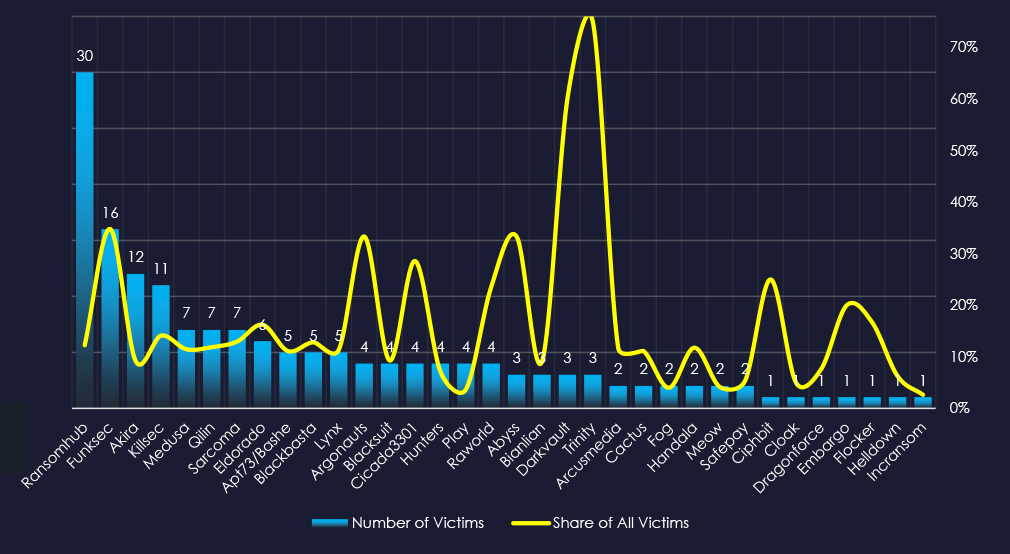
When comparing the IT industry to all recorded victims, RansomHub emerges with the highest number of victims overall.
Furthermore, RansomHub recorded 12.24% of its victims from IT organizations, which is more than 1 in 10, implying a significant focus on this industry.
The top 10 groups, except Funksec, show a relatively high share of victims from this industry, from 9.3% to 16.2%, underlying the popularity of IT organizations as ransomware targets.
Funksec emerges as a group with a particular focus on this industry with 35% of their victims being from IT.
Darkvault and Trinity recorded a 60% and 75% share of victims from IT, however, due to overall low numbers, the trendline is skewed.
The geographic distribution heatmap underscores the widespread impact of ransomware, highlighting the countries where victims in this industry have been recorded.
In total 37 countries recorded ransomware victims. 21 countries recorded only 1 victim.
The US alone accounts for ~45% of all victims with identified geography.

Risk Level Indicator: High
The IT industry is placed as the 4th most frequent victim. It faces a sustained and high ransomware threat, with attacks affecting a wide range of sub-sectors and a broad geographic distribution.
Monthly Activity Trends
Ransomware activity in the IT industry recorded a growth from September to November. November recorded a significant spike.
RansomHub and Funksec were the most active groups overall during the entire 90-day period.
Ransomware Gangs
A total of 40 out of 63 active ransomware groups targeted the IT industry, representing 63% participation.
RansomHub: 12.2% of their victims were in the IT industry (30 out of 245 victims), they accounted for the highest number of victims overall.
Funksec: Showed a strong focus on IT, with 34% of their victims coming from the sector (16 out of 46 victims).
Overall, excluding Funksec above, the top 10 groups showed a remarkably high focus on IT with 9.2% to 16.2% of their victims from this industry.
Geographic Distribution
The geographic distribution of ransomware victims in the IT industry reflects the industry’s global nature and the widespread reach of these attacks:
45% of all victims with identified geography are located in the US.
In total, 37 countries recorded ransomware victims in the IT industry.
For a comprehensive, up-to-date global ransomware tracking report, please refer to our new monthly “Tracking Ransomware” series here.
Over the past 90 days, information technology organizations faced moderate to high cyber risks across monitored categories.
APT Campaigns: 75% (9 out of 12) of observed campaigns targeted the IT sector, peaking in September and maintaining elevated levels since. Key threat actors included Chinese groups (Stone Panda/APT10, Emissary Panda/APT27, Volt Typhoon), Russian groups (FIN7, Gamaredon), Pakistan’s Transparent Tribe (APT36), Iran’s Fox Kitten, and North Korea’s Lazarus Group, alongside unattributed English and Vietnamese-speaking actors. Attacks affected 15 countries with substantial digital economies, notably the U.S., U.K., Japan, Taiwan, and India, with increased activity noted in Vietnam.
Phishing: The IT sector remains a key phishing theme for direct monetization and facilitating other cyber operations, though its share dipped from 16.82% to 12.87%. Telegram, Netflix, and Office365 were the most impersonated brands. A total of 50 organizations from 57 countries were targeted. The U.S. led as the main source of phishing emails, with Hong Kong, Germany, Southeast Asia, and Latin America also prominent. Both developed and emerging regions highlight the global pervasiveness of IT-related phishing.
Ransomware: Ranked as the 4th most frequently targeted sector, the IT industry faces a high ransomware threat. Activity rose from September and spiked in November. Out of 63 active ransomware groups, 40 (63%) targeted IT. Ransomhub had the most victims overall, while Funksec displayed the strongest IT focus (34% of its victims). The U.S. accounted for 45% of identified victims, and attacks were recorded in 37 countries, underscoring the global extent of ransomware threats in the IT sector.