

The CYFIRMA Industry Report delivers original cybersecurity insights and telemetry-driven statistics of global industries, covering one sector each week for a quarter. This report focuses on the government & civic organizations, presenting key trends and statistics in an engaging infographic format.
Welcome to the CYFIRMA infographic industry report, where we delve into the external threat landscape of the government & civic organizations over the past three months. This report provides valuable insights and data-driven statistics, delivering a concise analysis of attack campaigns, phishing telemetry, and ransomware incidents targeting the government & civic sectors.
We aim to present an industry-specific overview in a convenient, engaging, and informative format. Leveraging our cutting-edge platform telemetry and the expertise of our analysts, we bring you actionable intelligence to stay ahead in the cybersecurity landscape.
CYFIRMA provides cyber threat intelligence and external threat landscape management platforms, DeCYFIR and DeTCT, which utilize artificial intelligence and machine learning to ingest and process relevant data, complemented by manual CTI research.
For the purpose of these reports, we leverage the following data from our platform. These are data processed by AI and ML automation based on both human research input and automated ingestions.
While this report contains statistics and graphs generated primarily by automation, it undergoes a thorough review and enhancement for additional context by CYFIRMA CTI analysts to ensure the highest quality and provide valuable insights.
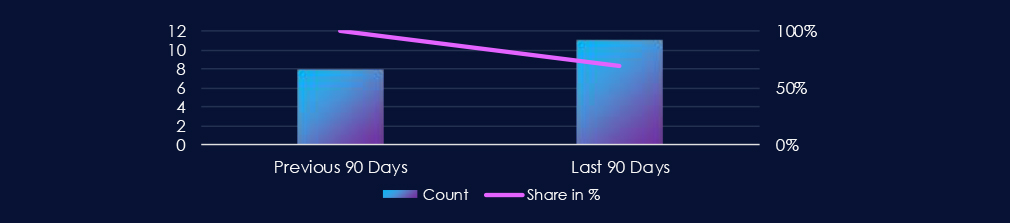
Over the past 90 days, Government & civic organizations featured in 11 out of the 16 observed campaigns, which is a presence in 69% of all campaigns. That is an increase from 8 in the previous 90 days; however, a decline in the overall share from 100% (8 out of 8).

Both June and July recorded 5 campaigns each. August has recorded one campaign against a government organization so far.
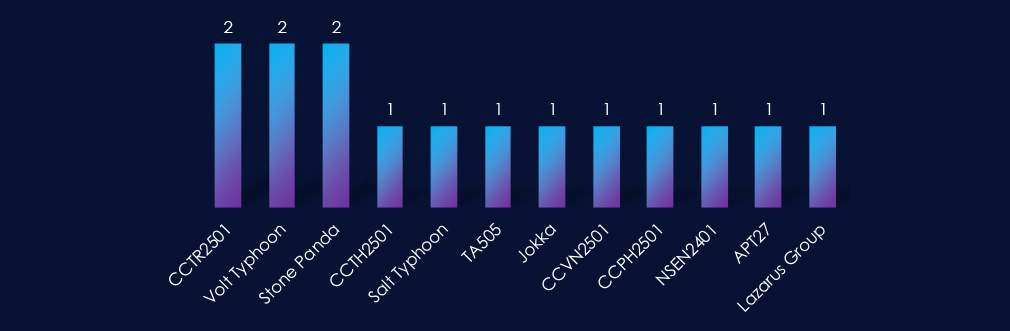
Active threat actors come from many corners of the world: Chinese Volt & Salt Typhoon, Stone Panda, and APT27, Russian TA505, Turkish, Vietnamese, Philippine, and Thai cybercriminals, or the North Korean Lazarus Group.
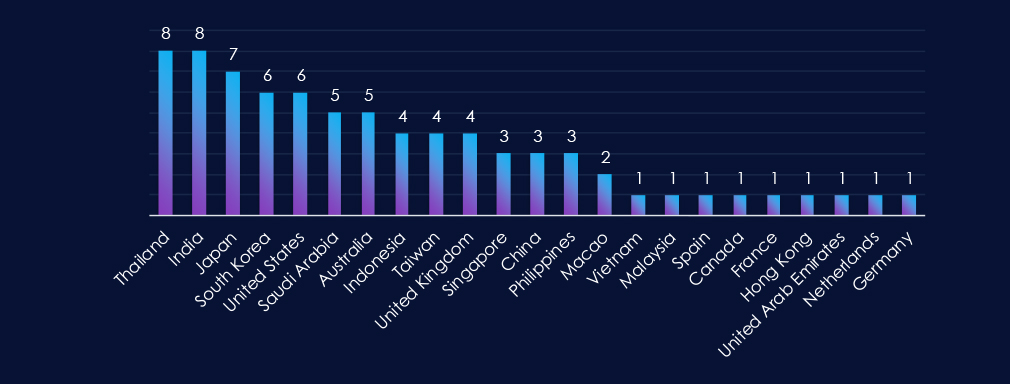
Thailand and India are leading the chart with presence in 8 out of 11 observed campaigns. In second place is Japan. South Korea and the USA share third place.
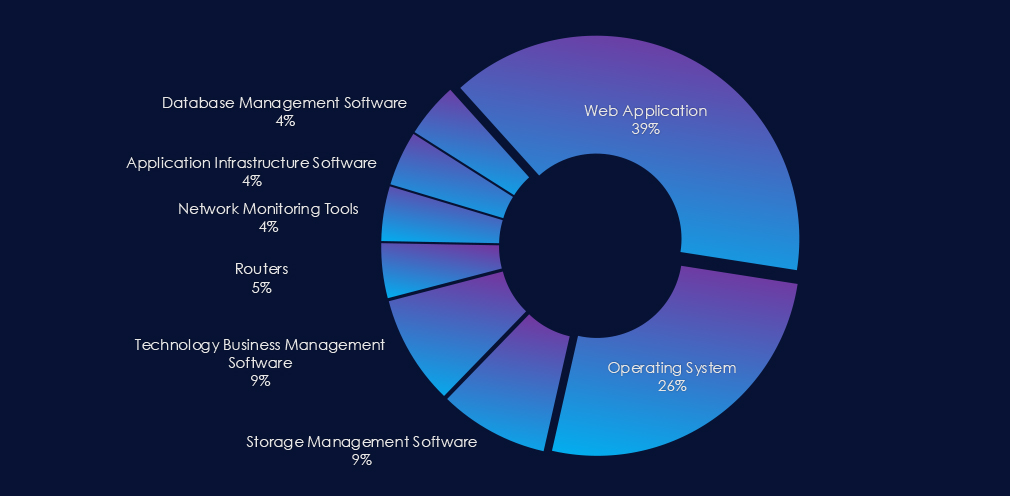
Web Applications are the most frequent primary attack vector. The second most exploited are operating system vulnerabilities. Additionally, various network, management, and infrastructure software were observed.

Over the past 90 days, government & civic organizations have been significantly affected by advanced persistent threat (APT) campaigns.
Out of the 16 observed APT campaigns, 11 targeted this sector, representing 69% of the observed campaigns. This is an increase from the previous 90-day period, during which 8 out of 8 campaigns targeted this government or civic orgs.
Monthly Trends
June and July both recorded 5 campaigns. August so far saw 1 campaign.
Key Threat Actors
Active threat actors originate from various regions worldwide. Examples include Chinese Typhoons APT27 or Stone Panda, Russian TA505, Turkish, Philippine, Vietnamese, and Thai cybercriminals, English-speaking TA, and the North Korean Lazarus Group.
Geographical Impact
Overall, 23 countries recorded victims in observed campaigns. Thailand and India lead the chart with their presence in 8 out of 11 observed campaigns. Japan is in second place, while South Korea and the USA share third place.
Targeted Technologies
Most campaigns employed Web Applications as their primary attack vectors. Many campaigns also exploited operating system vulnerabilities. Furthermore, various network, management, and infrastructure software were observed.
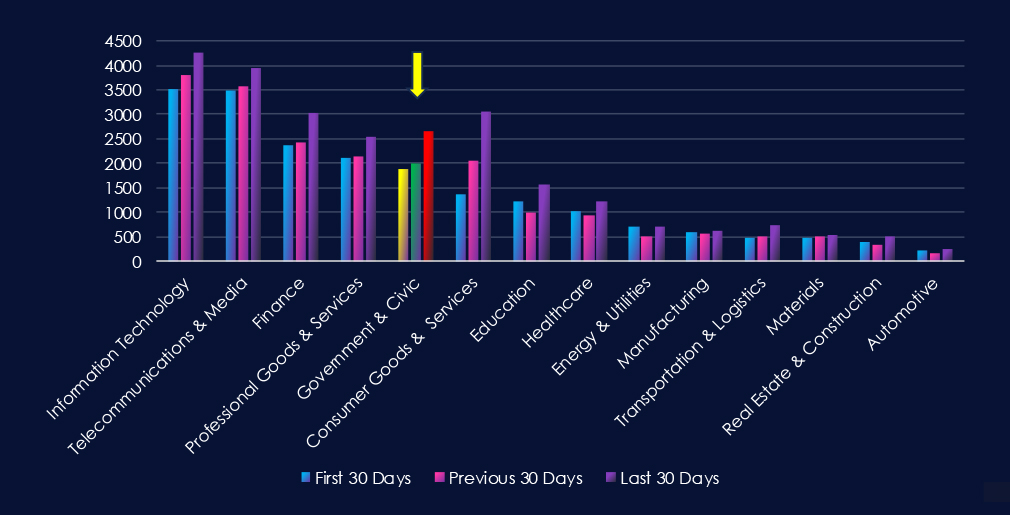
Over the past three months, CYFIRMA’s telemetry has identified 6,517 mentions of government & civic organizations out of a total of 65,870 industry mentions. This is from a total of 300k+ posts across various underground and dark web channels and forums.
Government & civic organizations placed 5th out of 14 industries in the last 90 days, with a share of 9.9% of all detected industry-linked chatter.
Below is a breakdown by 30-day periods of all mentions.
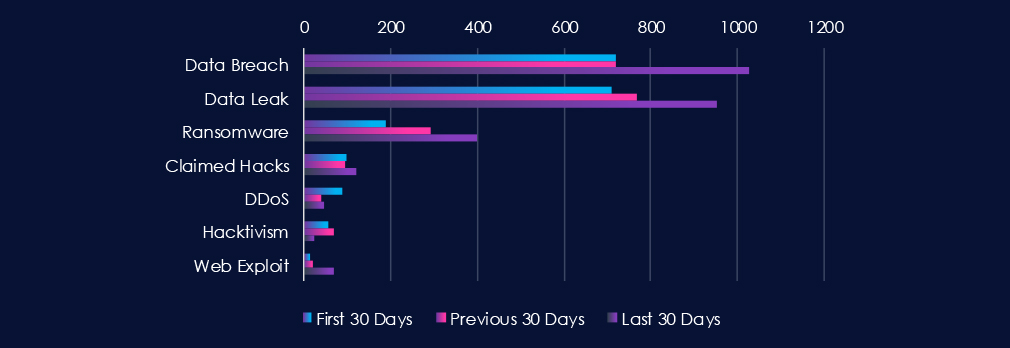
Data Leaks and Data Breaches are by far the most common category of recorded chatter, spiking during the last 30 days and showing high sustained interest. Ransomware chatter has steadily grown over the last 90 days.

In total, government & civic organizations comprise 9.9% of all detected industry underground and dark web chatter in the last 90 days, ranking 5th out of 14 industries.
Below are observed key trends across 90 days:
Data Breach
720 → 720 → 1027, Stable at first, then a sharp increase in the last 30 days. Suggests a surge in exposure of sensitive government records, possibly tied to new campaigns against civic databases, e-services, or contractors.
Data Leak
711 → 767 → 952, Mirrors breach activity with sustained growth, indicating that more government-linked data is being exfiltrated and circulated. This reinforces the likelihood of systematic targeting of governments.
Ransomware
188 → 292 → 400, Strong and steady rise across all periods. Government and civic entities continue to face escalating ransomware campaigns.
Claimed Hacks
99 → 94 → 120, After a dip, there’s renewed chatter on claimed intrusions. This may represent both real compromises and inflated claims to gain notoriety — but the volume aligns with the surge in ransomware and breaches.
DDoS
88 → 38 → 47, Significant drop from the first period, but a mild rebound in the most recent 30 days. Could reflect episodic campaigns around political events, elections, or policy disputes.
Hacktivism
55 → 70 → 24, A decline after a temporary spike. Suggests hacktivist operations may have shifted elsewhere, with financially motivated actors now dominating government sector targeting.
Web Exploit
15 → 20 → 70, A steep increase in the last 30 days. Indicates rising attempts to exploit public-facing portals and applications, correlated with new vulnerabilities, which could be linked to the growth in breaches and data leaks.
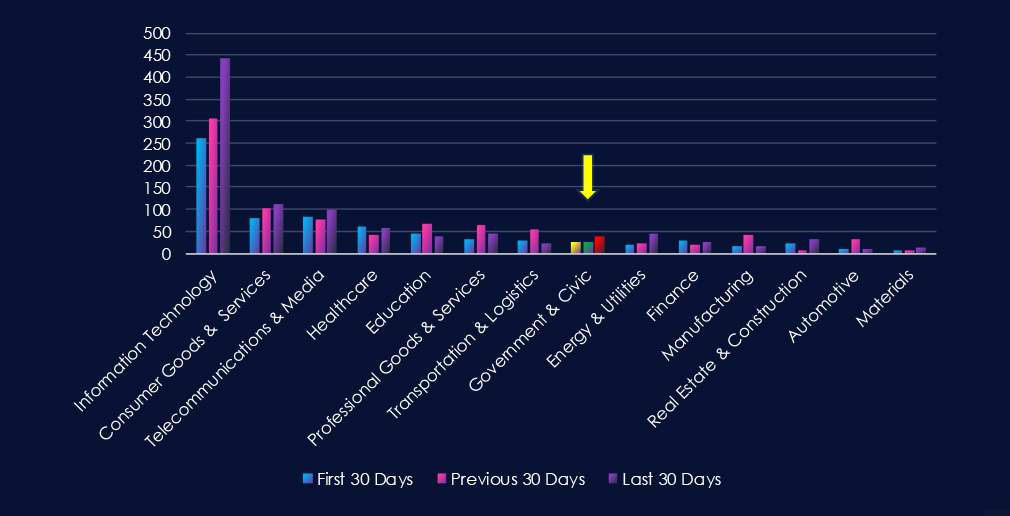
Over the past three months, CYFIRMA’s telemetry has identified 92 mentions of government & civic organizations out of a total of 2,572 industry mentions. This is from over 10k CVEs reported and updated in the last 90 days.
Government & civic organizations ranked 8th out of 14 industries in the last 90 days, with a share of 3.6% of all detected industry-linked vulnerabilities.
Below is a breakdown by 30-day periods of all mentions.
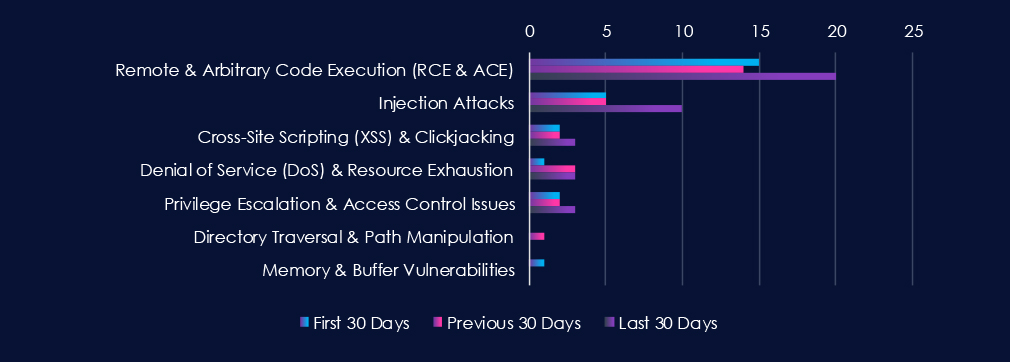
Remote & Arbitrary Code Execution (RCE & ACE) and Injection Attack are leading the chart. Most categories recorded a significant uptick in the last 30 days. This correlates with increased chatter in the previous section of this report.

In total, government & civic organizations comprise 3.6% of all detected industry-linked vulnerabilities in the last 90 days. And ranking 8th out of 14 industries.
Below are observed key trends across 90 days.
Remote & Arbitrary Code Execution (RCE & ACE)
15 → 14 → 20, Consistently high disclosure volume with a notable uptick in the last 30 days. Indicates researchers and vendors continue to uncover high-impact flaws in systems critical to the sector, possibly tied to widely used platforms or government-specific applications.
Injection Attacks
5 → 5 → 10, Stable at first, then doubling in the most recent period. Suggests renewed focus by researchers on input validation weaknesses in civic portals and administrative systems.
Cross-Site Scripting (XSS) & Clickjacking
2 → 2 → 3, Low but persistent disclosure trend. Reflects ongoing identification of web application flaws, likely in public-facing e-government services.
Denial of Service (DoS) & Resource Exhaustion
1 → 3 → 3, Slight rise and sustained reporting. Indicates researchers continue to identify service availability risks, which could impact critical online portals or digital citizen services.
Privilege Escalation & Access Control Issues
2 → 2 → 3, Small but steady number of disclosures, suggesting continued findings in authentication or role-based access implementations.
Directory Traversal & Path Manipulation
0 → 1 → 0, Isolated disclosure, likely tied to a specific product or system rather than a systemic issue.
Memory & Buffer Vulnerabilities
1 → 0 → 0, Minimal reporting, indicating low prevalence or limited researcher focus on this category within the sector’s commonly used technologies.
In the past 90 days, CYFIRMA has identified 83 verified ransomware victims in government & civic organizations. This accounts for 5.6% of the overall total of 1,490 ransomware victims during the same period, placing the government & civic sectors 7th out of 14 industries.
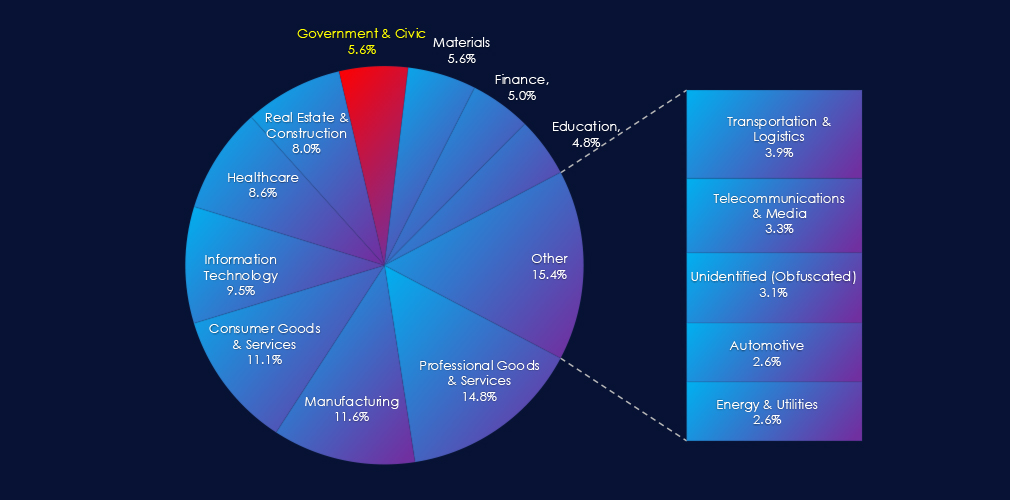
Furthermore, a quarterly comparison reveals a major drop in victims in government & civic organizations, with a reduction of -29.5% from 114 to 83 victims. The overall share of victims also mildly dropped from 5.9% to 5.6% of all victims.
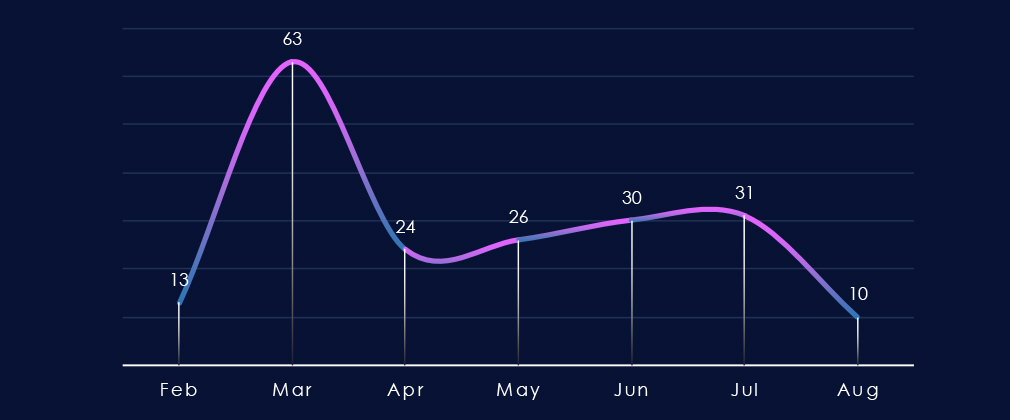
Over the past 180 days, the number of victims has recorded a sharp spike during March, followed by a huge dip in April and then steady growth all the way to July.
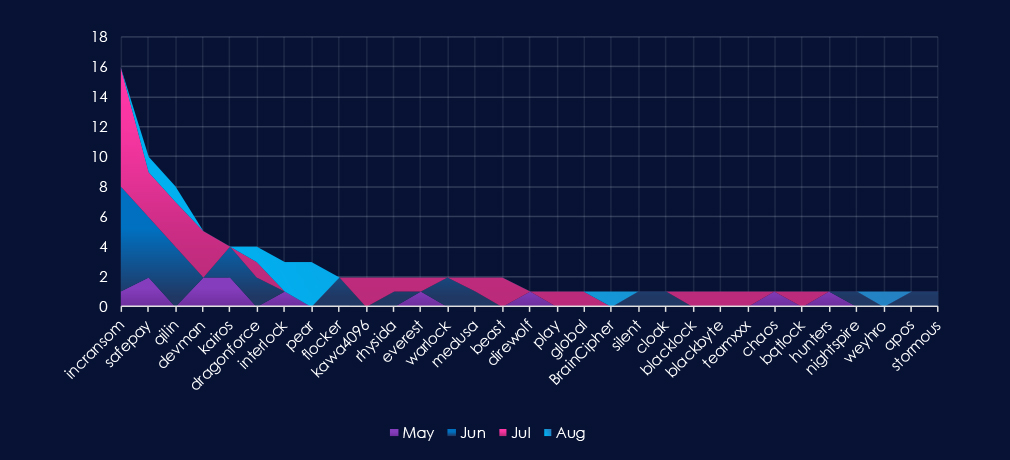
A breakdown of monthly activity per gang provides insights into which gangs were active each month. For example, by far the most active gang, Incransom, was active mostly during June and July. On the other hand, the fourth most active gang, Devman, recorded victims only in May and July.
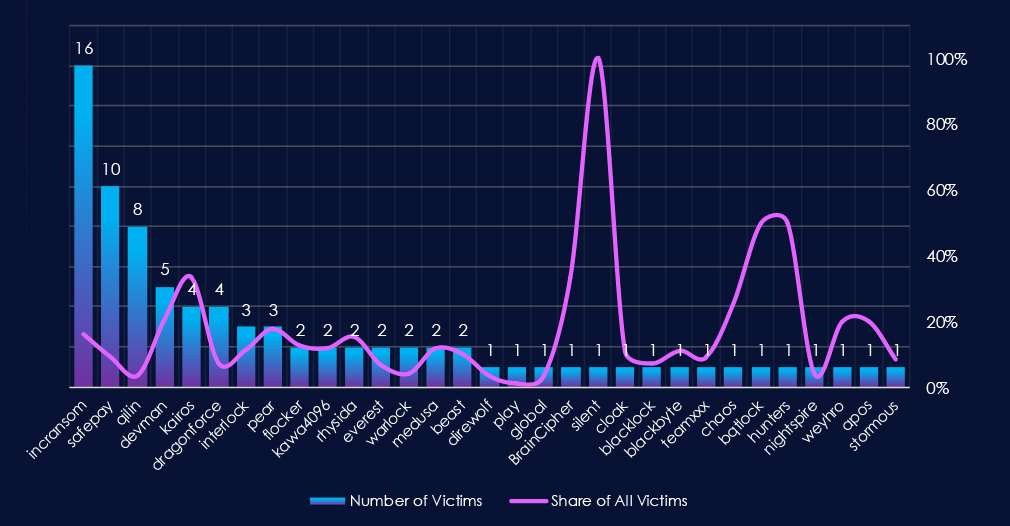
Out of the 74 gangs, 31 recorded victims in this industry in the last 90 days (42% participation). Incransom had the highest number of victims (16) with a high share (16%).
The share of victims for many gangs in this industry is relatively high. From the top 10, only 2 gangs recorded a share of around or above 10%.
Kairos (33%), Devman (21%), and Pear (18%) had the highest shares of victims, implying a higher focus on this industry.
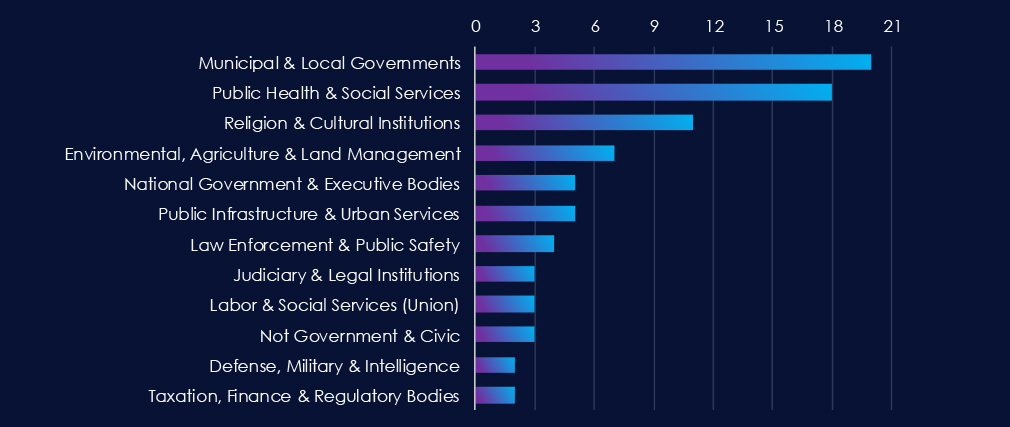
Municipal & Local Governments are the most frequent victims of ransomware in this industry. Close second place is Public Health & Social Services.
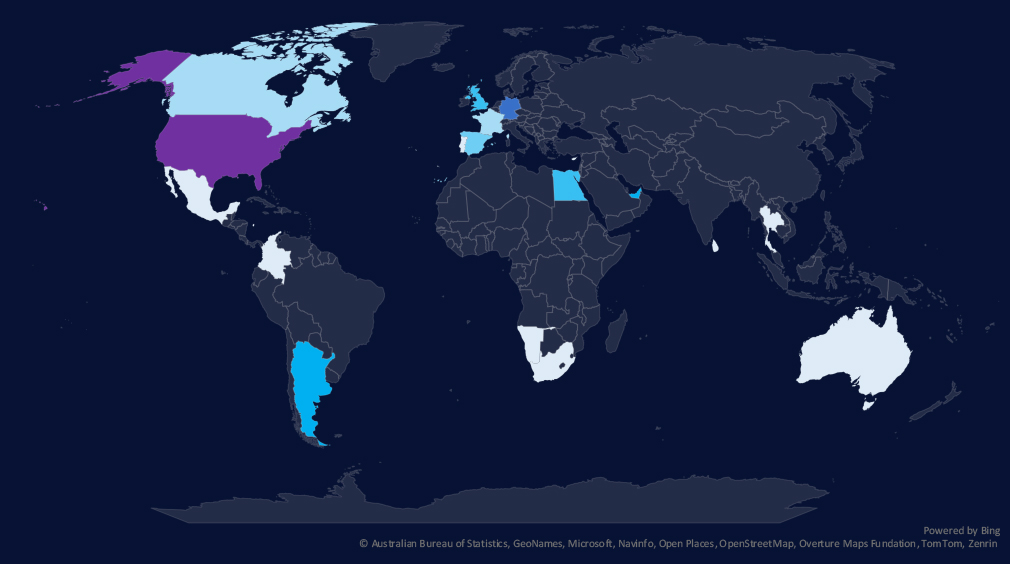
The geographic distribution heatmap underscores the widespread impact of ransomware, highlighting the countries where victims in this industry have been recorded in the last 90 days.
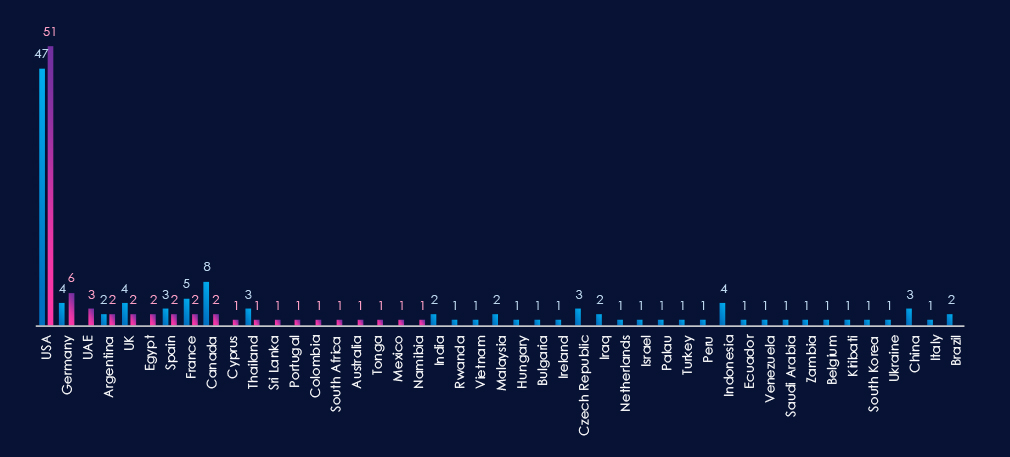
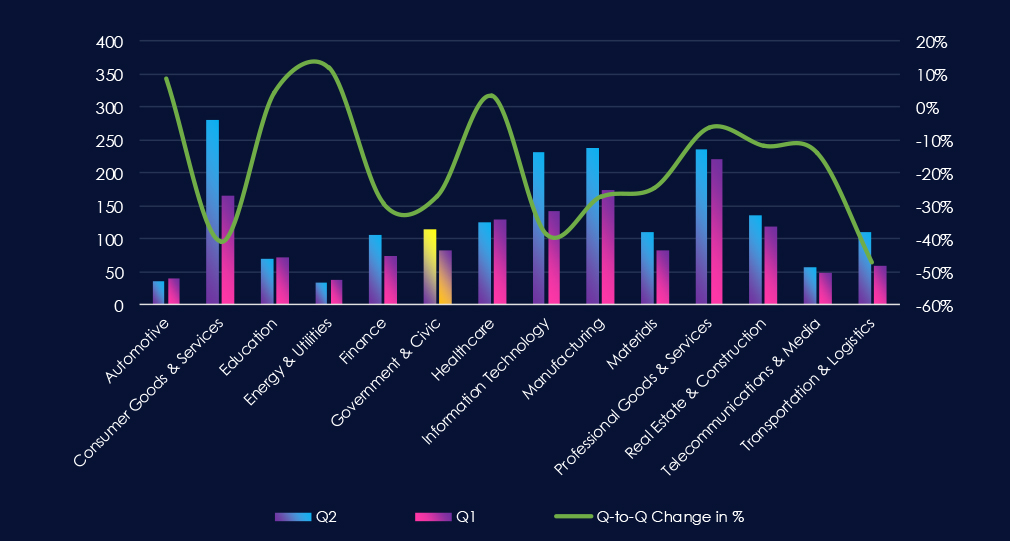
The chart shows quarter-to-quarter changes in targeted countries. Data is sorted by the last 90 days and compared to the previous 90 days, marked in blue.
In the last 90 days, the USA recorded 51 victims (61% of all victims). Germany and the UAE follow in second and third place. France, Canada, Indonesia, and the Czech Republic recorded significant drops from the previous 90-day period.
Many countries from the previous 90 days did not record new victims at all.

Government & civic organizations placed 7th out of 14 monitored industries, recording 83 victims in the last 90 days. A major decrease of -29.5% from 114 victims in the previous 90-day period.
Overall share also declined from 5.9% to 5.6% of all ransomware victims.
Monthly Activity Trends
Monthly activity trends show a sharp drop from March (118) to April (24). Then, until July, we saw remarkably stable growth of victims (26, 30, 31)
Ransomware Gangs
A total of 31 out of 74 active ransomware groups targeted this industry in the past 90 days, representing 42% participation:
Incransom: The most active, with 16 victims and 16% (16 out of 100) of all their victims.
Safepay: Second most active with 9.2% (10 out of 109) share.
Kairos, Devman, Pear: Highest shares of 33% (4 out of 12), 21% (5 out of 24), and 18% (3 out of 17) victims among top gangs, suggesting a high focus on this industry.
Geographic Distribution
The geographic distribution of ransomware victims is relatively high yet quite concentrated in the USA*(USA warrants a higher risk), which accounts for 61% of all victims. Germany and the UAE follow in distant second and third place.
Notably, previously heavily hit countries like France, Canada, Indonesia, and the Czech Republic recorded a significant decline in victims.
In total, 19 countries recorded ransomware victims in this industry in the last 90 days, fifteen fewer than 34 in the previous period.
For a comprehensive, up-to-date global ransomware tracking report, please refer to our new monthly “Tracking Ransomware” series here.
APT Campaigns (High): Government and civic organizations were heavily targeted, with 11 of 16 campaigns (69%) focused on this sector, up from 8/8 last period. Campaign activity peaked in June and July. Major actors included Chinese APT27/Stone Panda, Russian TA505, North Korean Lazarus, as well as Turkish, Philippine, Vietnamese, Thai, and English-speaking groups. Victims were recorded in 23 countries, with Thailand and India present in 8 campaigns, followed by Japan, South Korea, and the USA. Attack vectors were largely web applications, operating system exploits, and network/infrastructure software.
Underground & Dark Web Chatter (High): This sector represented 9.9% of all chatter (ranked 5th). Data breaches increased sharply (720→720→1027), mirrored by leaks (711→767→952), suggesting systemic targeting of civic systems and e-services. Ransomware chatter grew steadily (188→292→400). Claimed hacks rebounded (99→94→120). DDoS dropped from 88 to 47 but rebounded slightly in the most recent period. Hacktivism declined after a temporary mid-period surge. Web exploit chatter spiked (15→20→70), signaling increased focus on exploiting public portals and government-facing applications.
Vulnerabilities (Moderate): Government-linked vulnerabilities accounted for 3.6% of the industry total (ranked 8th). Remote/Arbitrary Code Execution disclosures stayed consistently high (15→14→20). Injection attacks doubled (5→5→10). XSS/clickjacking persisted at low but steady levels (2→2→3). DoS vulnerabilities rose slightly (1→3→3). Privilege escalation/access control disclosures also grew (2→2→3). Directory traversal and memory flaws were minimal. Overall, disclosures highlight persistent risk across public-facing platforms and administrative systems.
Ransomware (Moderate*): Government and civic organizations ranked 7th with 83 victims (-29.5% from 114). Share dropped slightly (5.9%→5.6%). After a sharp fall in April, activity stabilized (26–31 victims monthly). Thirty-one ransomware groups (42% of all active groups) targeted this sector. Incransom led with 16 victims (16% of its total), followed by Safepay (10, 9.2%). Kairos, Devman, and Pear displayed disproportionately high focus (33%, 21%, 18% of their totals, respectively). The USA* dominated with 61% of victims, followed by Germany and the UAE. Victim spread declined from 34 countries to 19.