
The CYFIRMA Industry Report delivers original cybersecurity insights and telemetry-driven statistics of global industries, covering one sector each week for a quarter. This report focuses on the finance industry, presenting key trends and statistics in an engaging infographic format.
Welcome to the CYFIRMA infographic industry report, where we delve into the external threat landscape of the finance industry over the past three months. This report provides valuable insights and data-driven statistics, delivering a concise analysis of attack campaigns, phishing telemetry, and ransomware incidents targeting financial organizations.
We aim to present an industry-specific overview in a convenient, engaging, and informative format. Leveraging our cutting-edge platform telemetry and the expertise of our analysts, we bring you actionable intelligence to stay ahead in the cybersecurity landscape.
CYFIRMA provides cyber threat intelligence and external threat landscape management platforms, DeCYFIR and DeTCT, which utilize artificial intelligence and machine learning to ingest and process relevant data, complemented by manual CTI research.
For the purpose of these reports, we leverage the following data from our platform. These are data processed by AI and ML automation based on both human research input and automated ingestions.
While this report contains statistics and graphs generated primarily by automation, it undergoes thorough review and enhancement for additional context by CYFIRMA CTI analysts to ensure the highest quality and provide valuable insights.
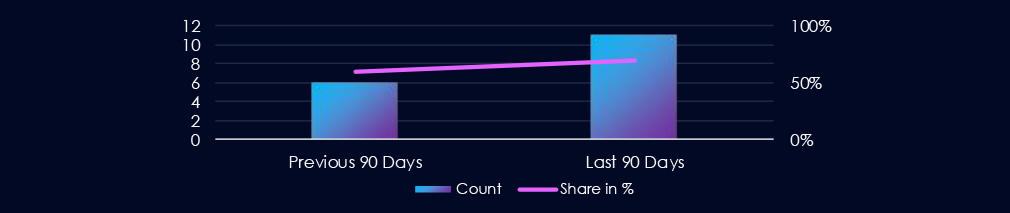
The finance industry featured in 11 out of the 16 observed campaigns, which is a presence in 69% of all campaigns, an increase from the previous period (6 out of 10, 60%) in both volume and overall share.

Considering only the last week of June in the 90-day scope of this report, activity is sustained and consistent across the last 3 months.
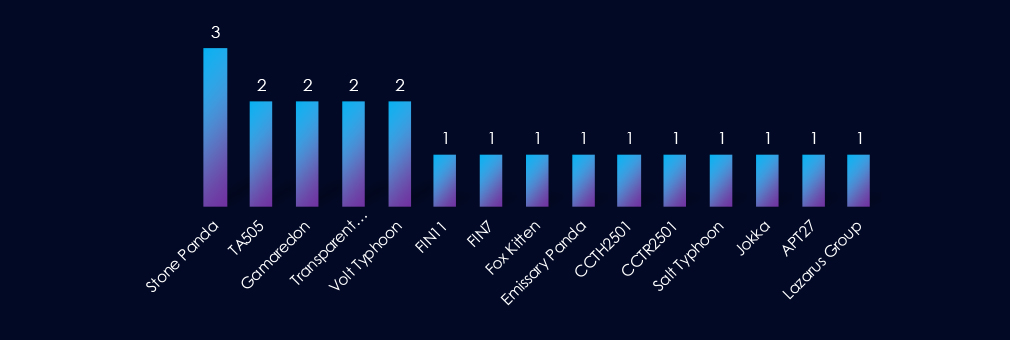
Beyond the established Chinese (Stone Panda, Emissary Panda, APT27) and Russian (TA505, FIN7, FIN11, Gamaredon) actors, we also see activity from North Korea’s Lazarus and Iran’s Fox Kitten. South Asian presence is evident with Pakistan’s Transparent Tribe, while regional elements include Jokka, Thai CCTH2501, and Turkish CCTR2501. Newer Chinese designations, Volt Typhoon and Salt Typhoon, further expand the threat actor list. Overall, the activity points to a widening geographic scope of APT threats.
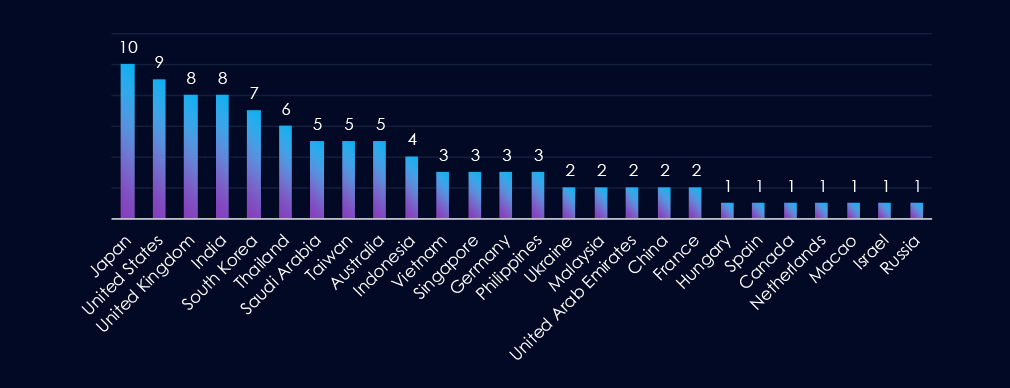
Japan leads in targeting, followed closely by the United States and the United Kingdom. India is also among the top targets, along with several East Asian nations (South Korea, Taiwan) and Southeast Asian countries (Thailand, Indonesia, Vietnam, Singapore, Philippines). The Middle East (Saudi Arabia, UAE) and Australia are significant as well. A few European states (Germany, France, etc.) and smaller jurisdictions are lesser but still present.
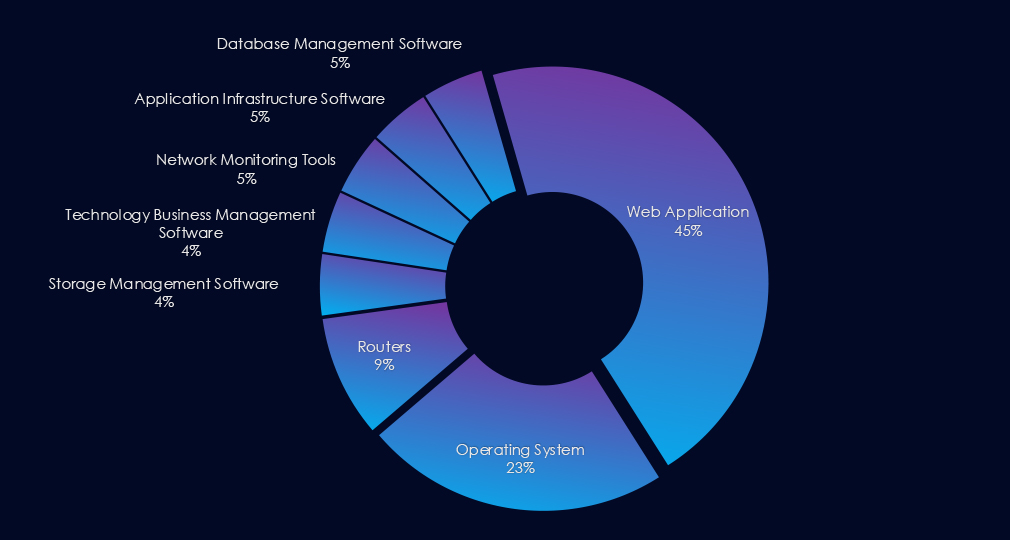
Web applications were the primary targets in most campaigns, while operating systems and routers were also exploited in multiple campaigns. Additionally, various management software was frequently exploited.

Over the past 90 days, the finance industry has been significantly impacted by advanced persistent threat (APT) campaigns.
11 out of 16 observed APT campaigns recorded victims in this industry. That is a 69% presence in observed campaigns.
That is an elevation from the previous 90-day period, during which 6 out of 10 campaigns targeted this industry, also increasing the overall share from he previous 60%.
Monthly Trends
Considering one campaign in the last week of June, activity was consistent and sustained across the month during the last 90 days. July recorded 4 campaigns, while August and September recorded 3 each.
Key Threat Actors
Beyond well-known Chinese (Stone Panda, Emissary Panda, APT27) and Russian (TA505, FIN7, FIN11, Gamaredon) actors, there is also activity from Lazarus (North Korea), Fox Kitten (Iran), Transparent Tribe (Pakistan), and regionally rooted groups like Jokka, Thai CCTH2501, and Turkish CCTR2501. Newer Chinese-state entities, such as Volt Typhoon and Salt Typhoon, deepen the threat spectrum. Overall, the trends point to a more geographically dispersed APT landscape.
Geographical Impact
Japan is the top target, with the US and UK close behind. India, along with several East and Southeast Asian countries—South Korea, Taiwan, Thailand, Indonesia, Vietnam, Singapore, and the Philippines are also frequent targets. The Middle East (Saudi Arabia, UAE) and Australia appear prominently too; smaller European and other jurisdictions are less often hit.
Targeted Technologies
Most campaigns focused on web applications, but many also leveraged vulnerabilities in operating systems and routers. Exploits against management software were common as well.
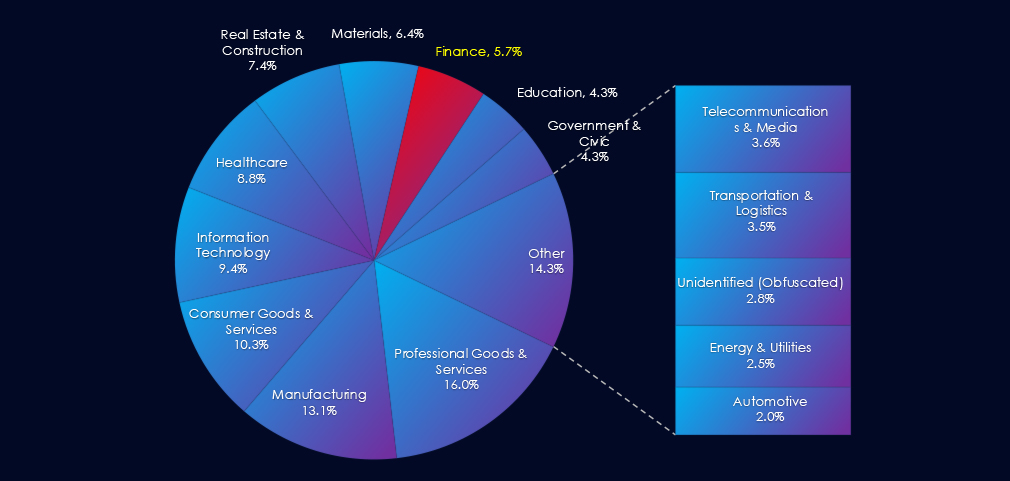
Over the past three months, CYFIRMA’s telemetry has identified 9.975 mentions of the finance industry out of a total of 71,578 industry-linked mentions. This is from a total of 300k+ posts across various underground and dark web channels and forums.
The finance industry placed 3rd out of 14 industries in the last 90 days, with a share of 13.9% of all detected industry-linked chatter.
Below is a breakdown by 30-day periods of all mentions.
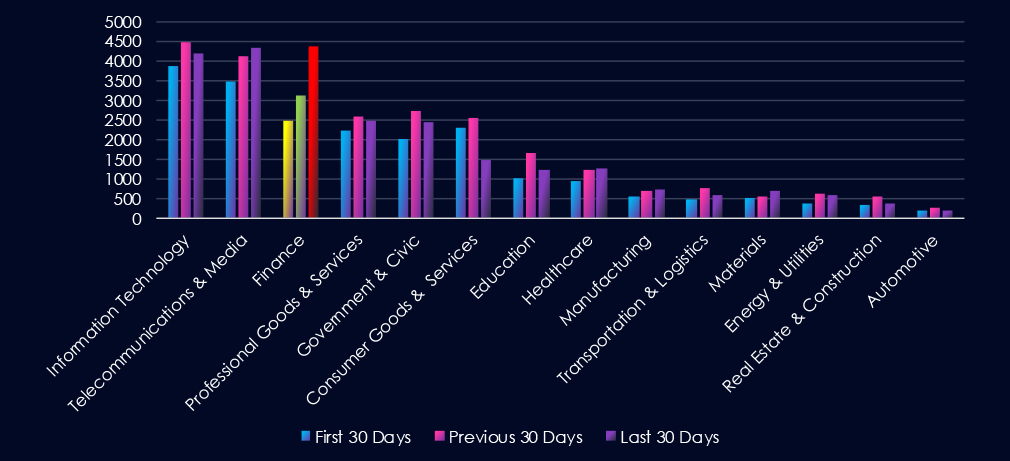
Investigating the major increase in chatter for the Finance industry, we found recent large Allianz Life (USA) and Vietnam National Credit Information Center (CIC) leaks to be driving the engagement in the last 30 days.
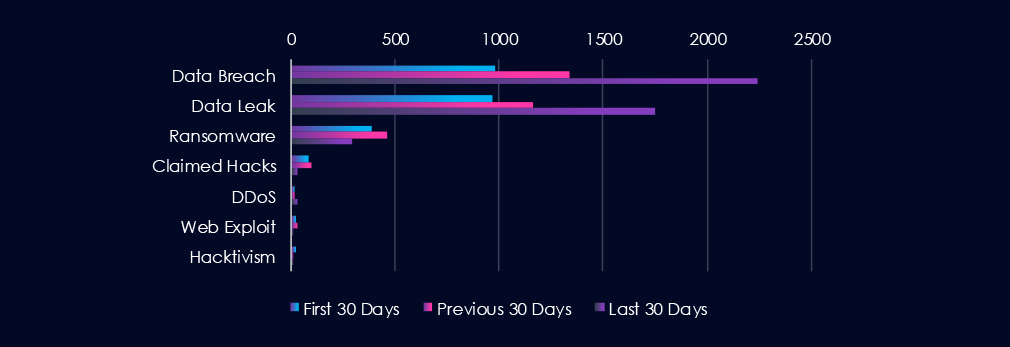
Data Breaches and Data Leaks are the most frequently discussed topics in this industry. Both categories, particularly Data Breaches, have experienced a gradual increase in chatter over the entire 90-day period, with a significant spike in the last 30 days. Ransomware-related chatter follows closely behind, maintaining relatively stable levels of discussion throughout the 90 days.

In total, the finance industry comprises 13.9% of all detected industry underground and dark web chatter in the last 90 days. And ranking 3rd out of 14 industries.
Below are the observed key trends across 90 days:
Data Breach
984 → 1337 → 2241, Strong and accelerating growth across all periods. Financial institutions remain a top target due to the direct value of compromised data and systems, with recent activity suggesting a surge in large-scale or high-impact breaches.
Data Leak
966 → 1160 → 1753, Similar upward trajectory to breaches, reinforcing the view that stolen financial data is being systematically exfiltrated and traded. Highlights ongoing exposure of customer accounts, payment data, and financial records.
Ransomware
390 → 460 → 294, Elevated early on with a decline in the latest period. Suggests some reduction in ransomware chatter, though finance remains a priority sector given the potential for extortion.
Claimed Hacks
83 → 96 → 30, Sharp drop in the most recent period. Could indicate fewer publicized intrusions or a shift toward private sales of access rather than open boasting on underground forums.
DDoS
20 → 17 → 28, A recent increase after relatively low levels earlier. Likely tied to extortion-based campaigns or disruption efforts against online banking portals.
Web Exploit
21 → 32 → 11, Noticeable decline in the latest period. May suggest fewer exploitable vulnerabilities in web-facing banking systems, or attackers focusing instead on credential theft and direct breaches.
Hacktivism
26 → 13 → 13, Declined and then stabilized at a lower level. Shows reduced ideological targeting of the finance sector, with financially motivated campaigns dominating activity.
Over the past three months, CYFIRMA’s telemetry has identified 78 mentions of the finance industry out of a total of 2,858 industry mentions. This is from over 10k CVEs reported and updated in the last 90 days.
The finance industry ranked 12th out of 14 industries in the last 90 days, with a share of 2.7% of all detected industry-linked vulnerabilities.
Below is a breakdown by 30-day periods of all mentions.

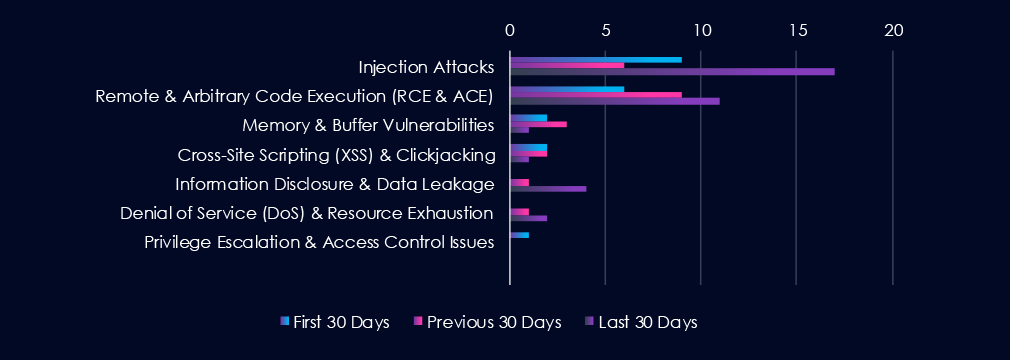
Injection Attacks are the most frequent vulnerability due to an uptick in CVEs during the last 30 days. Remote & Arbitrary Code Execution (RCE & ACE) follows in second place, steadily growing over the last 90 days. Notably, Information Disclosure & Data Leakage spiked in the last 30 days, likely linking the spike in underground chatter.

In total, the finance industry comprises 2.7% of all detected industry-linked vulnerabilities in the last 90 days, ranking 12th out of 14 industries.
Below are observed key trends across 90 days.
Injection Attacks
9 → 6 → 17, After a dip, disclosures spiked sharply in the latest period. Suggests renewed researcher/vendor focus on input validation issues in financial applications and services, which remain a persistent class of vulnerabilities.
Remote & Arbitrary Code Execution (RCE & ACE)
6 → 9 → 11, Steady growth across all periods. Highlights continued reporting of high-severity flaws with the potential to fully compromise financial systems if left unpatched.
Memory & Buffer Vulnerabilities
2 → 3 → 1, Fluctuating at low levels, with a decline in the latest period. These appear less prevalent in the financial sector compared to logic and input-driven flaws.
Cross-Site Scripting (XSS) & Clickjacking
2 → 2 → 1, Low and declining disclosure activity. Suggests relatively few newly identified client-side vulnerabilities in financial portals or web apps.
Information Disclosure & Data Leakage
0 → 1 → 4, Recent rise, pointing to growing reporting of inadvertent exposure issues. While limited in volume, these align with broader industry data leaks chatter spike in the last 30 days.
Denial of Service (DoS) & Resource Exhaustion
0 → 1 → 2, Small but increasing disclosure activity. Reflects occasional findings of availability-related flaws that could impact financial services’ uptime.
Privilege Escalation & Access Control Issues
1 → 0 → 0, Minimal reporting, suggesting relatively few newly discovered access control flaws this period.
In the past 90 days, CYFIRMA has identified 86 verified ransomware victims in the finance industry. This accounts for 5.7% of the overall total of 1,516 ransomware victims during the same period. Placing the finance industry 8th out of 14 industries.
Furthermore, a quarterly comparison shows that interest in finance organizations has slowed. There was a decline of -17.3% from 104 to 86 victims. The overall share also declined from 6.85% to 5.67% of all victims.
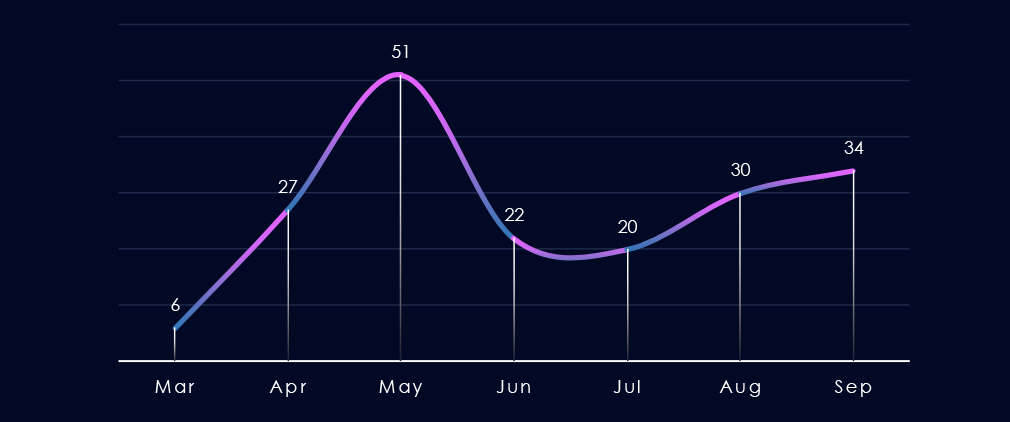
Over the past 180 days, excluding the partial month of March, we observed a spike in the number of victims in May, followed by a dip below the average and a gradual increase towards September.
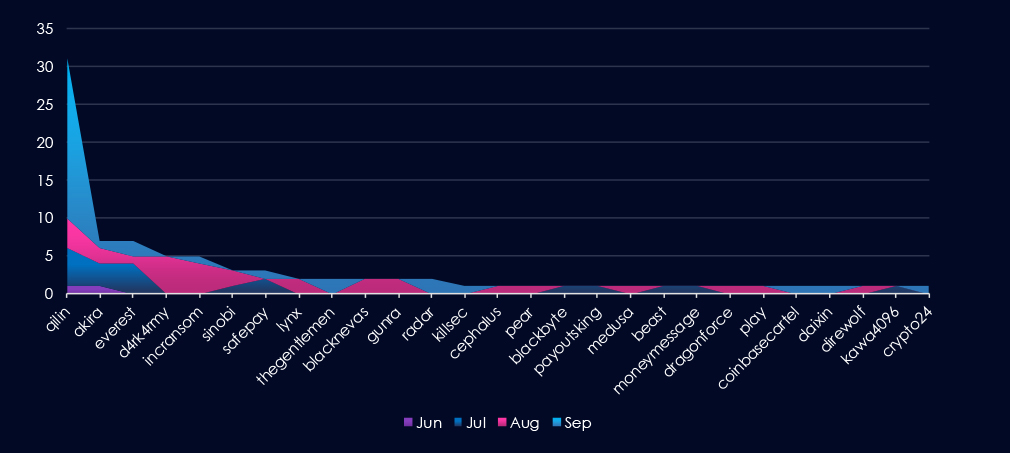
A breakdown of monthly activity per gang reveals which gangs were most active each month. For instance, Qilin was active across months and, during September, launched major campaigns with 21 victims. On the other hand, D4rkarmy or Incransom were active in August.
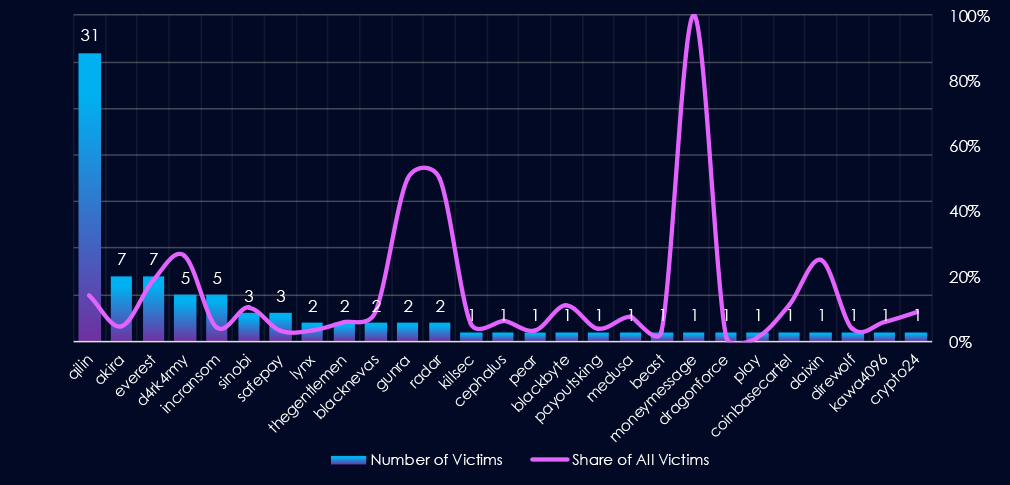
Out of the 77 gangs, 27 recorded victims in the finance industry in the last 90 days, representing a participation rate of 35%. Qilin had the highest number of victims (31).
Among the top 5 gangs, Qilin (14%), Everest (19%), and Da4rk4rmy (26%) recorded the highest shares in the finance industry. Furthermore, Gunra and Radar (both 50%) showed an exceptionally high focus on this industry, though with lower overall numbers.
Out of the top 20 gangs, 8 showed double-digit % of victims in the finance industry.
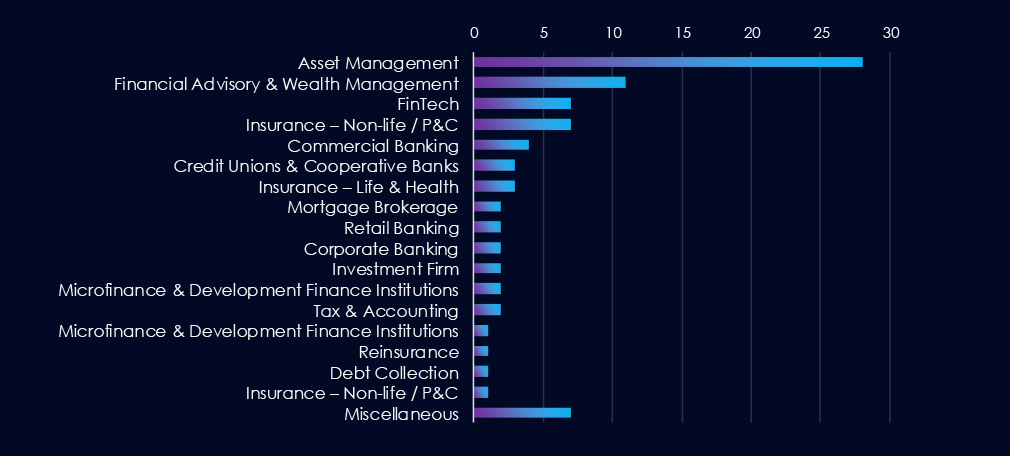
Asset Management firms are, by far, the most prominent victims of ransomware attacks in the finance industry. Financial Advisory & Wealth Management firms, FinTech companies, and combined Insurance firms follow closely behind.
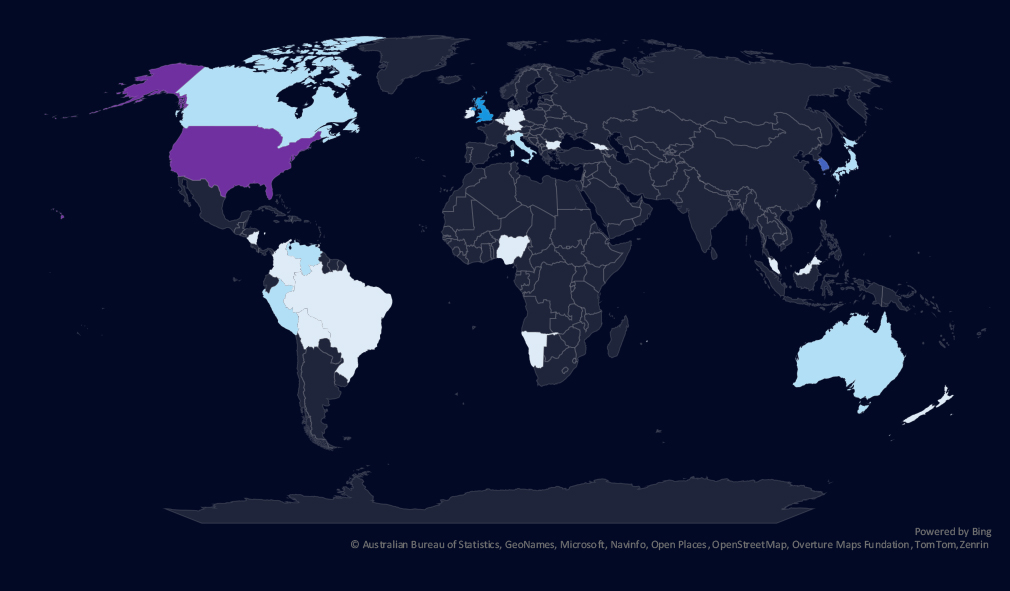
The geographic distribution heatmap underscores the widespread impact of ransomware, highlighting the countries where victims in this industry have been recorded.

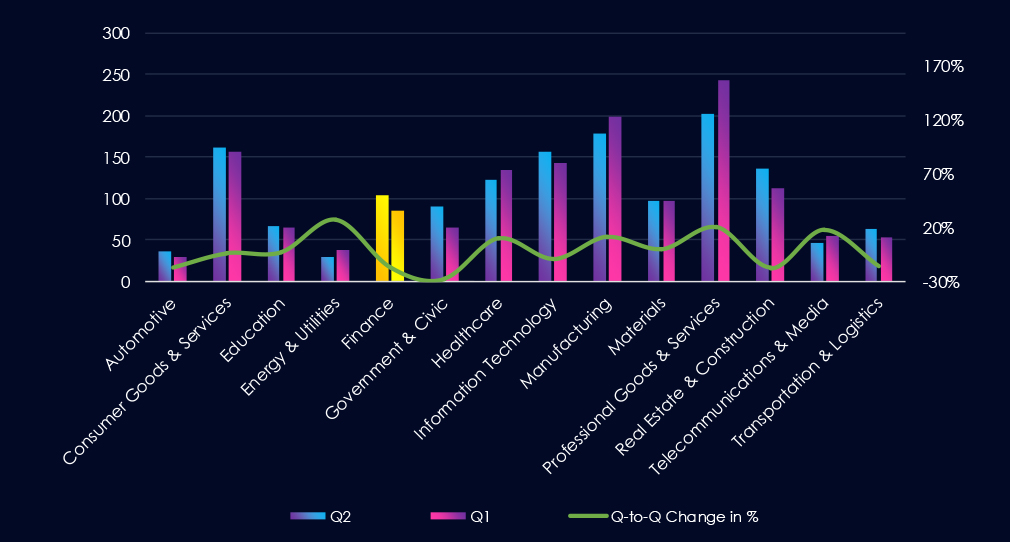
Chart shows quarter-to-quarter changes in targeted countries. Data is sorted by the last 90 days and compared to the previous 90 days marked in blue.
Finance victimology shows major decline in US based victims and huge spike in South Korean victims. All those are recent Asset Management firm victims by Qilin.

The finance industry placed 8th out of 14 monitored industries, recording 86 victims in the last 90 days, a mild decline of -17.2% from 104 victims in the previous 90-day period.
Overall share also mildly decreased from 6.85% to 5.67% of all ransomware victims.
Monthly Activity Trends
Monthly activity recorded a spike during May, followed by a dip, and from August to September, renewed growth.
Finance industry ransomware activity showed *high risk for South Korea in recent weeks.
Ransomware Gangs
A total of 27 out of 77 active ransomware groups targeted this industry in the past 90 days – 35% participation:
Qilin: The most active, with 31 victims and 14.2% (31 out of 219) victims. Also, 20 out of those 31 victims were South Korean asset management firms, showing a major breach in this sector.
Everest, Da4rk4rmy: Highest shares in top 5, 19% (7 out of 37) and 26% (5 out of 19) victims among top gangs.
Gunra, Radar: High share of finance victims (both 50%) showing finance is their primary focus, though a low number of total victims so far.
Geographic Distribution
The geographic distribution of ransomware victims is relatively high and spread across 26 countries. However, as mentioned, the US showed a major decline in victims and was replaced by a major breach in South Korea.
Notably, Latin and Central American countries are very frequent on the victims’ list.
For a comprehensive, up-to-date global ransomware tracking report, please refer to our new monthly “Tracking Ransomware” series here.
APT Campaigns (High): The finance industry remains a prime target for APT campaigns. In the past 90 days, 11 out of 16 observed campaigns (69%) affected financial institutions, up from 60% in the previous period. Activity was steady, with peaks in July (4 campaigns) and sustained targeting into August and September. Threat actors included a mix of Chinese (Stone Panda, Volt Typhoon, Salt Typhoon, APT27), Russian (FIN7, FIN11, TA505, Gamaredon), North Korean Lazarus, Iranian Fox Kitten, Pakistani Transparent Tribe, and regional actors such as Turkish and Thai groups. Japan, the US, and the UK were top targets, followed by South Korea, India, and other Asian and Middle Eastern countries. Campaigns mainly exploited web applications, operating systems, and management software.
Underground & Dark Web Chatter (High): Finance accounted for 13.9% of all dark web chatter, ranking 3rd among industries. Data breaches surged (984 → 2241), as did data leaks (966 → 1753), reflecting systematic theft and resale of financial data, including payment details and customer accounts. Ransomware chatter remained high but declined in the most recent 30 days, while claimed hack posts dropped sharply, suggesting attackers may be monetizing access privately. DDoS mentions grew modestly, hinting at extortion-driven disruption campaigns.
Vulnerabilities (Moderate): The finance sector represented 2.7% of industry vulnerabilities, ranking 12th. Injection flaws spiked (17 new cases), pointing to persistent risks in financial applications. RCE vulnerabilities continued to rise, highlighting exposure to high-severity exploits. Other categories, such as privilege escalation, DoS, and information disclosure, were reported at low but increasing levels. Information disclosure related CVEs are correlating with an increase in underground chatter.
Ransomware (*Moderate): Finance placed 8th among industries, with 86 victims in the last 90 days, a -17% drop from 104 in the prior period. Despite this overall decline, *South Korea experienced a major breach, as 20 of the 31 finance victims attributed to Qilin ransomware were South Korean asset management firms. This event marked one of the most significant regional financial ransomware campaigns in recent years. Other active groups included Everest and Da4rk4rmy, which showed high percentages of finance sector targeting. Victims spanned 26 countries, though the US saw declines compared to the previous period, while South Korea and Latin and Central America became more prominent hotspots.