
The CYFIRMA Industries Report delivers original cybersecurity insights and telemetry-driven statistics of global industries, covering one sector each week for a quarter. This report focuses on the finance industry, presenting key trends and statistics in an engaging infographic format.
Welcome to the CYFIRMA infographic industry report, where we delve into the external threat landscape of the finance industry over the past three months. This report provides valuable insights and data-driven statistics, delivering a concise analysis of attack campaigns, phishing telemetry, and ransomware incidents targeting financial organizations.
We aim to present an industry-specific overview in a convenient, engaging, and informative format. Leveraging our cutting-edge platform telemetry and the expertise of our analysts, we bring you actionable intelligence to stay ahead in the cybersecurity landscape.
CYFIRMA provides cyber threat intelligence and external threat landscape management platforms, DeCYFIR and DeTCT, which utilize artificial intelligence and machine learning to ingest and process relevant data, complemented by manual CTI research.
For the purpose of these reports, we leverage the following data from our platform. These are data processed by AI and ML automation based on both human research input and automated ingestions.
While this report contains statistics and graphs generated primarily by automation, it undergoes thorough review and enhancement for additional context by CYFIRMA CTI analysts to ensure the highest quality and provide valuable insights.
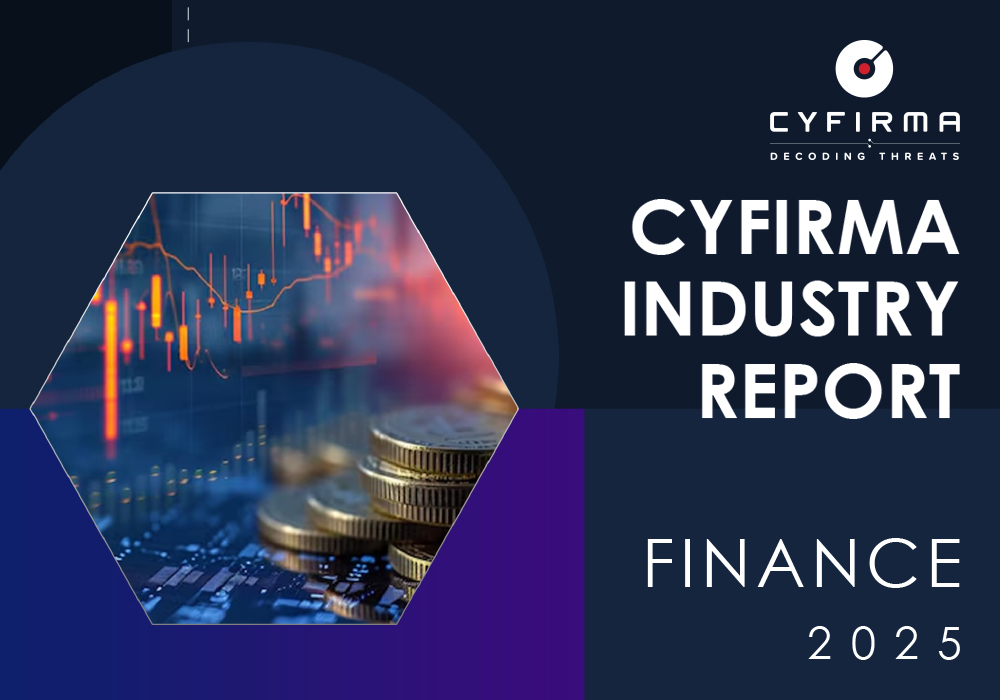
The finance industry featured in 8 out of the 8 observed campaigns, which is a presence in 100% of all campaigns, an increase from the previous period (4 out of 5, 80%) in both volume and overall share.
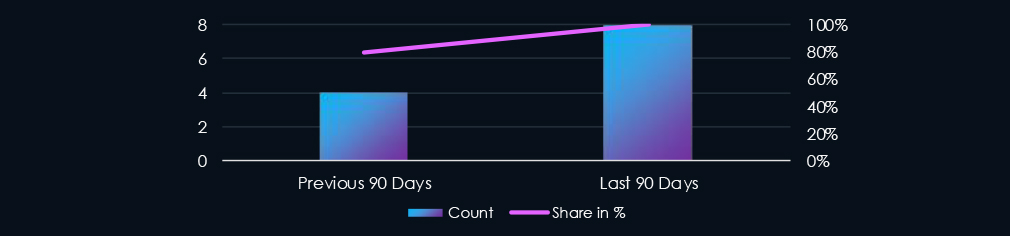
Number of observed campaigns increased over time, culminating in May with 5 campaigns observed as active.
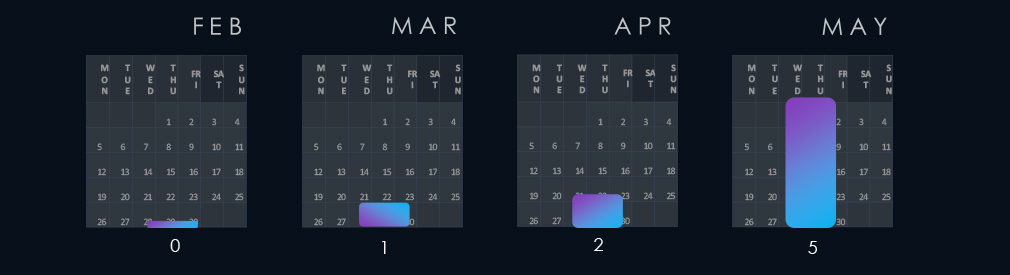
Apart from the usual Chinese (Panda, Typhoon) and Russian (TA505, FIN11) threat actors, we have observed yet unattributed Spanish, Turkish, Thai, and English-speaking groups. Further, we have observed the Algerian TA and Pakistani Transparent Tribe. This shows an expanding modern threat landscape.
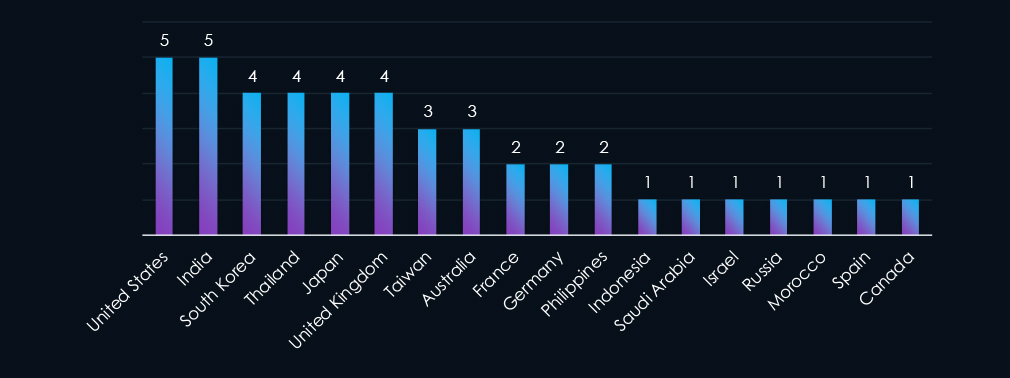
In five out of eight campaigns, India and the United States were featured. South Korea, Thailand, Japan, and the United Kingdom were featured in four out of eight campaigns. In addition, targeted geographies are distributed globally, underscoring the diverse origins of threat actors, each with unique objectives and targets.
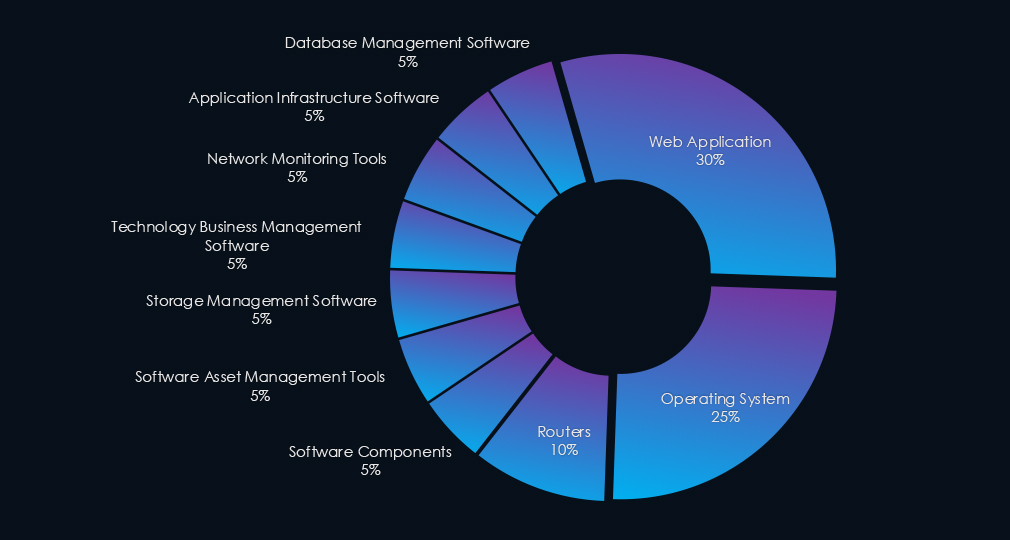
Web applications were the primary targets in most (6 out of 8) campaigns while operating systems and routers were exploited in multiple campaigns. Various tools and software were targeted in individual campaigns.

Over the past 90 days, the finance industry has been significantly impacted by advanced persistent threat (APT) campaigns. Notably, 8 out of 8 observed APT campaigns recorded victims in this industry. That is a 100% presence in observed campaigns.
This figure surpasses the previous 90-day period, during which 4 out of 5 campaigns targeted this industry, also increasing the overall share from the previous 80%.
Monthly Trends
The number of observed campaigns exhibited a gradual increase across the months of the last 90-day period, suggesting sustained interest and activity. The peak activity was observed in May, with 5 active campaigns.
Key Threat Actors
The campaigns were predominantly orchestrated by Chinese threat actors such as Stone Panda, Volt, and Salt Typhoon, as well as Russian actors like TA505 and FIN11. Additionally, we have identified Algerian, Pakistani, Vietnamese, and Turkish groups responsible for the observed campaigns.
Geographical Impact
The campaigns affected a total of 18 countries. India and the United States were the most affected, with 5 campaigns each. The United Kingdom, South Korea, Thailand, and Japan were also targeted by 4 campaigns each. Furthermore, various other countries were impacted across the globe, reflecting the diverse threat actors involved, each with distinct objectives and targets.
Targeted Technologies
Web applications were the primary targets of most campaigns. Operating systems and routers were also frequently attacked. Additionally, various management software, network monitoring tools, and application infrastructure were compromised.
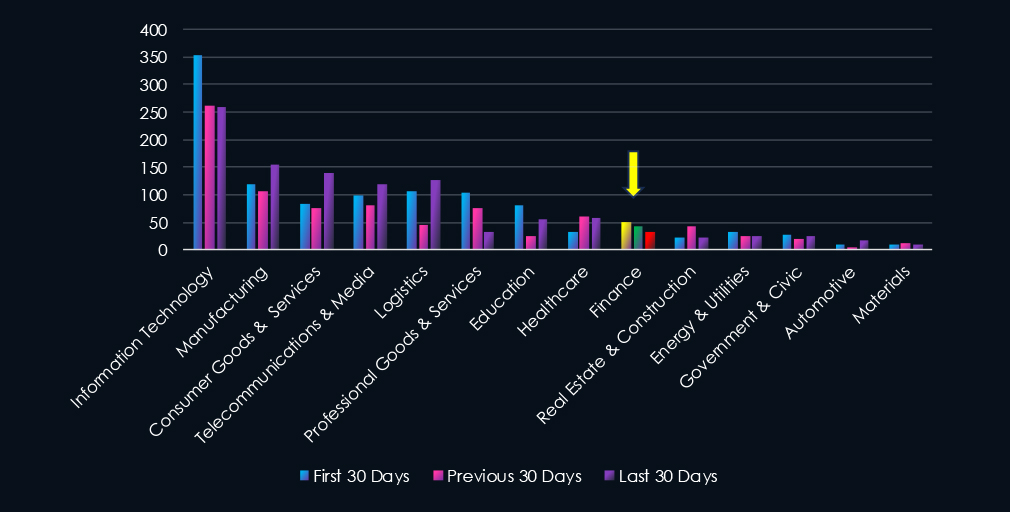
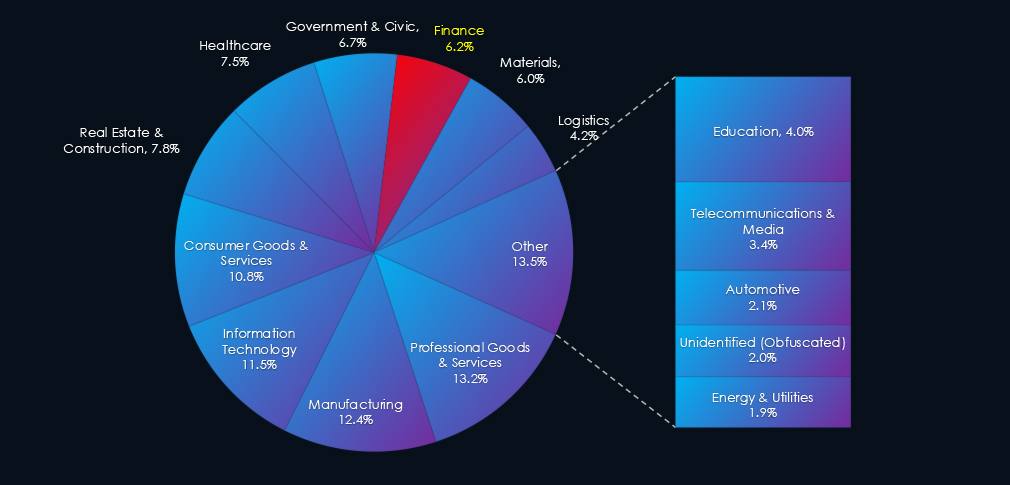
Over the past three months, CYFIRMA’s telemetry has identified 7,567 mentions of the finance industry out of a total of 65,808 industry mentions. This is from a total of 300k+ posts across various underground and dark web channels and forums.
Finance industry placed 3rd out of 14 industries in last 90 days with a share of 11.5% of all detected industry-linked chatter.
Below is a breakdown of 30-day periods of all mentions.
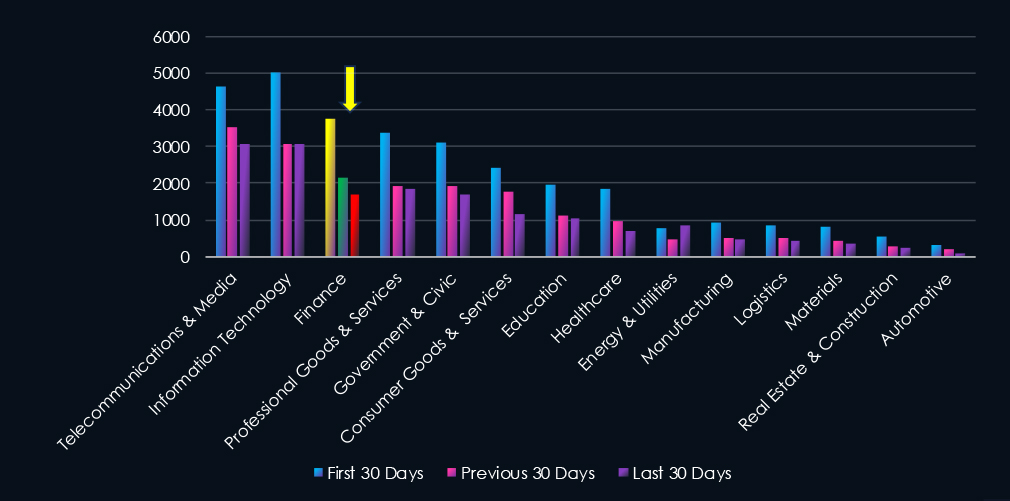
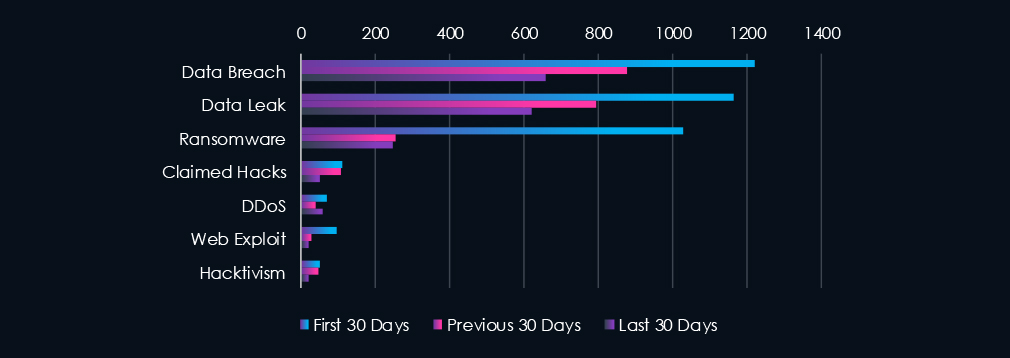
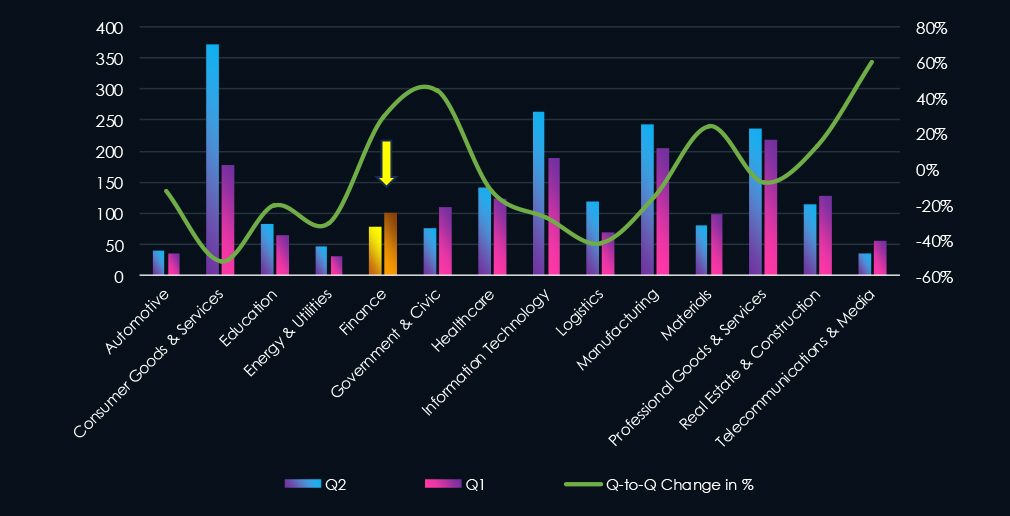
Data Breaches and Data Leaks are the most common category of recorded chatter for this industry. Ransomware chatter was very high in the first 30 days and declined sharply during the last 60 days.
In total, finance industry comprise of 11.5% of all detected industry underground and dark web chatter in the last 90 days, ranking 3rd out of 14 industries.
Below are observed key trends across 90 days:
Significant Drop in Core Threats
Data Breach: 1220 → 877 → 660 (↓46% from start)
Data Leak: 1164 → 795 → 619 (↓47%)
Indicates reduced breach volume or successful data protection, but still high absolute threat levels.
Ransomware Declined Sharply After Initial Surge
1028 → 255 → 246 (↓76%)
Finance was a major early target—drop may reflect stronger defences or a tactical pivot by threat actors.
Claimed Hacks Trending Down
110 → 108 → 52
Suggests fewer publicized or extortion-based breaches being flaunted on forums.
Web Exploits and Hacktivism Losing Steam
Web Exploit: 96 → 29 → 20 (↓79%)
Hacktivism: 49 → 48 → 22 (↓55%)
Likely due to improved security hygiene and decreased activist focus on financial targets.
DDoS Resurging Slightly
71 → 38 → 60
While lower than peak, the rise suggests renewed interest in disruption-based attacks, possibly tied to geopolitical or reputational motives.
Over the past three months, CYFIRMA’s telemetry has identified 125 mentions of finance industry out of a total of 3,088 industry mentions. This is from a total of 11,210 CVEs reported in 90 days.
Finance industry ranked 9th out of 14 industries in last 90 days with share of 4.05% of all detected industry linked vulnerabilities.
Below is a breakdown of 30-day periods of all mentions.
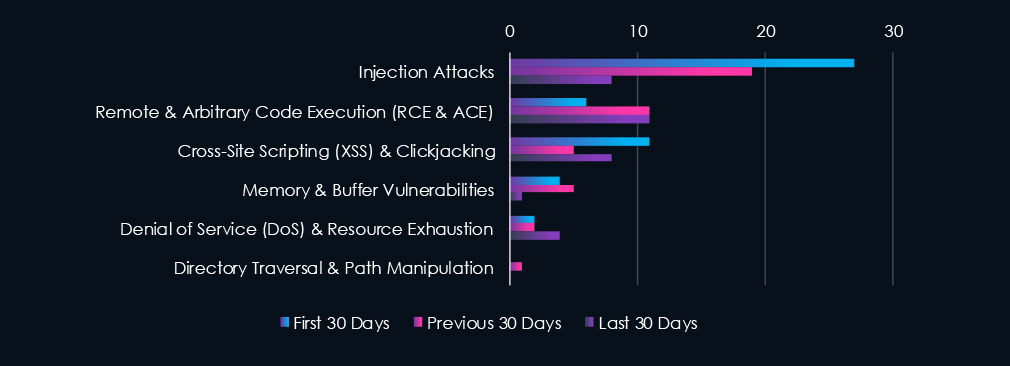
Injection Attacks are leading the chart. Code Execution (RCE, ACE) is in second place, however, increased sharply after first 30 days. Cross-Site Scripting (XSS) & Clickjacking Arbitrary are in close third place.
In total, finance industry comprise of 4.05% of all detected industry-linked vulnerabilities in the last 90 days, ranking 9th out of 14 industries.
Below are observed key trends across 90 days.
Injection Attacks in Steady Decline
27 → 19 → 8 (↓70% from start)
Indicates either improved input validation/security hygiene or fewer publicly disclosed injection flaws in financial platforms.
RCE Still a Core Risk
6 → 11 → 11
While lower in volume than injection, Remote Code Execution remains persistent and critical—capable of full system compromise.
XSS Slightly Rebounding
11 → 5 → 8
Fluctuating, but suggests ongoing exposure in front-end apps or customer portals.
Memory Vulnerabilities Dropping Off
4 → 5 → 1 → Suggests improvement in backend systems, or a shift in attacker focus.
DoS Vulnerabilities Slightly Increasing
2 → 2 → 4
Matches the resurgence in DDoS chatter on the dark web, indicating a potential uptick in exploitability.
Minimal File-Based Vulnerabilities
Directory Traversal:
Only 1 mention across all periods → low risk currently, but should still be monitored in complex web apps.
In the past 90 days, CYFIRMA has identified 102 verified ransomware victims in finance industry. This accounts for 6.2% of the overall total of 1,647 ransomware victims during the same period. Placing finance industry 8th out of 14 industries.
Furthermore, a quarterly comparison reveals an increase of interest in financial organizations of +29.1% from 79 to 102 victims. The overall share increased from 4.0% to 6.2% of all victims, among the highest increases across industries.
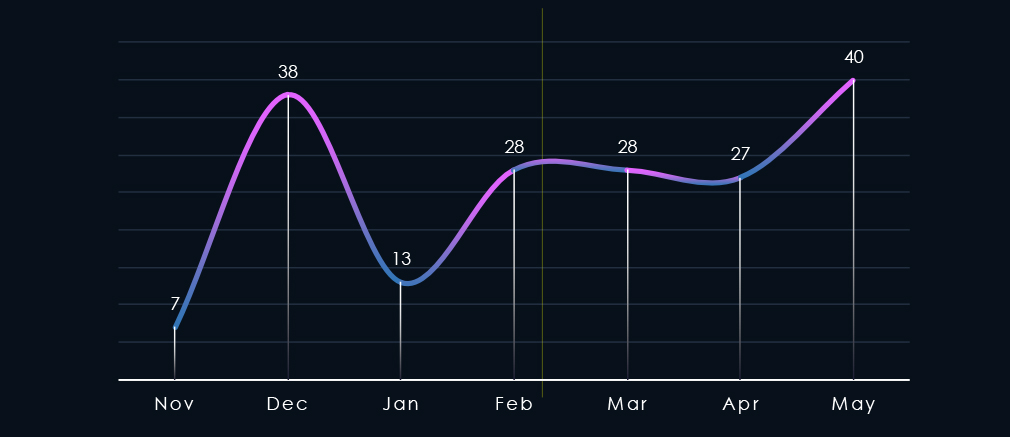
Over the past 180 days, we have observed sustained activity across months with a spike during December followed by a dip in January. Later in May, we recorded another spike caused by the SilentRansomGroup victims’ dump that included many finance organizations.
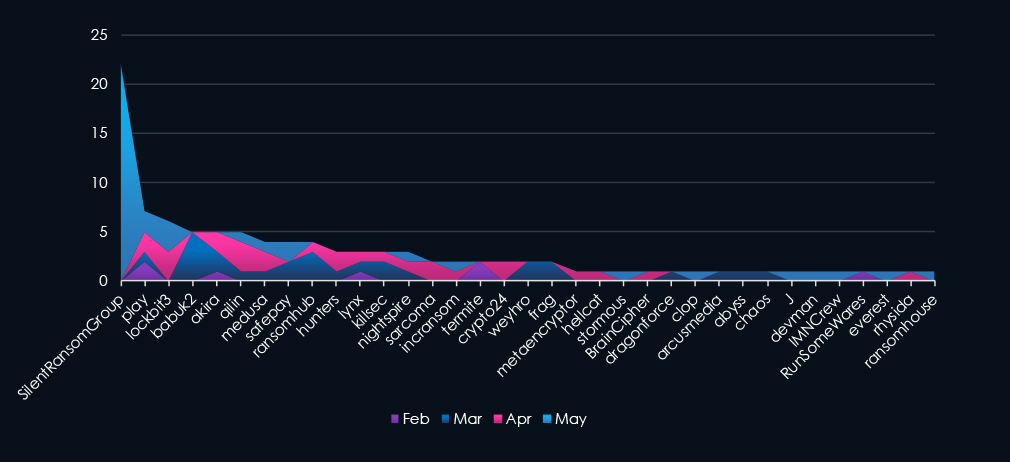
A breakdown of monthly activity per top 30 gangs provides insights into which gangs were active each month. For example, the most active gang, SilentRansomGroup, was behind the May spike. Whereas Babuk2 recorded all victims during March.
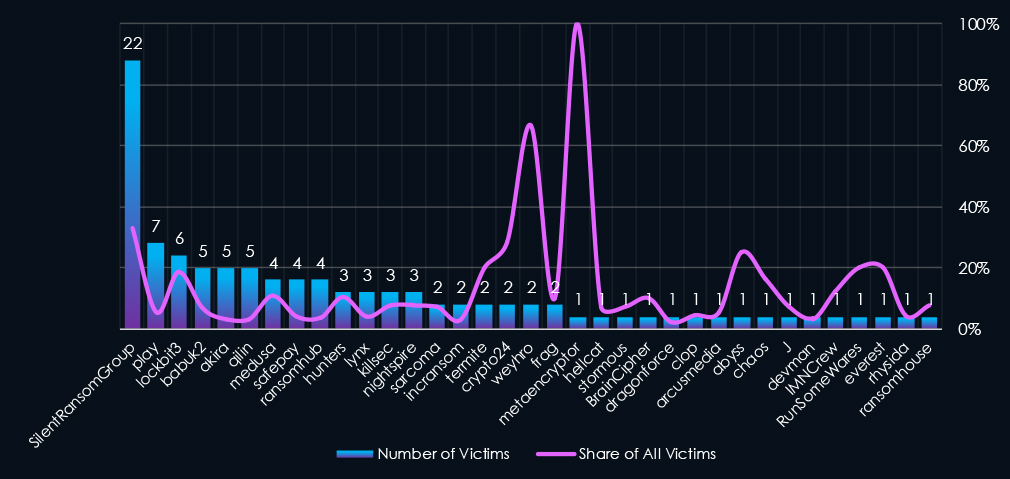
Out of the 72 gangs, 35 recorded victims in this sector in the last 90 days (49% participation), SilentRansomGroup had the highest number of victims (22), followed by Play (7) and LockBit3 (6).
The share of victims for many gangs in this industry is moderate and mixed. Only 4 of the top 10 gangs recorded 10% or more of the victims in this industry while 5 have below 5%.
Among the top 5 gangs, SilentRansomGroup (33%) and LockBit3 (19 recorded high shares in this industry, suggesting a focus on financial organizations. Particularly the “SRG” rampage disproportionately hit this industry.
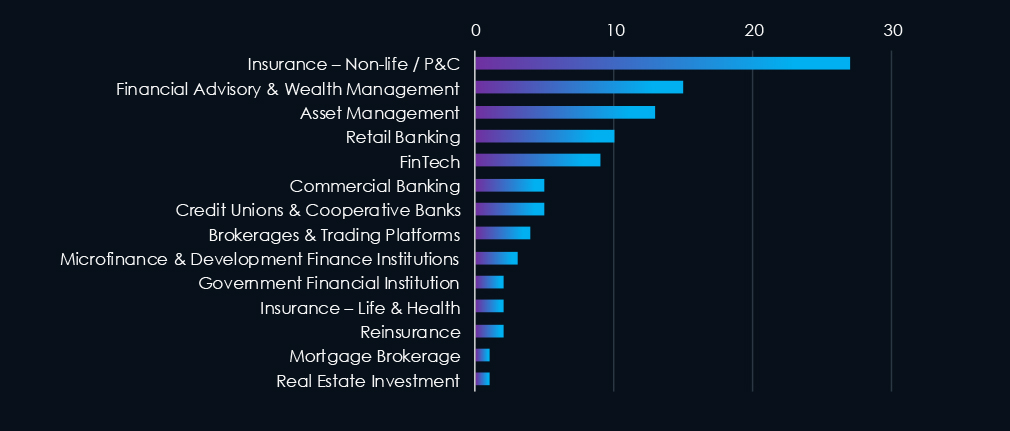
Property, casualty, auto, liability, and related insurance providers (Non-life /P&C) are by a significant margin the most frequent victims of ransomware in this industry in the past 90 days.
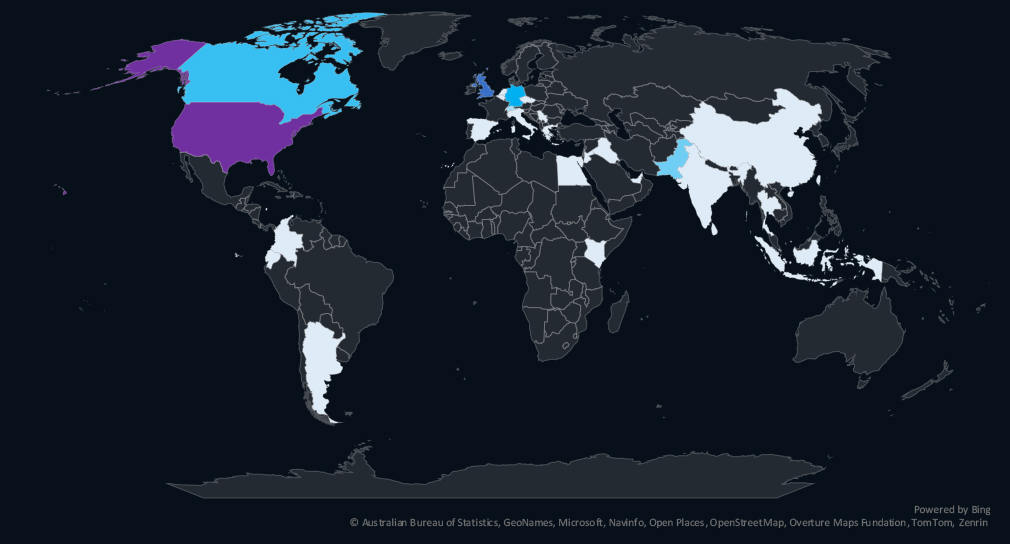
The geographic distribution heatmap underscores the widespread impact of ransomware, highlighting the countries where victims in this industry have been recorded.
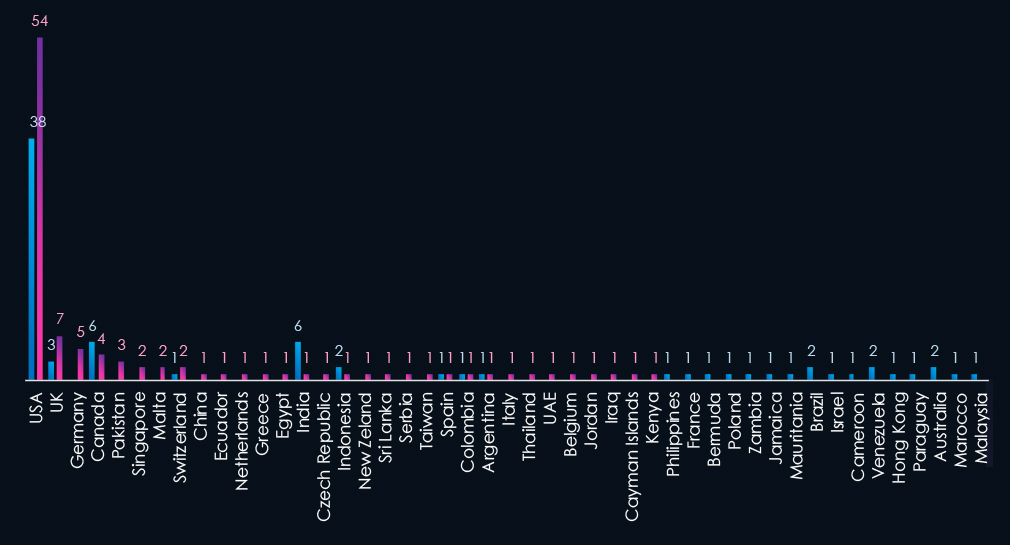
The chart shows quarter-to-quarter changes in targeted countries. Data is sorted by last 90 days and compared to the previous 90 days marked blue.
The USA recorded 54 victims in the last 90 days, an increase from 38 and represents 53% of all victims. The UK, Germany, and Canada follow at the top. Notable is Pakistan in 5th place.

Finance industry placed 8th out of 14 monitored industries recording 102 victims in last 90 days, an increase of +29% from 79 victims in previous 90 days period.
Overall share grew from 4.0% to 6.2% of all ransomware victims.
Monthly Activity Trends
The monthly activity was sustained across the last 180 days with a spike in May.
SilentRansomGroup victim dump in May disproportionately hit this industry, mainly non-life insurance providers.
The Finance industry is not a very frequent target of ransomware beyond the recent SilentRansomGroup victim dump.
Ransomware Gangs
A total of 35 out of 72 active ransomware groups targeted this industry in the past 90 days – 49% participation:
SilentRansomGroup: The most active with 22 victims and 33% (22 out of 67) victims.
LockBit3: Second highest share of 19% (6 out of 32) victims among top gangs, suggesting a possible focus on the finance industry.
Akira, Qilin: Two most active gangs in last 90 days. Recorded a low share of their victims 3.3% each in this industry.
Geographic Distribution
The geographic distribution of ransomware victims is relatively high given number of victims, though North America dominates. The USA (54) accounts for 53% of all victims. Followed by the UK (7), Germany (5), Canada (4) and Pakistan (3).
In total, 31 countries recorded ransomware victims in this industry in the last 90 days, an increase from 25 in the previous period.
For a comprehensive, up-to-date global ransomware tracking report, please refer to our new monthly “Tracking Ransomware” series here.
APT Campaigns (High): The finance industry faced significant APT activity over the past 90 days, with all 8 observed campaigns (100%) impacting this sector—an increase from 80% in the prior period. Attacks steadily increased and peaked in May. Campaigns were led by established Chinese (Stone Panda, Volt, Salt Typhoon) and Russian (TA505, FIN11) groups, along with Pakistani, Algerian, Vietnamese, and Turkish actors. A total of 18 countries were affected, with India and the U.S. appearing in five campaigns each. Web applications were the most common target, followed by operating systems, routers, network tools, and business infrastructure.
Underground & Dark Web Chatter (High): Finance ranked 3rd in overall dark web activity, comprising 11.5% of observed chatter. While still high in volume, mentions of data breaches (−46%), data leaks (−47%), and ransomware (−76%) dropped significantly across the period. Claimed hacks and exploit chatter also declined. Hacktivism lost momentum, but DDoS threats showed a slight resurgence—potentially reflecting renewed interest in disruption tactics linked to political or reputational motives.
Vulnerabilities (Moderate): The finance sector ranked 9th for linked vulnerabilities (4.05%). Injection flaws declined sharply (−70%), while RCE remained a persistent core threat. XSS rebounded slightly, and DoS-related CVEs saw a small increase, mirroring DDoS chatter. Other categories such as memory issues, directory traversal, and privilege escalation remained minimal or stable—indicating improved security posture in some backend systems.
Ransomware (Moderate): Finance placed 8th by volume, recording 102 ransomware victims—a 29% increase from the previous period. The share of total ransomware victims rose from 4.0% to 6.2%. May saw a spike driven by SilentRansomGroup, which heavily targeted non-life insurers. Of 72 active ransomware groups, 35 attacked the sector. SilentRansomGroup accounted for 22 incidents (33% of its total), followed by LockBit3 (19%). While Akira and Qilin were the most active groups overall, they showed limited interest in finance. U.S. victims made up 53% of incidents. A total of 31 countries were affected—up from 25 last quarter—indicating growing geographic spread.