


CYFIRMA Industry Report : ENERGY
The CYFIRMA Industry Report delivers original cybersecurity insights and telemetry- driven statistics of global industries, covering one sector each week for a quarter. This report focuses on the Energy Industry, including Oil & Gas sector, presenting key trends and statistics in an engaging infographic format.
Welcome to CYFIRMA infographic industry report, where we delve into the external threat landscape of the Energy industry, over the past three months. This report provides valuable insights and data-driven statistics, delivering a concise analysis of attack campaigns, phishing telemetry, and ransomware incidents targeting energy, oil & gas organizations and related infrastructures.
We aim to present an industry-specific overview in a convenient, engaging, and informative format. Leveraging our cutting-edge platform telemetry and the expertise of our analysts, we bring you actionable intelligence to stay ahead in the cybersecurity landscape.

The Energy industry has witnessed a total of 17 observed campaigns, a relatively smaller number when compared to the 37 campaigns reported for the Finance industry in our recent update. This discrepancy aligns with the decreased interest from financially motivated APTs targeting the Energy sector.
The notable spike in campaign discovery during June is driven by Barracuda ESG vulnerability reporting, used by suspected China-nexus threat actor(s).

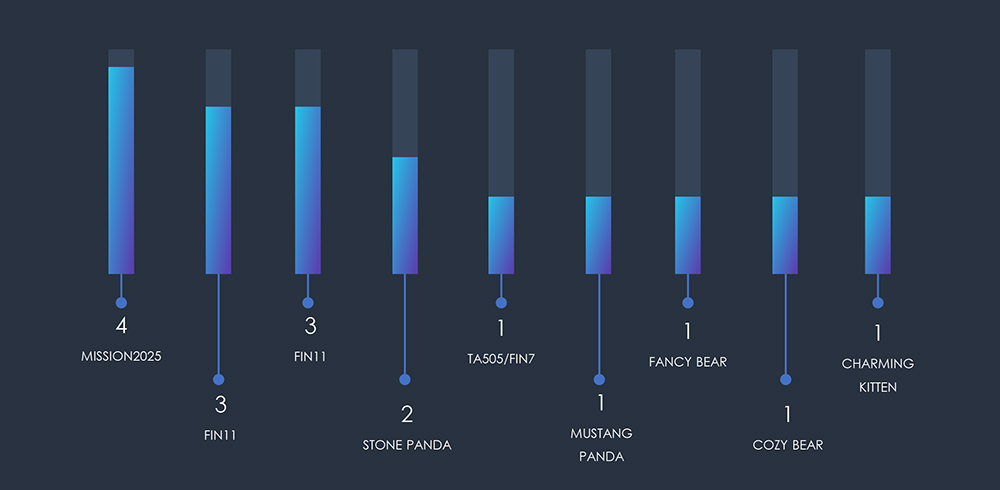
Within the Energy sector, the most active threat actors are MISSION2025, FIN11, and Lazarus Group. Remarkably, Chinese APTs stand out as the prevailing force, indicating significant interest from the Chinese government in targeting this industry.
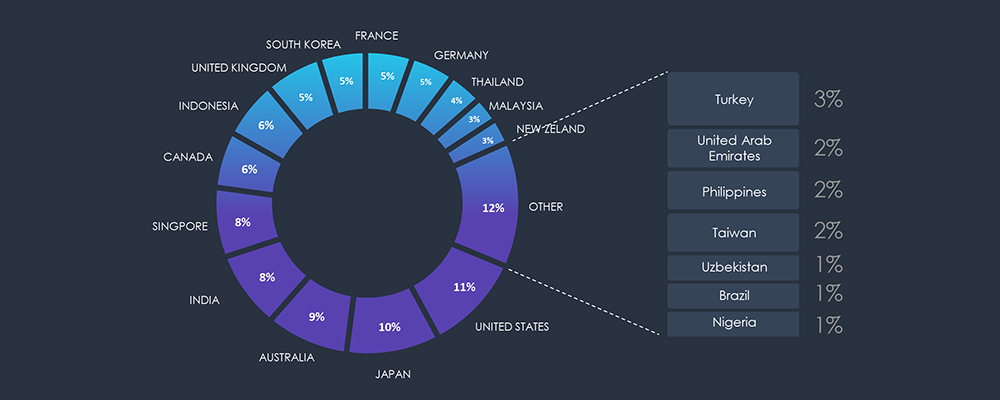
As anticipated, the observed campaigns primarily target developed nations boasting robust Energy and/or Oil & Gas industries.
Notably, China-based APT groups are responsible for the majority of these attacks. What sets these campaigns apart is their scale of targeting, which extends beyond the proportional size of the industry, revealing a distinct focus on China’s geopolitical adversaries.
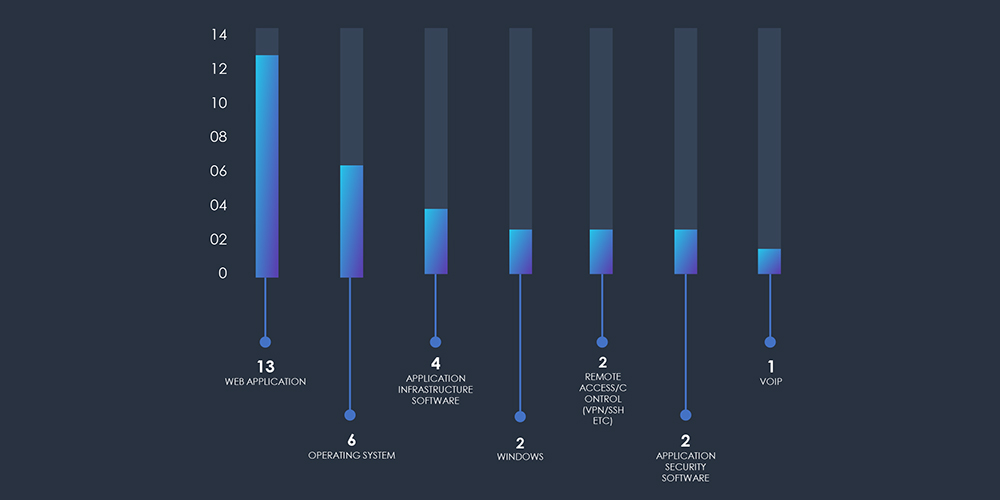
Analyzing the technologies targeted by sophisticated threat actors shows a clear emphasis on exploiting vulnerabilities within web applications, pinpointing weaknesses within the Windows operating system, and recognizing the strategic value of attacking application infrastructure.

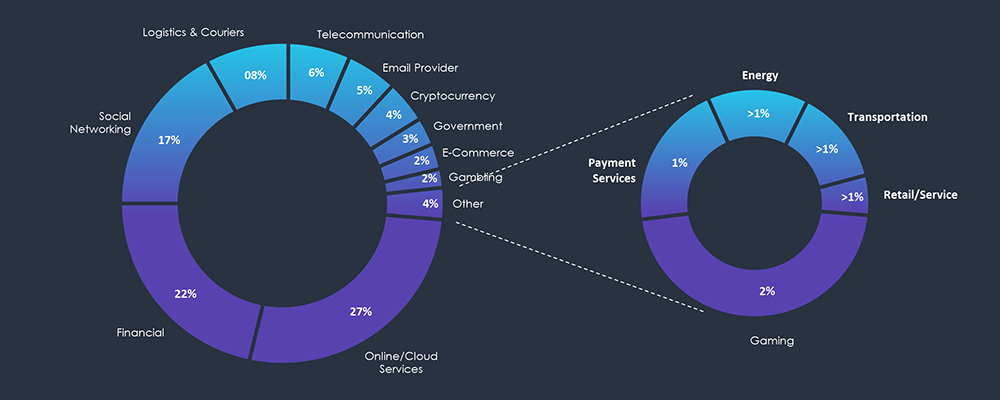
Phishing attacks explicitly targeting or impersonating the Energy Industry are relatively rare compared to other sectors. In the past 90 days, CYFIRMA’s telemetry observed 502 out of 231,556 phishing attacks involving the Energy sector. Which constitutes about ~1% of all observed phishing attacks and presents the third smallest category in our metrics.
Given the limited volume of observed samples and the geographical delineation, based on Autonomous System Numbers (ASN), achieving a comprehensive overview becomes challenging. For the most part, the ASN origin aligns with the targeted or impersonated brand. However, interestingly, according to the brands’ chart, Polish impersonated companies have an ASN origin from Germany.
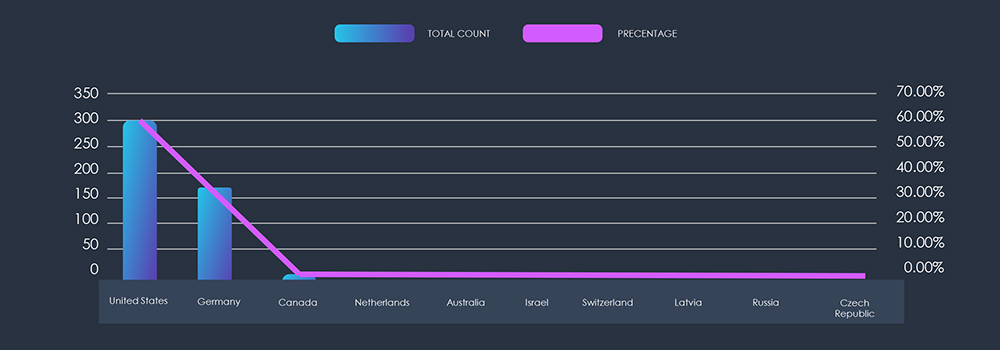
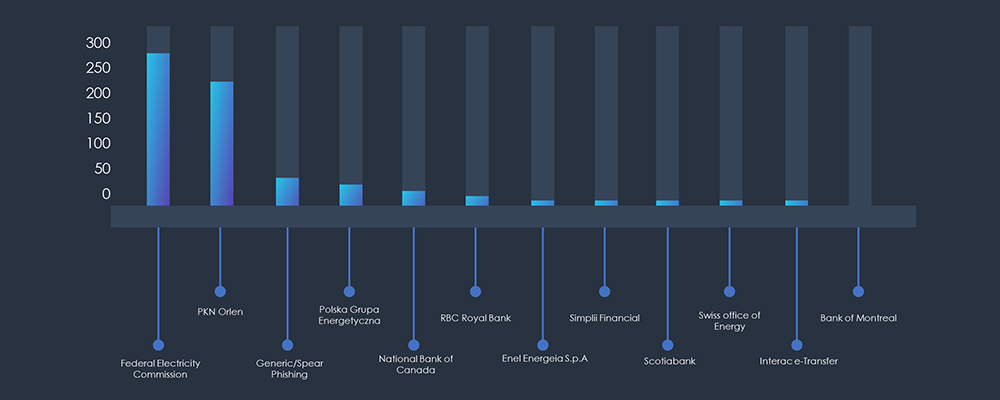
Corresponding to geographic distribution, the most impersonated organization is US Federal Electricity Commission, followed by Polish multinational oil refiner & petrol retailer; PKN Orlen and Polish Energy Group. Their presence in countries like Germany, the Czech Republic and Latvia explains their representation on the geography chart.
The presence of Canadian banks stems from the use of domain “interac[.]energy”, which appears to host phishing attacks for both Canadian banks and Utility companies.
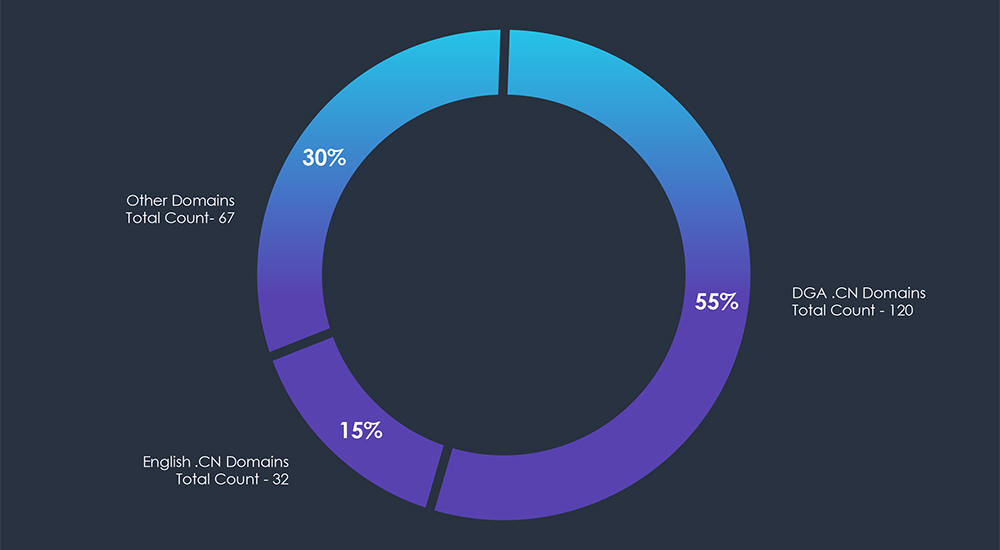
Analysis of observed domains hosting the landing phishing sites shows that out of 219 unique observed domains, 152 of them are .CN top-level domains.
Furthermore, 120 of those are created using Domain Generating Algorithms (DGA), using 7 characters long string before the .CN top-level domain.
Lastly, all .CN domains were used to impersonate the US Federal Electricity Commission.
Over the last 90 days, CYFIRMA observed 58 verified ransomware victims from the Energy Industry, out of the overall total of 1298 incidents during the same period.
The total number of incidents per month appear to be roughly consistent, without highlighting any remarkable trends.

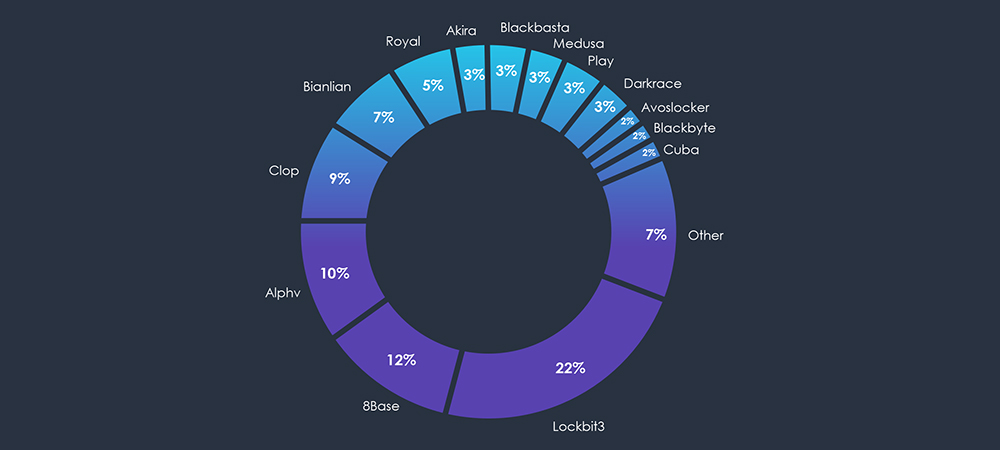
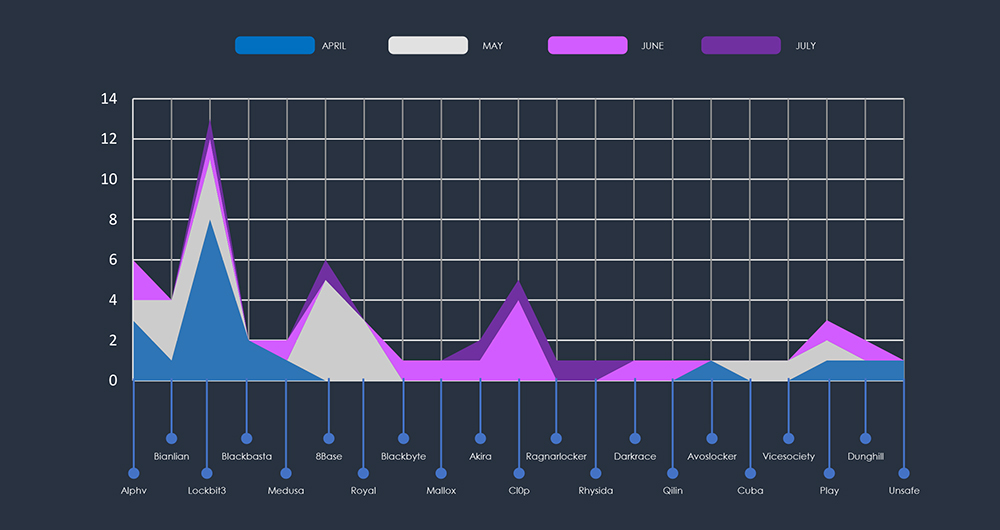
Incidents distribution per group is showing roughly the same distribution as the wider threat landscape. The larger number of incidents are by large gangs like Lockbit3, ALPHV or Cl0p.
A chart of activity per month for each group provides more detailed insight into how the number of total incidents past 90 days remained about even each month.
Each month one or two different larger gangs stand out with multiple victims in Energy Sector. While each month various small gangs register one or two victims.
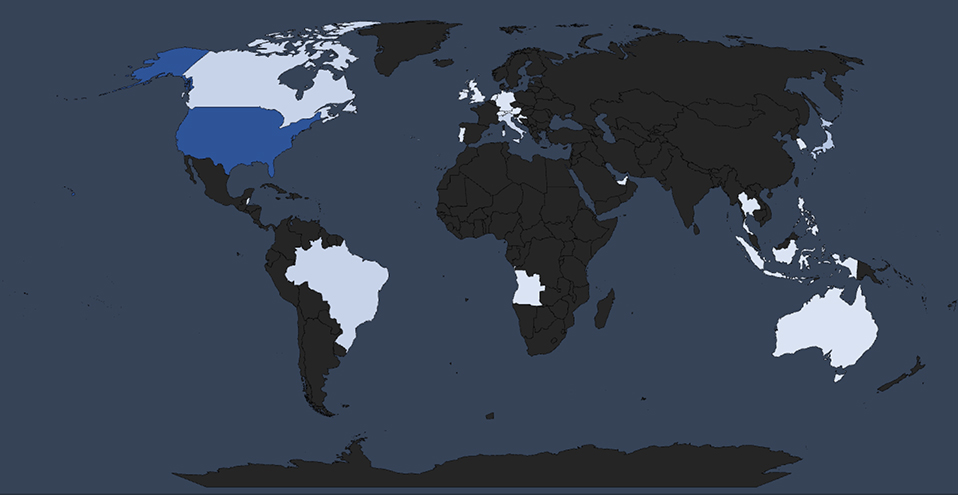
With 10 known incidents, the United States is the most affected by ransomware attacks in the Energy industry. This suggests that the US remains a prime target, due to its economic significance and digital infrastructure.
Global Spread – Remaining known incidents with known victim countries are Japan (3 victims), Canada (2 victims), Brazil (2 victims) and Italy (2 victims). This correlates not only with a broad threat landscape across industries, but also with countries known for significant and developed energy sectors.
The remaining countries with known and verified victims are spread around the globe, highlighting the global spread of ransomware. From the Caribbean nation of Belize and their primary energy distributor to Croatian power and petrochemical builder, Angolan Oil & Gas group, Indian coal miners or Indonesian Energy & Oil giant, ransomware hits on all continents.
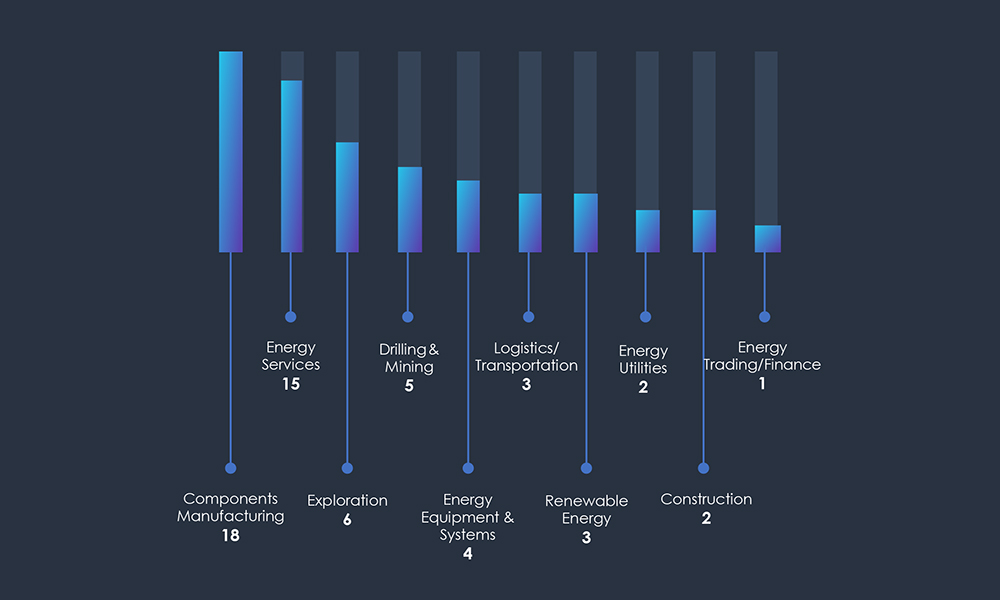
The distribution of ransomware incidents in the past 90 days was observed across multiple sectors. The sectors that experienced the highest impact were manufacturers of energy sector parts and components (31%), energy services (25%), exploration (10%), drilling and mining (9%), and energy equipment and systems suppliers (7%).
Vulnerable sectors – Manufacturing experienced the highest number of incidents, due to the known and common vulnerabilities, specifically against ransomware. The manufacturing sector remains a highly popular target regardless of its respective industry.
Broad targeting of energy services, exploration and mining/drilling, as well as renewable energy or energy utilities and oil & gas logistics, shows an opportunistic approach, rather than a coordinated focus on strategic targets like critical infrastructure.
The Energy industry tends to be less attractive to low and mid-tier threat actors due to the limited profit potential at their skill level, as suggested by the scarcity of relevant phishing campaigns. Consequently, when this industry is targeted, it is typically by Nation-State APTs, pursuing their respective geopolitical interests or by ransomware gangs.
Ransomware gangs, being profit-driven and opportunistic, are particularly drawn to manufacturing and services within the Energy sector. However, as per the sector breakdown of known ransomware victims, any segment within the Energy Industry, susceptible to ransom payments by disrupting core business operations or blackmailing with sensitive documents can become a target for both large and small gangs.