
The CYFIRMA Industry Report delivers original cybersecurity insights and telemetry-driven statistics of global industries, covering one sector each week for a quarter. This report focuses on the energy & utilities industry, presenting key trends and statistics in an engaging infographic format.
Welcome to the CYFIRMA infographic industry report, where we delve into the external threat landscape of the energy & utilities industry over the past three months. This report provides valuable insights and data-driven statistics, delivering a concise analysis of attack campaigns, phishing telemetry, and ransomware incidents targeting the energy industry.
We aim to present an industry-specific overview in a convenient, engaging, and informative format. Leveraging our cutting-edge platform telemetry and the expertise of our analysts, we bring you actionable intelligence to stay ahead in the cybersecurity landscape.
CYFIRMA provides cyber threat intelligence and external threat landscape management platforms, DeCYFIR and DeTCT, which utilize artificial intelligence and machine learning to ingest and process relevant data, complemented by manual CTI research.
For the purpose of these reports, we leverage the following data from our platform. These are data processed by AI and ML automation based on both human research input and automated ingestions.
While this report contains statistics and graphs generated primarily by automation, it undergoes thorough review and enhancement for additional context by CYFIRMA CTI analysts to ensure the highest quality and provide valuable insights.
Energy & utilities organizations featured in 4 out of the 6 observed campaigns, which is a presence in 66.6% of campaigns.
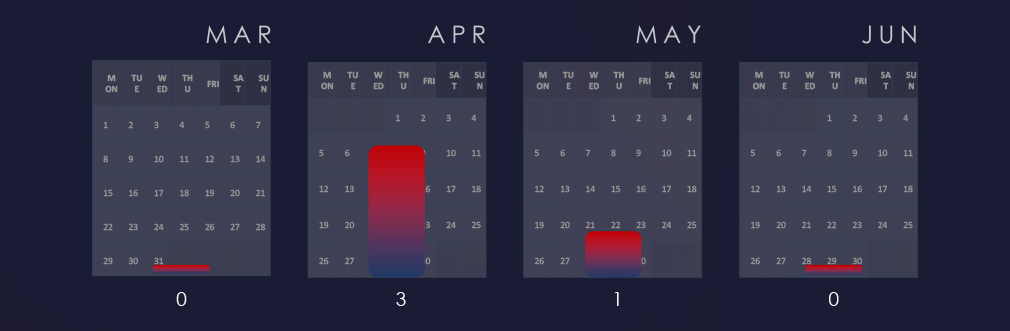
We are observing a generally low detections period. However, April recorded a mild spike in energy & utilities industry.
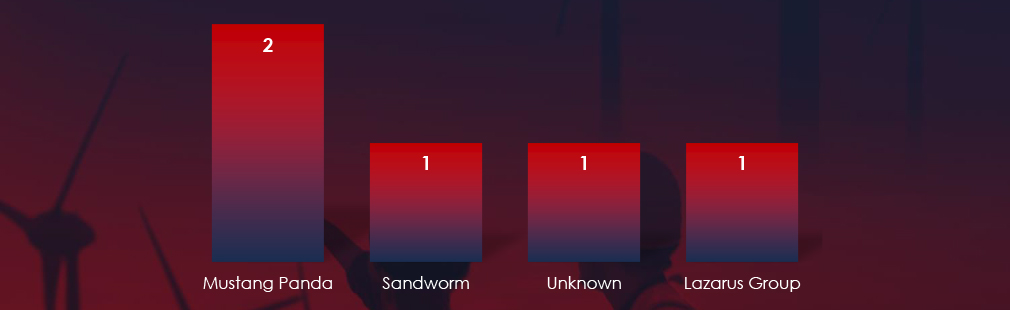
We observed varied mix of suspected threat actors. Most active were Chinese Mustang Panda, Lazarus Group from DPKR and Sandworm linked to Russian military intelligence (GRU). One campaign remains unattributed.
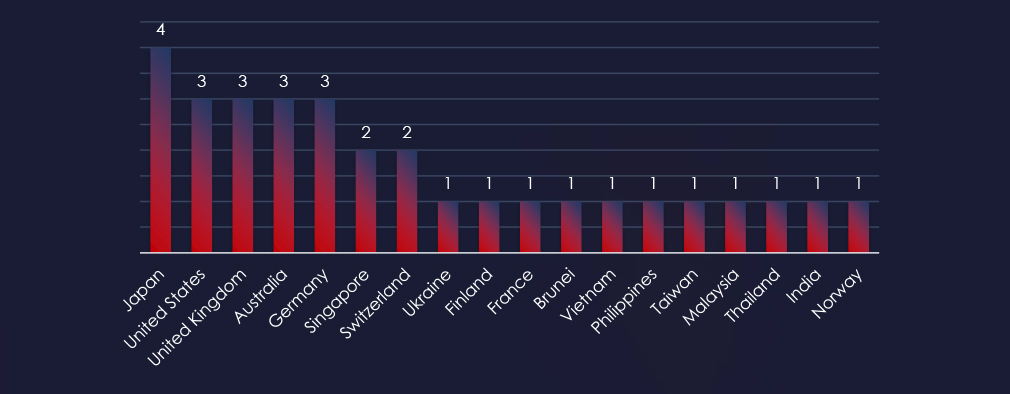
Recorded victims of observed attack campaigns span 18 different countries. Japan recorded victims in all 4 observed campaigns. The US, UK, Australia and Germany were hit by 3 out of 4 observed campaigns.
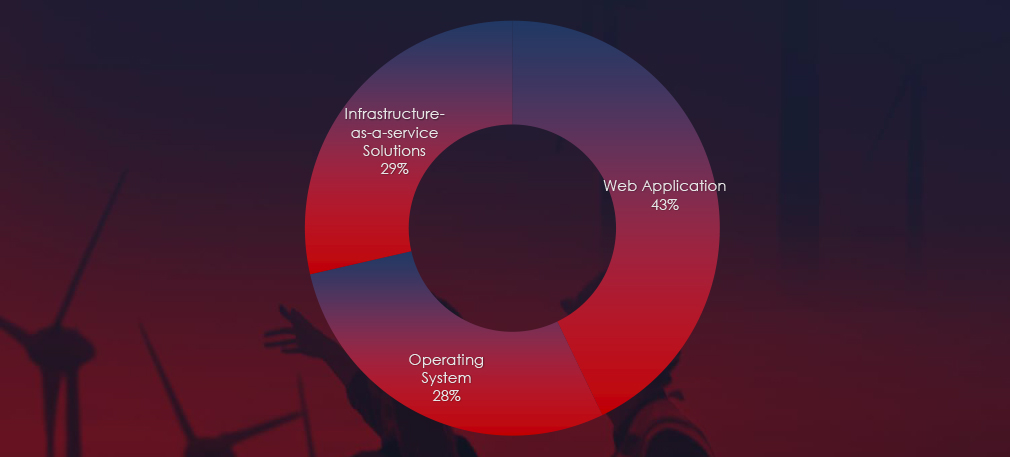
Web applications continue to rank as the most targeted technology across industries. Additionally, compromises were observed in operating systems and IaaS solutions.
Risk Level Indicator: High

In the past 90 days, energy & utilities organizations have been significantly impacted by advanced persistent threat (APT) campaigns. Notably, 66.6% of observed APT campaigns targeted the energy & utilities sector, with 4 out of 6 total campaigns affecting this industry.
Monthly Trends
An analysis of monthly trends revealed spike in APT activity in April. However, this was followed by a single detection until early June, indicating a temporary lull in attacks.
Key Threat Actors
The most active threat actors identified were the Chinese Mustang Panda linked to 2 campaigns, Lazarus Group from DPKR and Sandworm linked to Russian military intelligence (GRU). One campaign has not yet been attributed.
Geographical Impact
The campaigns impacted a total of 18 countries, with Japan being hit by all 4 observed campaigns. Other significantly affected countries included the United States, the United Kingdom, Australia, and Germany. This geographical spread correlates with the broad strategic interests of involved nation-states sponsoring these threat actors.
Targeted Technologies
Web applications emerged as the most targeted technology within these campaigns. Additionally, operating systems, IaaS solutions, and cloud technologies were also compromised, reflecting a diverse range of attack vectors employed by the threat actors.
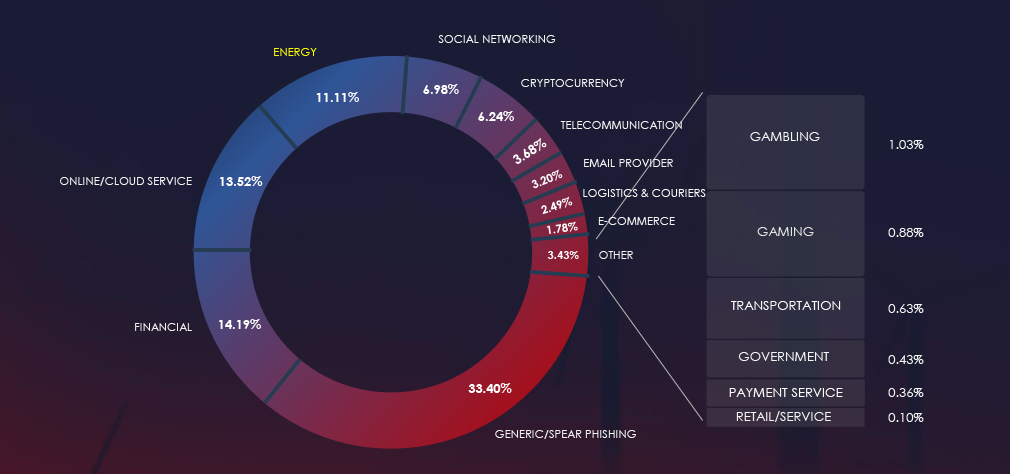
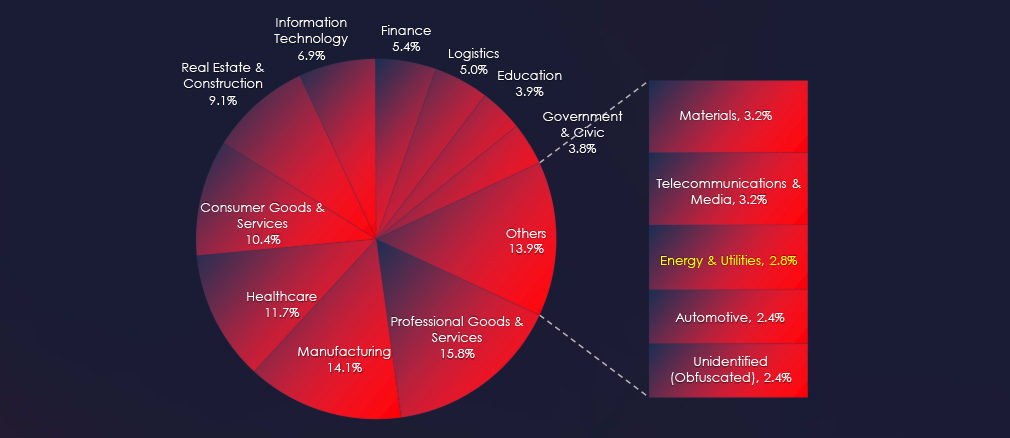
Over the past 3 months, CYFIRMA’s telemetry detected 34,168 phishing campaigns themed around energy & utilities out of a total of 307,708.
The chart below illustrates the global distribution of observed themes. Energy & utilities account for 11.11% of all captured phishing attempts.
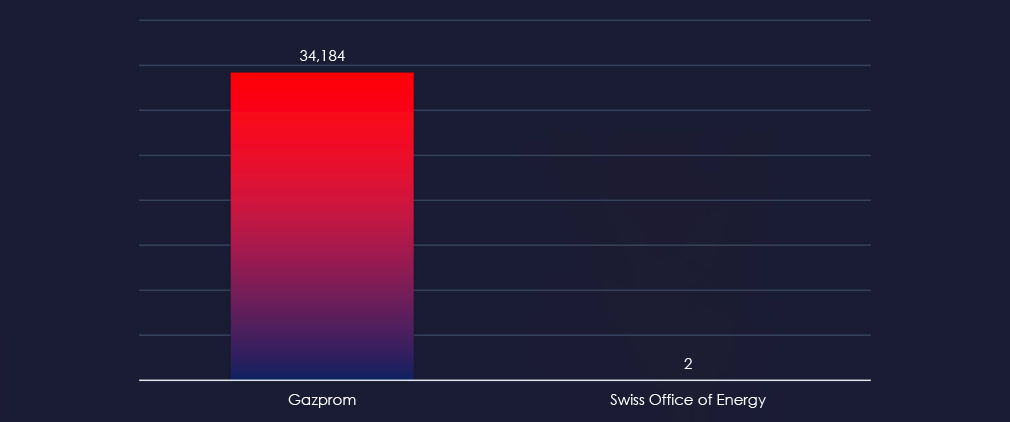
Nearly all energy related phishing is impersonating Russian energy giant Gazprom. Just 2 out of over 34,000 observed phishing was impersonation of Swiss Office of Energy.
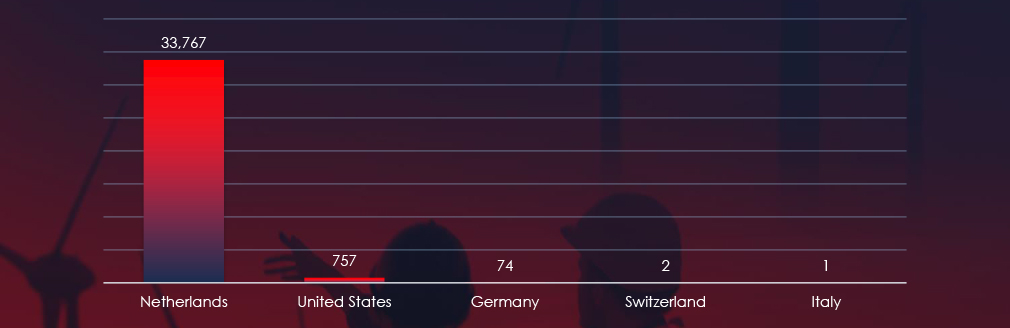
The geographical sources of observed phishing campaigns show that most of Gazprom themed phishing comes from Netherlands. Some come from the US and Germany.
Risk Level Indicator: Low

The energy & utilities warrants low risk factor despite large volumes of observed phishing. This is due to only Russian Gazprom being present. Generally speaking, energy & utilities are very fragmented by regions and do not present easy to monetize avenues for cybercriminals.
Overall, the list includes 2 organizations from 2 countries, Gazprom (Russia) and Swiss Office of Energy (Switzerland).
ASN-origin data reveals that the Netherlands is the leading source of phishing emails impersonating Gazprom. We don’t have a certain answer why, but Netherlands has been historically popular proxy for Eastern European threat actors, including Ukraine and Russia. Given ongoing conflict in the region and Gazprom being supplier to a large part of entire Europe, we can assume threat actors are using Gazprom theme to attack both sides of the conflict.
In the past 90 days, CYFIRMA has identified 35 verified ransomware victims in the energy & utilities industry. This accounts for 2.8% of the overall total of 1,231 ransomware victims during the same period.
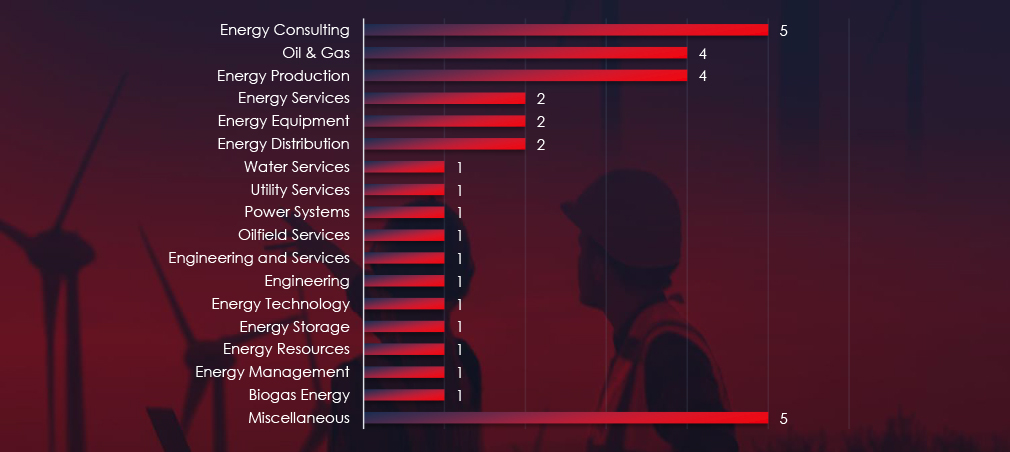
Energy consulting, production and Oil & Gas sectors are the most frequent victims of ransomware in the energy & utilities industry.
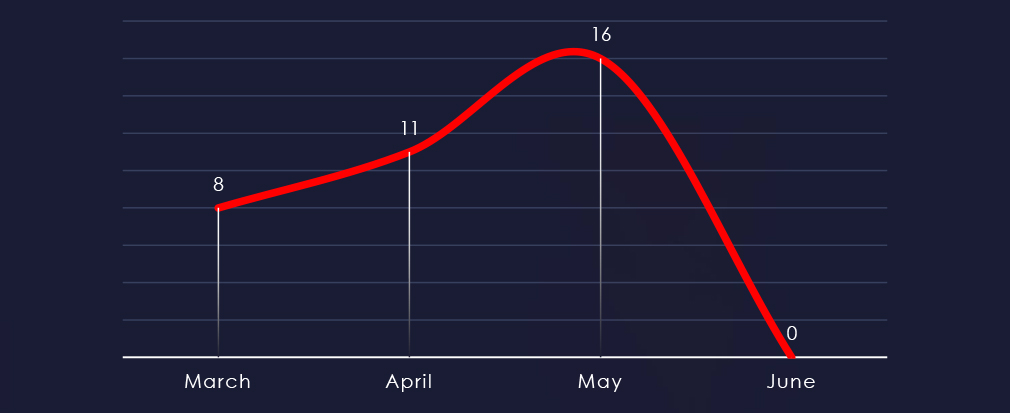
Considering just 4 days of June, we can see a growing trend from March to May.
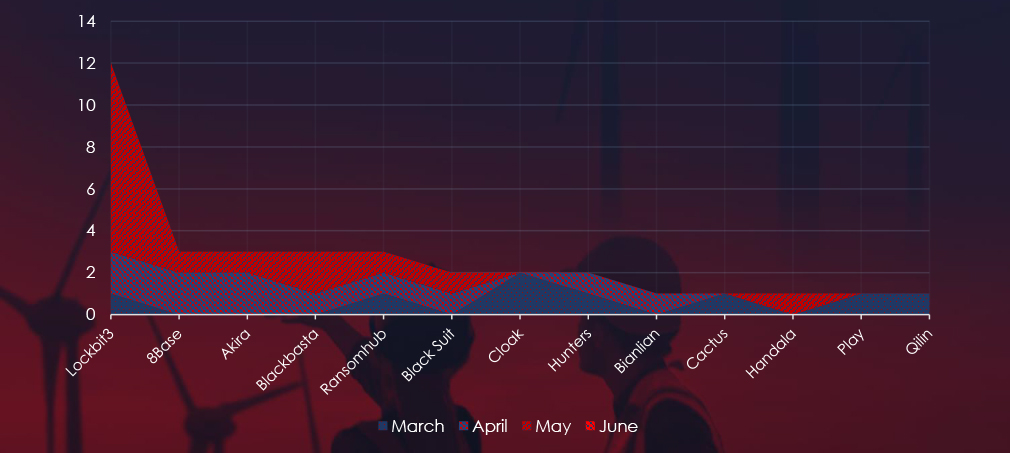
A breakdown of the monthly activity provides insights into which gangs were active each month. For example, LockBit3 came back in May and 8base with Akira reported many victims in April, whereas Cloak reported all their victims in March.
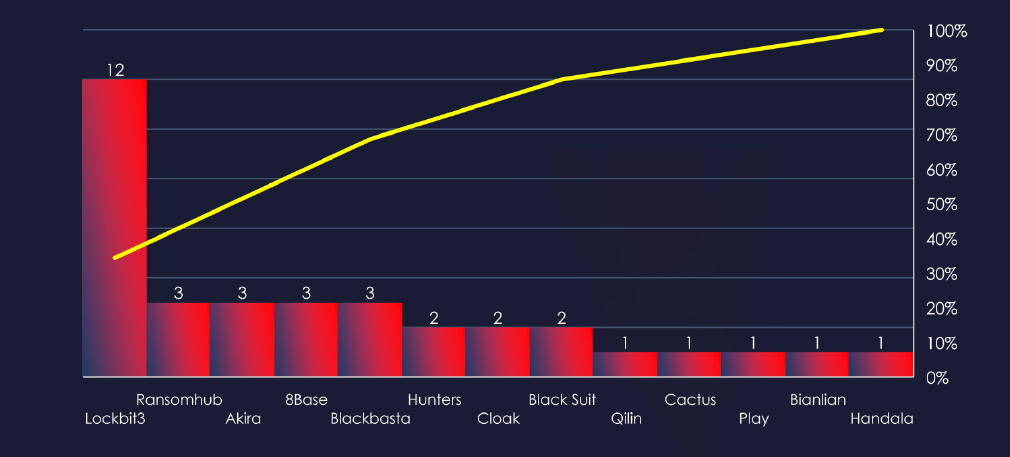
In total 13 out of 54 active groups recorded energy & utilities organizations victims in the past 90 days.
Comparing the energy & utilities industry to all recorded victims, none of the gangs particularly stand out with high percentage of victims in this industry. Highest is Cloak with 2 out of 19 (10.5%).
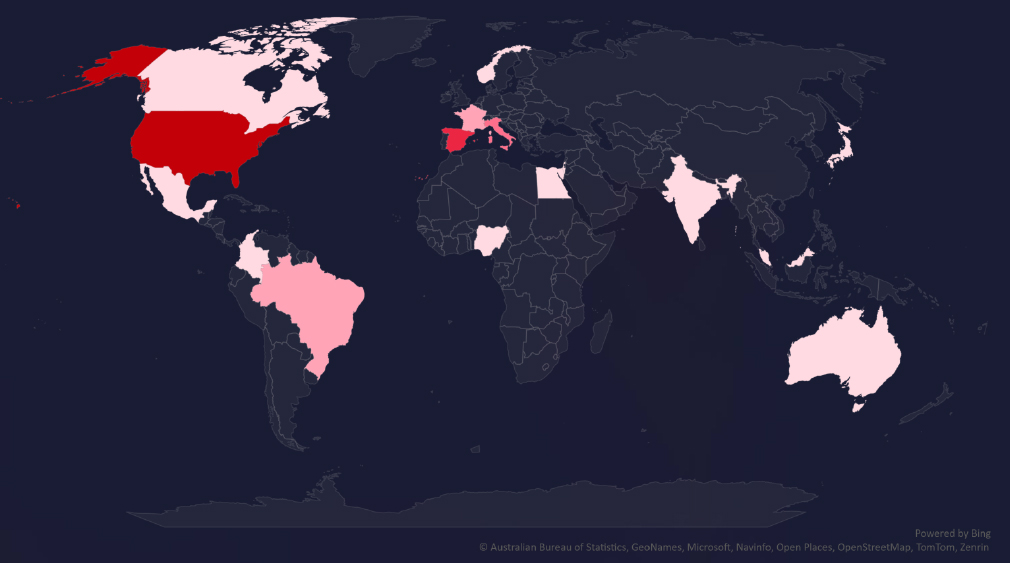
The geographic distribution heatmap underscores the widespread impact of ransomware, highlighting the countries where victims in this industry have been recorded.
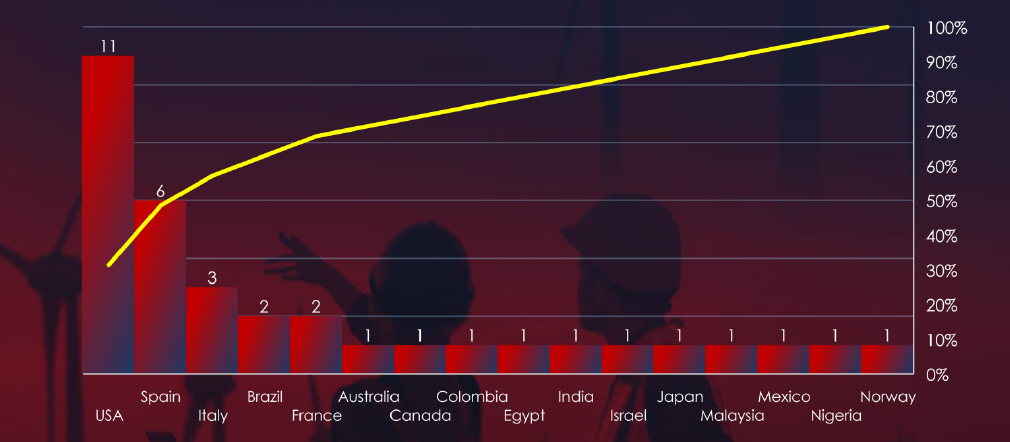
In total 16 countries recorded ransomware victims with the US alone accounting for ~34% of all victims with identified geography.
Risk Level Indicator: Low

The energy & utilities industry ranked as 13th in terms of the number of victims. It faces a lower ransomware threat, with attacks dispersed to a wide range of sub-sectors and a broad geographic distribution. The growing monthly activity, coupled with the involvement of numerous ransomware groups, presents a risk to keep an eye on.
Monthly Activity Trends
Ransomware activity in the energy & utilities industry has shown growing numbers of victims each month. However, this seems to be mostly due to return of LockBit3.
LockBit3 returned in May, contributing to the spike in activity during this month.
Ransomware Gangs
A total of 13 out of 54 active ransomware groups targeted the energy & utilities industry in the past 90 days:
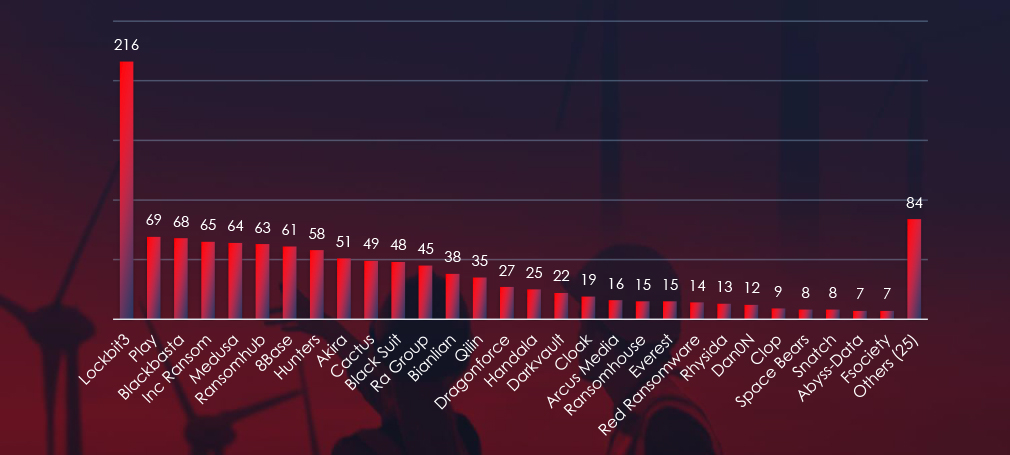
LockBit3: Responsible for 34% of all energy & utilities victims. However, only 5.5% out of all were in this industry (12 out of 216 victims).
Cloak: 10.5% of their victims were from the energy & utilities industry (2 out of 19 victims).
LockBit3 dominates but only due to sheer volume of attacks. Otherwise, there are no groups with apparent focus on this industry.
Geographic Distribution
The geographic distribution of ransomware victims in the energy & utilities industry highlights the widespread nature of these attacks:
34% of all victims with identified geography are located in the US. Spain appears to be significantly targeted in this sector in the last 90 days with 6 out of 35 (17.1%) recorded victims
In total, 16 countries reported ransomware victims in this industry.
For a comprehensive, up-to-date global ransomware tracking report, please refer to our new monthly “Tracking Ransomware” series here.
In the past 90 days, energy & utilities organizations have faced low to high risk across monitored categories.
APT campaigns present high risk, with a substantial 66.6% of observed APT campaigns in the past 90 days targeting it. The spike in APT activity during April, followed by a temporary decrease, suggests fluctuating but significant threat levels. Key actors like Mustang Panda, Lazarus Group, and Sandworm, backed by nation-state interests, have driven these attacks, affecting a broad geographical area including Japan, the US, the UK, Australia, and Germany. The primary attack vectors involve web applications, operating systems, IaaS solutions, and cloud technologies, reflecting a diverse range of tactics employed by the attackers.
In Phishing, despite large volumes of attempts, the energy & utilities sector is currently at a low risk level. The phishing campaigns are highly regionalized and concentrated, with Gazprom from Russia being the primary target. The Netherlands has emerged as a leading source of phishing emails impersonating Gazprom, likely due to its historical use as a proxy by Eastern European threat actors. The geopolitical context of the ongoing conflict in Eastern Europe adds complexity to the phishing landscape, but the overall impact remains limited due to the fragmented nature of the sector and the difficulty in monetizing these attacks.
Ransomware risk in the energy & utilities sector is also considered low, despite the industry ranking 13th in terms of the number of victims. Ransomware attacks are widely distributed across sub-sectors and geographies, with LockBit3 contributing significantly to the recent increase in activity. Although LockBit3 and other groups like Cloak have targeted this sector, there is no clear focus on energy and utilities from any single ransomware group. The geographical spread of ransomware victims highlights the broad yet sporadic nature of these attacks, with the US and Spain being notably affected.