
The CYFIRMA Industry Report delivers original cybersecurity insights and telemetry-driven statistics of global industries, covering one sector each week for a quarter. This report focuses on the energy & utilities industry, presenting key trends and statistics in an engaging infographic format.
Welcome to the CYFIRMA infographic industry report, where we delve into the external threat landscape of the energy & utilities industry over the past three months. This report provides valuable insights and data-driven statistics, delivering a concise analysis of attack campaigns, phishing telemetry, and ransomware incidents targeting energy & utilities organizations.
We aim to present an industry-specific overview in a convenient, engaging, and informative format. Leveraging our cutting-edge platform telemetry and the expertise of our analysts, we bring you actionable intelligence to stay ahead in the cybersecurity landscape.
CYFIRMA provides cyber threat intelligence and external threat landscape management platforms, DeCYFIR and DeTCT, which utilize artificial intelligence and machine learning to ingest and process relevant data, complemented by manual CTI research.
For the purpose of these reports, we leverage the following data from our platform. These are data processed by AI and ML automation based on both human research input and automated ingestions.
While this report contains statistics and graphs generated primarily by automation, it undergoes thorough review and enhancement for additional context by CYFIRMA CTI analysts to ensure the highest quality and provide valuable insights.
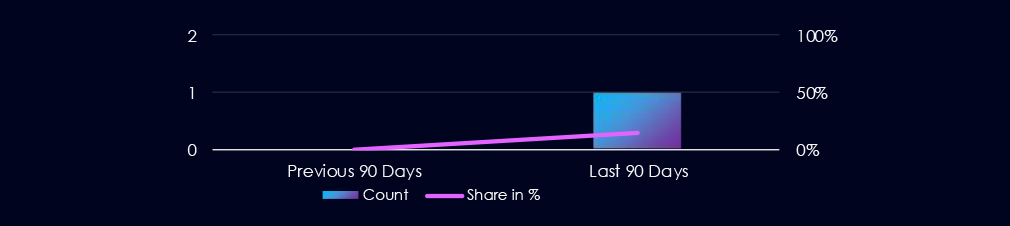
Energy & Utilities industry featured in 1 out of the 7 observed campaigns, which is a presence in 14% of all campaigns, an increase from the previous period (0 out of 5, 0%) in both volume and overall share.
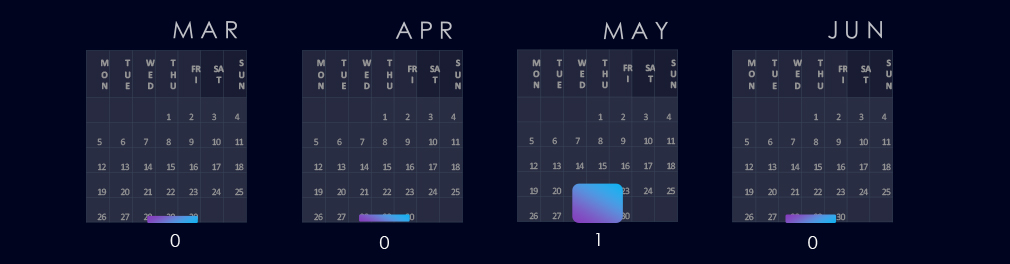
The single observed campaign with victims in this industry was observed during May.

The observed campaign was carried out by Turkish-speaking cybercriminal threat actors.
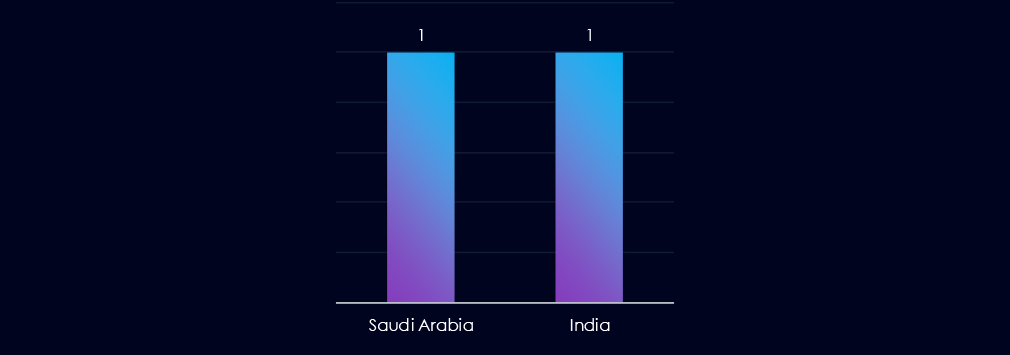
The campaign targeted the Kingdom of Saudi Arabia and India.
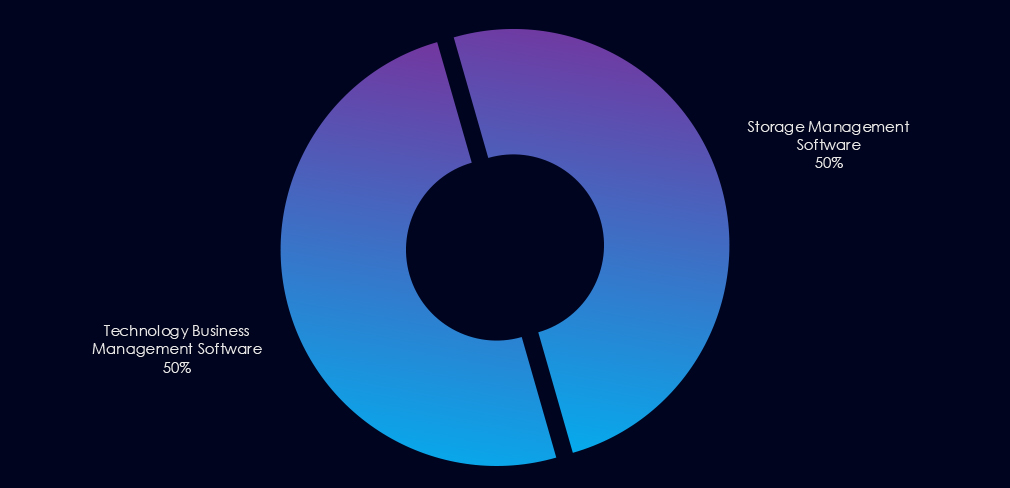
The campaign targeted storage management software and business management software.
Over the past 90 days, the energy & utilities industry has not been significantly impacted by advanced persistent threat (APT) campaigns. Only 1 out of 7 observed APT campaigns recorded victims in this industry, that is 14% presence in observed campaigns.
This figure surpasses the previous 90-day period, during which no campaigns targeted this industry.
Monthly Trends
The observed campaign was active during May.
Key Threat Actors
The campaign was carried out by Turkish-speaking cybercriminal threat actors (CCTR2501).
Geographical Impact
The campaigns affected a total of 2 countries; the Kingdom of Saudi Arabia and India, and it was highly focused on energy & utilities organizations.
Targeted Technologies
The main attack vectors were storage management software and business management software.
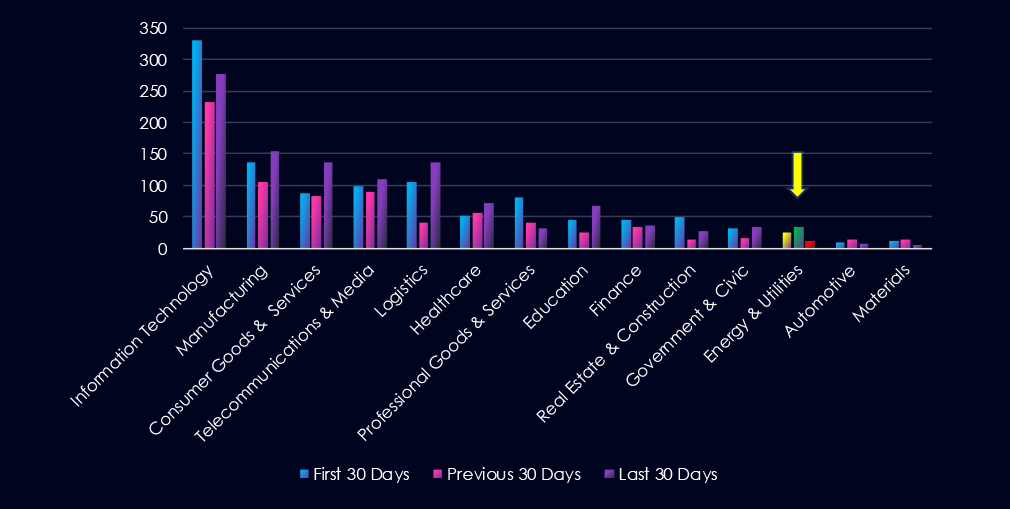
Over the past three months, CYFIRMA’s telemetry has identified 1,985 mentions of the energy & utilities industry out of a total of 59,255 industry mentions. This is from a total of 300k+ posts across various underground and dark web channels and forums.
The energy & utilities industry placed 9th out of 14 industries in the last 90 days with a share of 3.35% of all detected industry-linked chatter.
Below is a breakdown of 30-day periods of all mentions.
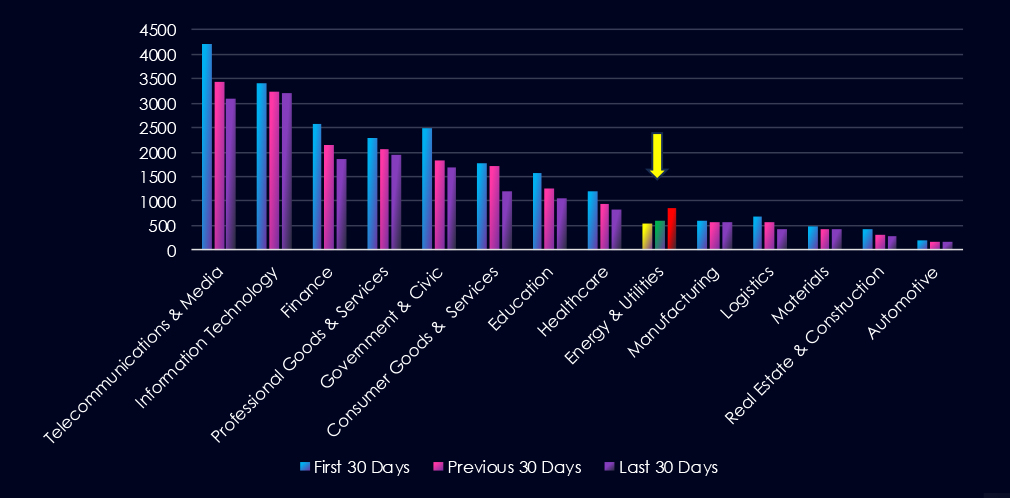
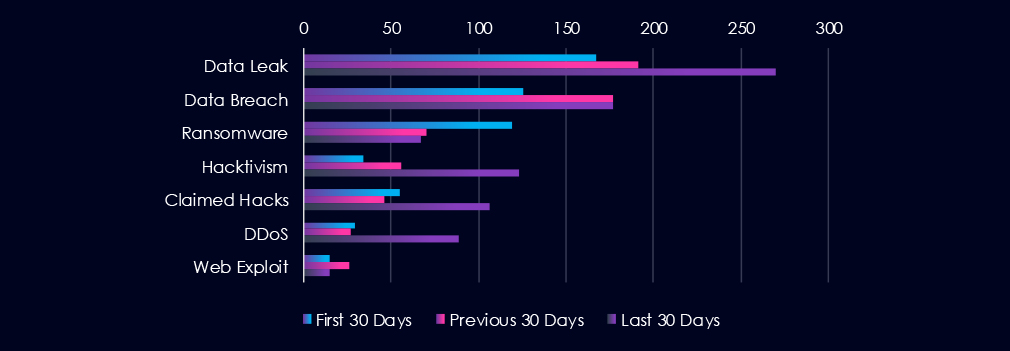
Data Breaches and Data Leaks are the most common category of recorded chatter in this industry. Hacktivism, claimed hacks and DDoS have recorded significant uptick during the last 30 days.
In total, the energy & utilities industry comprises 3.35% of all detected industry underground and dark web chatter in the last 90 days, ranking 9th out of 14 industries.
Below are observed key trends across 90 days:
Data Exposure on the Rise
Data Leak: 167 → 191 → 270 (↑62% from Jan)
Data Breach: 126 → 177 → 177 (remains high)
Ransomware Continues to Decline
119 → 70 → 67 (↓44% from start)
Once a leading threat, ransomware chatter has dropped but remains active.
Hacktivism Surging
34 → 56 → 123 (↑261%)
A dramatic rise in the recent period, suggesting politically or ideologically motivated attacks are intensifying—often tied to environmental, national, or infrastructure-related causes.
Claimed Hacks More Than Doubled
55 → 46 → 106
Indicates a wave of publicly boasted attacks or extortion attempts surfacing in dark web forums.
DDoS Attacks Tripled
29 → 27 → 89
A potential operational risk, particularly in sectors like energy where uptime is critical.
Web Exploits Fluctuating
15 → 26 → 15
Stable, but not escalating—suggests a persistent surface area for attacks, albeit not a primary focus currently.
Over the past three months, CYFIRMA’s telemetry has identified 70 mentions of the energy & utilities industry out of a total of 3,016 industry mentions. This is from over 10k CVEs reported and updated in the last 90 days.
The energy & utilities industry ranked 12th out of 14 industries in the last 90 days with a share of 2.32% of all detected industry-linked vulnerabilities.
Below is a breakdown of 30-day periods of all mentions.
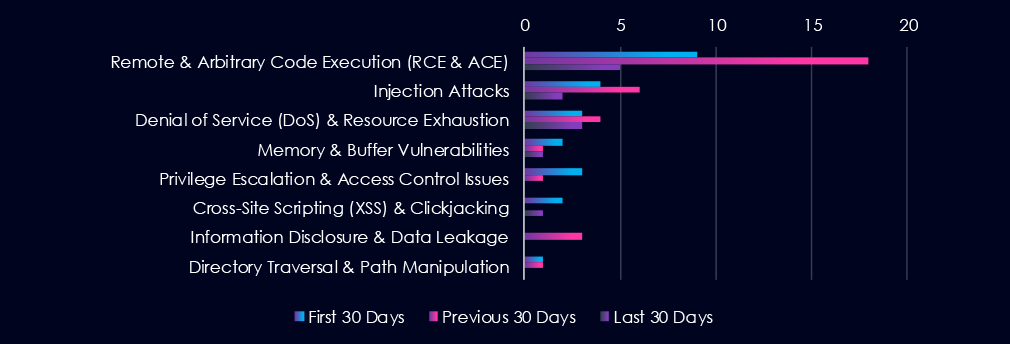
Remote & Arbitrary Code Execution (RCE & ACE) are leading the chart. Injection attacks and denial of service follow. Notable is the increase in the previous 90-day period, which has receded during the last 90 days.

In total, the energy & utilities industry comprises 2.32% of all detected industry-linked vulnerabilities in the last 90 days, and ranks 12th out of 14 industries.
Below are observed key trends across 90 days.
RCE Spike Has Receded
Remote Code Execution (RCE):
9 → 18 → 5 (↓72% from peak)
While now lower, RCE remains the most critical vulnerability class due to its potential for system-wide compromise.
Overall Decline Across Vulnerability Categories
Most CVE types show declining or flat trends, possibly reflecting effective patching or fewer public disclosures.
Injection Attacks: 4 → 6 → 2
Privilege Escalation: 3 → 1 → 0
Information Disclosure & Directory Traversal: Present only in earlier periods.
DoS Vulnerabilities Remain Steady
3 → 4 → 3
Matches the spike in DDoS chatter from underground sources—a timely warning sign for operational risk.
Minor Fluctuations in Other Threats
Memory & Buffer Issues: 2 → 1 → 1
XSS: 2 → 0 → 1
These remain low-volume but persistent and could be exploited in chained attacks.
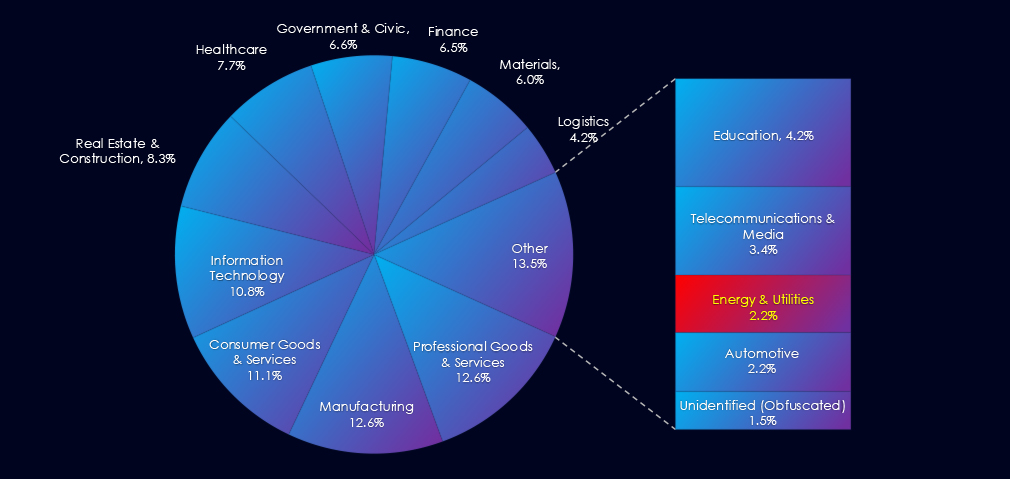
In the past 90 days, CYFIRMA has identified 36 verified ransomware victims in the energy & utilities industry. This accounts for 2.2% of the overall total of 1,605 ransomware victims during the same period, placing the energy & utilities industry 13th out of 14 industries.
Furthermore, a quarterly comparison reveals a decrease of interest in energy & utilities organizations of -18.2% from 44 to 36 victims. The overall share remained the same from 2.22% to 2.24% of all victims.
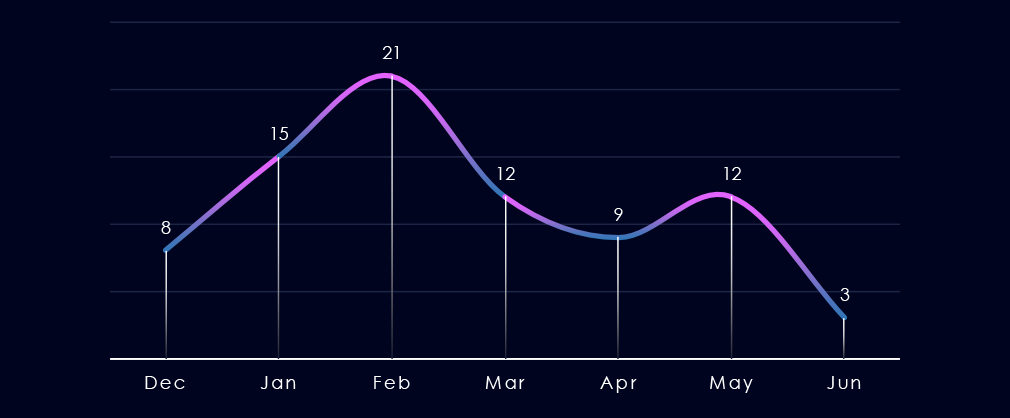
Over the past 180 days, we have observed fluctuating activity but generally mildly declining activity following the spike in February.
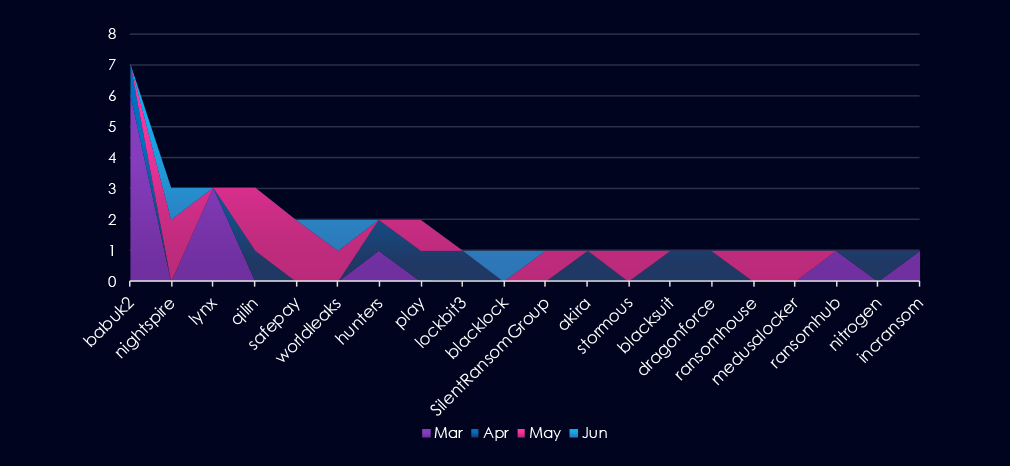
A breakdown of monthly activity per gang provides insights into which gangs were active each month. For example, the most active gang Babuk2 and Lynx, were highly active during March. On the other hand, Qilin and Safepay recorded the most victims in May.
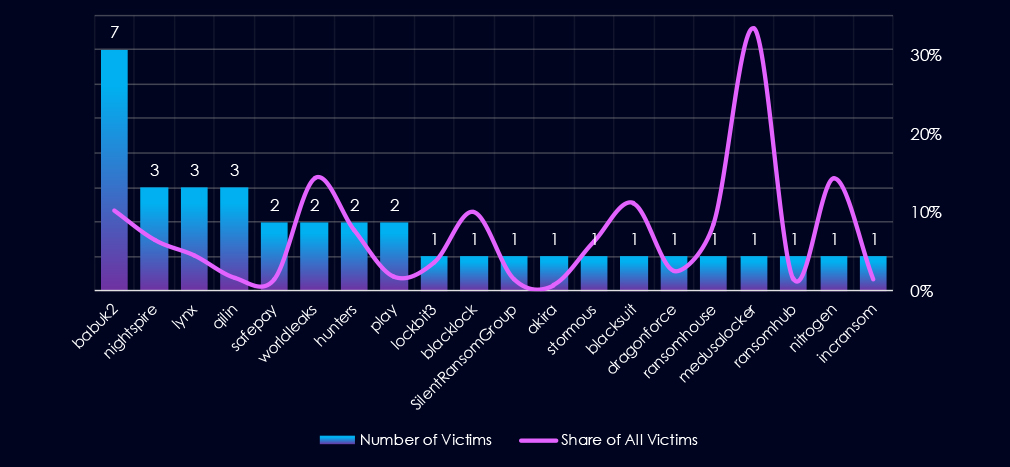
Out of the 74 gangs, 20 recorded victims in this industry in the last 90 days (27% participation). Babuk2 had the highest number of victims (7).
The share of victims for most gangs in this industry is low. Only 3 of the top 10 gangs recorded 10% or more of the victims in this industry, while 5 have below 5%.
Among the top 5 gangs, Babuk2 (10%), Worldleaks (14%), and Blacklock (10) recorded high shares in this industry, suggesting a possible focus on energy & utilities organizations.
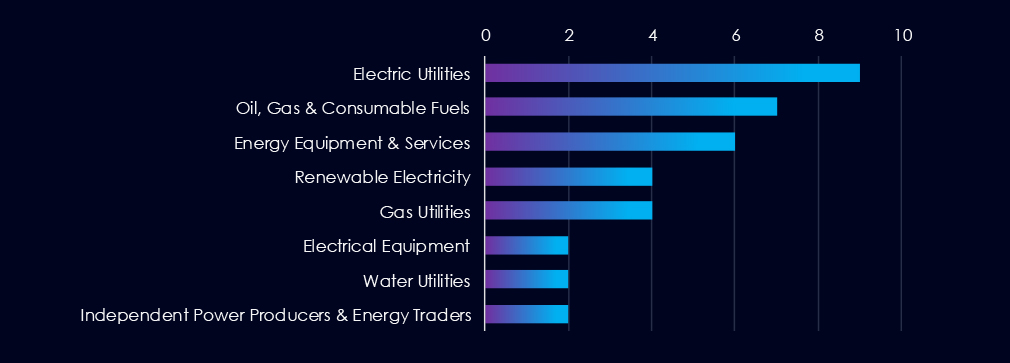
Electric utilities are the most frequent victims of ransomware in this industry. Oil, Gas & Fuels, and Energy equipment & services follow in second and third place.
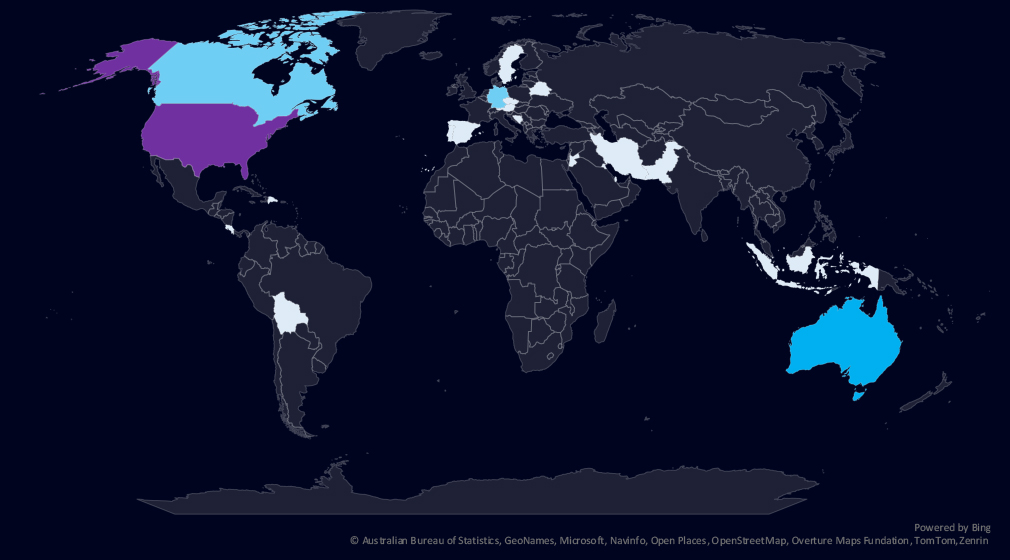
The geographic distribution heatmap underscores the widespread impact of ransomware, highlighting the countries where victims in this industry have been recorded.
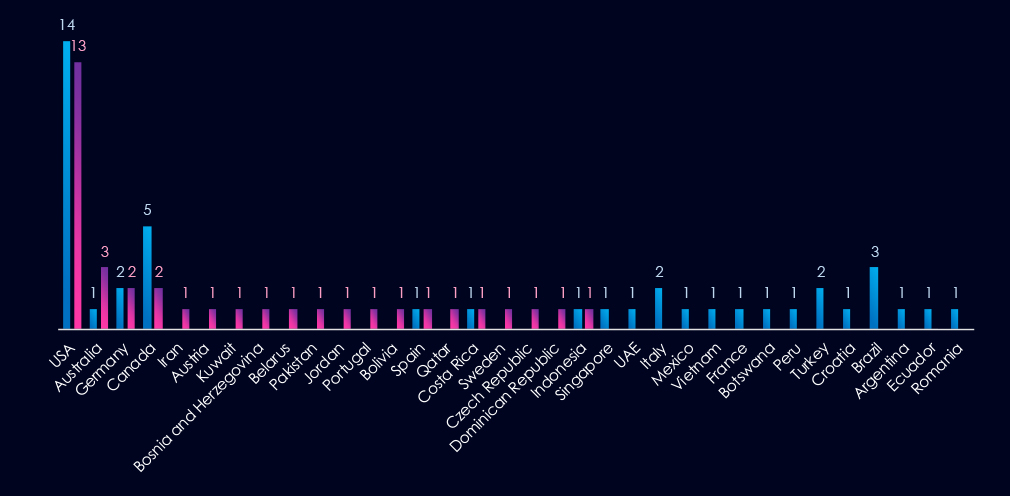
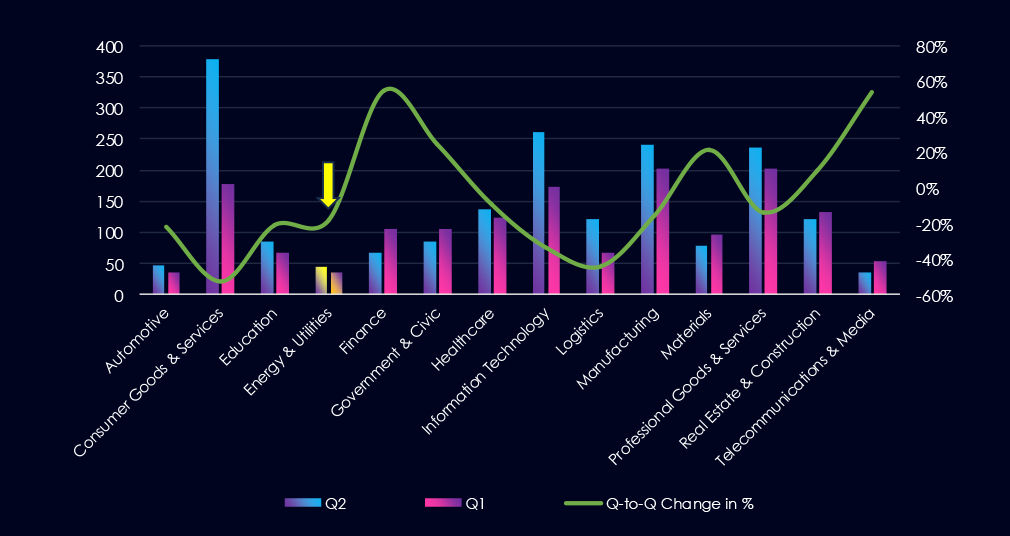
The chart shows quarter-to-quarter changes in targeted countries. Data is sorted by the last 90 days and compared to the previous 90 days marked in blue.
The USA recorded 13 victims in the last 90 days, one less than in the previous period and representing 36% of all victims. Australia, Germany, and Canada follow in the top 3. Canada recorded a major decrease from 5 to 2 victims.
The energy & utilities industry placed 13th out of 14 monitored industries, recording 36 victims in the last 90 days, a minor decrease of -18% from 44 victims in the previous 90-day period.
Overall share remained the same from 2.22% to 2.24% of all ransomware victims.
Monthly Activity Trends
The monthly activity fluctuated across the last 180 days with a spike in February.
The energy & utilities industry is not a very frequent target of ransomware most likely due to largely analog operations.
Ransomware Gangs
A total of 20 out of 74 active ransomware groups targeted this industry in the past 90 days – 27% participation:
Babuk2: The most active with 7 victims and 10% (7 out of 69) victims.
Worldleaks, Blacklock: Highest shares of 14% (2 out of 14) and 10% (1 out of 10) victims among top gangs.
Geographic Distribution
The geographic distribution of ransomware victims is relatively low but spread across the globe. The USA (13) accounts for 36% of all victims, followed by Australia (3), Germany (2), and Canada (2). Canada recorded a decrease from 5 to 2 victims between 90-day periods.
In total, 20 countries recorded ransomware victims in this industry in the last 90 days, one less than 21 in the previous period.
For a comprehensive, up-to-date global ransomware tracking report, please refer to our new monthly “Tracking Ransomware” series here.
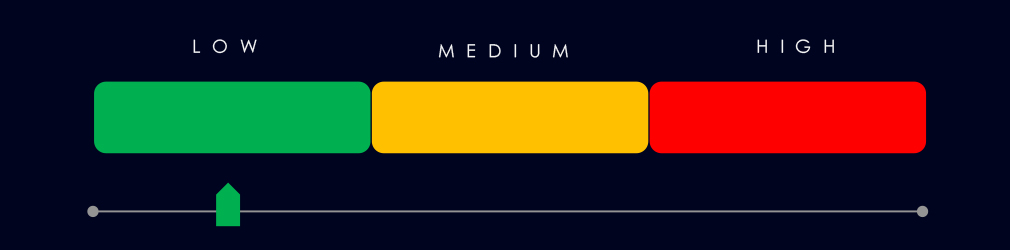
APT Campaigns (Low): Over the last 90 days, only 1 of 7 APT campaigns targeted the energy & utilities sector, marking a slight increase from the prior period when no campaigns were recorded. The sole campaign occurred in May and was attributed to Turkish-speaking cybercriminals (CCTR2501), affecting Saudi Arabia and India. Targets included storage and business management software, indicating a focused operation rather than broad sector-wide targeting.
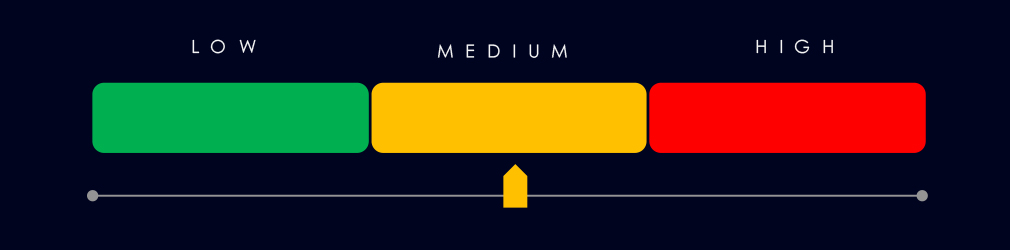
Underground & Dark Web Chatter (Moderate): The industry accounted for 3.35% of dark web chatter, ranking 9th. Data exposure is rising—data leaks surged 62% while breaches remained high. Ransomware mentions fell to 44% since January, continuing a decline, but remain notable. In contrast, hacktivism jumped 261%, suggesting increased ideologically driven targeting, potentially tied to environmental or geopolitical causes. Claimed hacks and DDoS attacks also rose sharply, increasing risks to operational continuity. Web exploit chatter remained stable, reflecting consistent but not escalating attention.
Vulnerabilities (Low): The energy & utilities sector ranked 12th in linked vulnerabilities, comprising 2.32% of total CVEs. While RCE volumes spiked in the middle period, they have since dropped sharply. Other categories like injection attacks, privilege escalation, and information disclosure also declined. DoS vulnerabilities stayed steady, aligning with rising DDoS chatter. Overall, most CVE trends suggest a reduced attack surface, possibly due to improved patching and fewer disclosures.
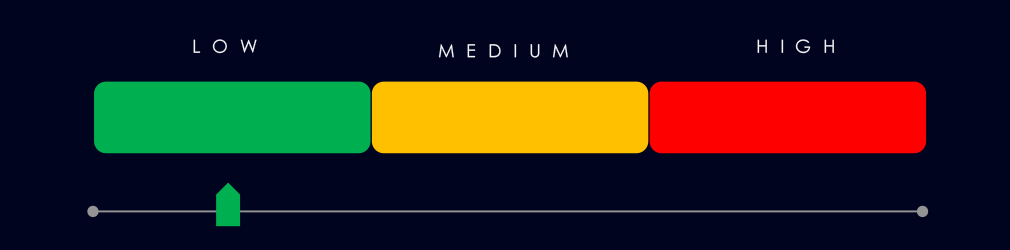
Ransomware (Low): Ranked 13th in victim count, with 36 attacks in the past 90 days (−18% from the prior period). Despite a February spike, the industry remains a relatively infrequent ransomware target—likely due to analog infrastructure and lower monetization potential. Twenty ransomware groups (27% of active crews) engaged the sector. Babuk2 was the most active (7 victims), while Worldleaks and Blacklock had the highest proportional targeting. Victims were globally distributed, with the U.S. (13) leading. The total country count dropped slightly to 20.