


The CYFIRMA Industry Report delivers original cybersecurity insights and telemetry-driven statistics of global industries, covering one sector each week for a quarter. This report focuses on the energy & utilities industry, presenting key trends and statistics in an engaging infographic format.
Welcome to the CYFIRMA infographic industry report, where we delve into the external threat landscape of the energy & utilities industry over the past three months. This report provides valuable insights and data-driven statistics, delivering a concise analysis of attack campaigns, phishing telemetry, and ransomware incidents targeting the energy & utilities industry.
We aim to present an industry-specific overview in a convenient, engaging, and informative format. Leveraging our cutting-edge platform telemetry and the expertise of our analysts, we bring you actionable intelligence to stay ahead in the cybersecurity landscape.
CYFIRMA provides cyber threat intelligence and external threat landscape management platforms, DeCYFIR and DeTCT, which utilize artificial intelligence and machine learning to ingest and process relevant data, complemented by manual CTI research.
For the purpose of these reports, we leverage the following data from our platform. These are data processed by AI and ML automation, based on both human research input and automated ingestions.
While this report contains statistics and graphs generated primarily by automation, it undergoes thorough review and enhancement for additional context by CYFIRMA CTI analysts to ensure the highest quality and provide valuable insights.
Energy & utilities organizations featured in 2 out of the 13 observed campaigns, which is a presence in 15% of all campaigns.
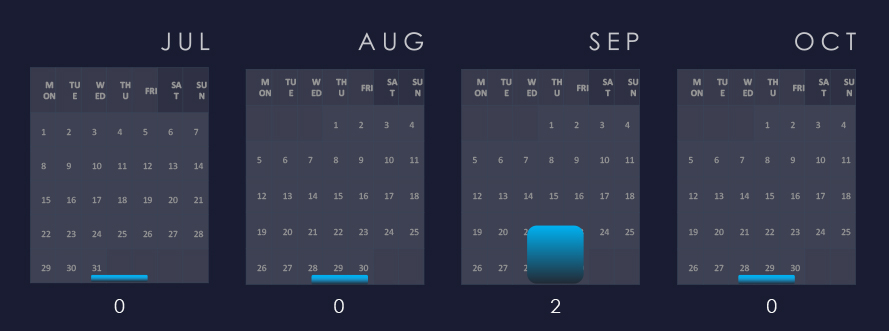
Both campaigns with recorded victims in the energy & utilities industry were observed during September.
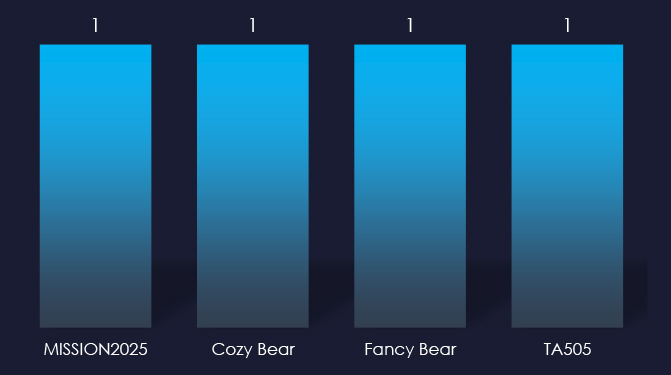
Attributed threat actor behind the campaigns are Chinese APT41 nexus of activities tracked as MISSION2025 and nation-state sponsored Russian Cozy Bear, Fancy Bear and cybercrime syndicate TA505. It is an established fact that Russian cybercrime often cooperates with Russian intelligence, and it seems like TTPs in this campaign heavily overlap.
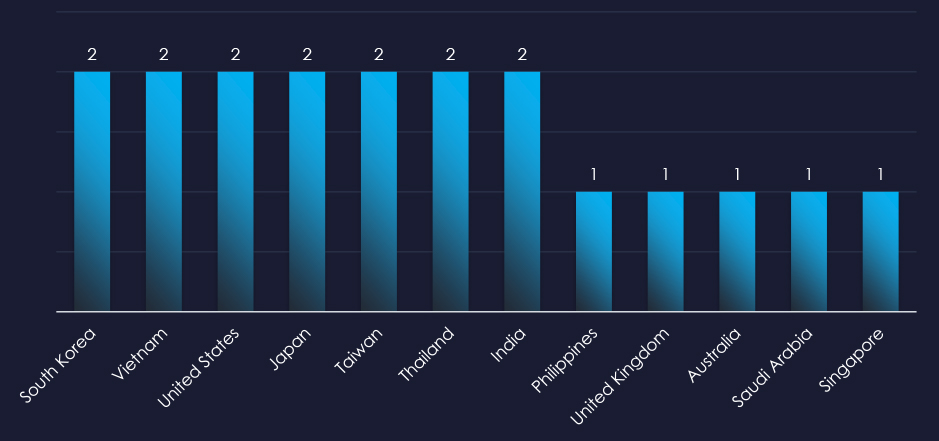
Recorded victims of observed campaigns span 12 different countries. Main focus appears to be Asia and India, but victims were recorded in Saudi Arabia and the US as well.
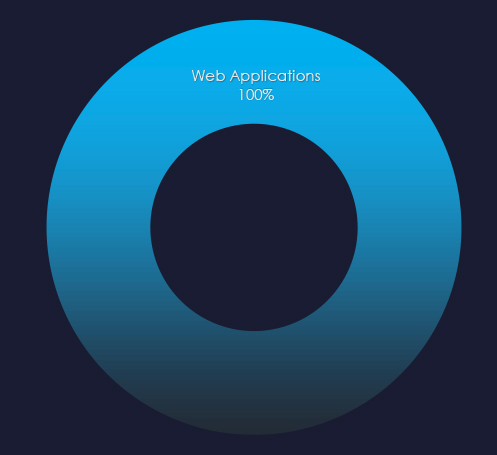
Web applications continue to be the most targeted technology across industries.

Risk Level Indicator: Low
In the past 90 days, energy & utilities organizations have not been significantly impacted by advanced persistent threat (APT) campaigns. Only 2 out of 13 observed APT campaigns recorded energy & utilities industry victims.
Monthly Trends
Two relevant campaigns were observed during September.
Key Threat Actors
Chinese APT41 nexus of activities tracked as MISSION2025, Nation-state sponsored Russian Cozy Bear, Fancy Bear, and cybercrime syndicate TA505.
It is an established fact that Russian cybercrime often cooperates with Russian intelligence, and it seems like TTPs in this campaign heavily overlap. It muddies the waters for more precise attribution to a single threat actor, but it is also possible that there was collaboration during the campaign.
Geographical Impact
The campaigns impacted 12 countries mostly from East Asia, and also Saudi Arabia, and the US.
Targeted Technologies
Web applications remain the most frequently targeted technology.
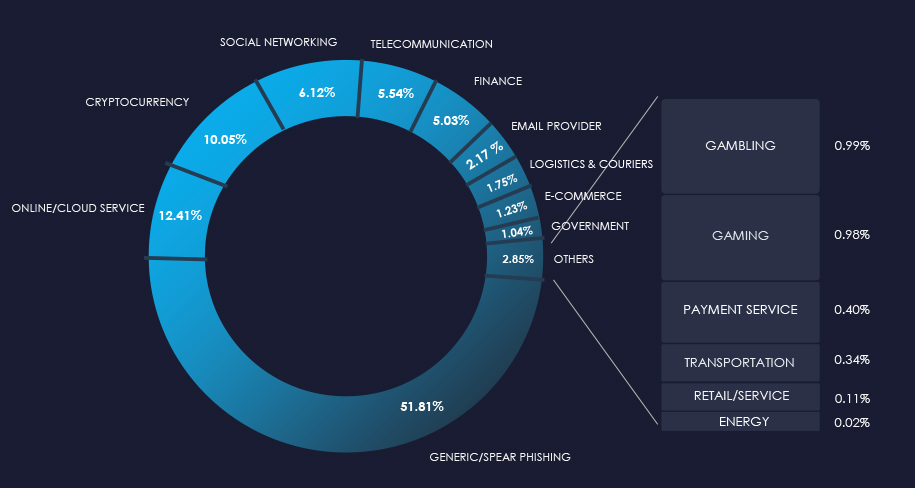
Over the past 3 months, CYFIRMA’s telemetry detected only 46 phishing campaigns themed around the energy & utilities industry out of a total of 214,721.
The chart below illustrates the global distribution of observed themes. The observed energy & utilities sector accounts for 0.02% of all captured phishing attempts.
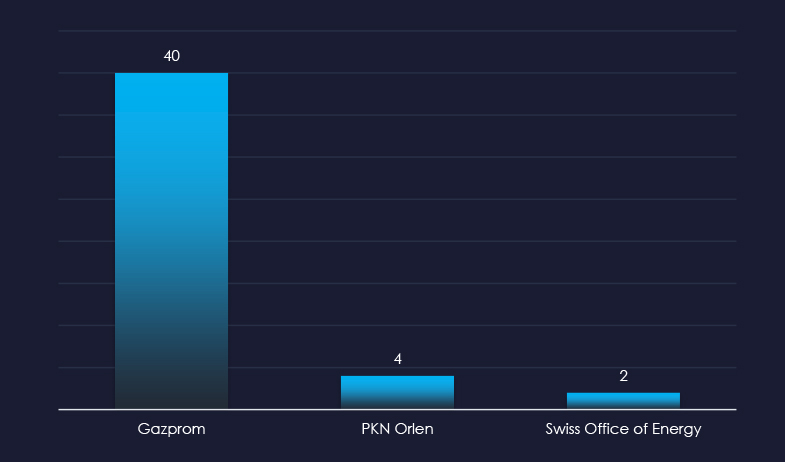
Gazprom is still the most frequently impersonated brand. However, its popularity significantly decreased from thousands in our captured samples to just 40.
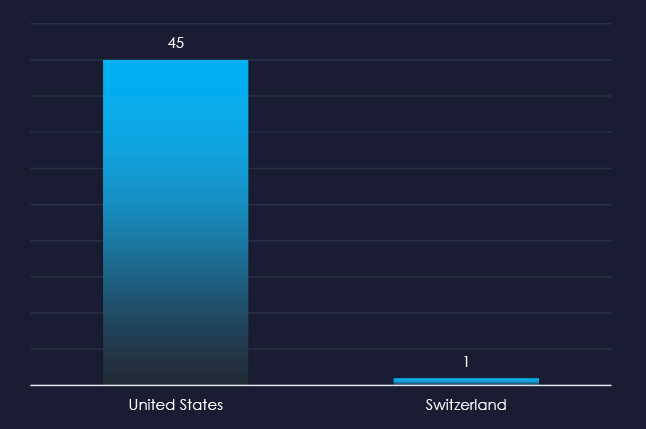
Interestingly the US is the source of all but one captured email, even though none of the brand impersonated are from US.

Risk Level Indicator: Low
The energy & utilities sector is not a popular phishing theme due to the highly fragmented nature of the industry and the lack of direct monetization avenues for threat actors. There is also no simple way to craft a campaign for a widespread “spray and pray” type of phishing campaign.
However, it is certainly used for spear-phishing to target specific persons or organizations.
Overall, Russian giant Gazprom, Polish PKN Orlen, and Swiss Office of Energy are the only impersonated brands.
ASN-origin data reveals that the United States is the source of all but one of the captured phishing emails. Given none of the brands impersonated are American, it opens the possibility of US-based threat actors targeting Europe. This is not a stretch, given many Russian cybercriminals are known to immigrate to the US.
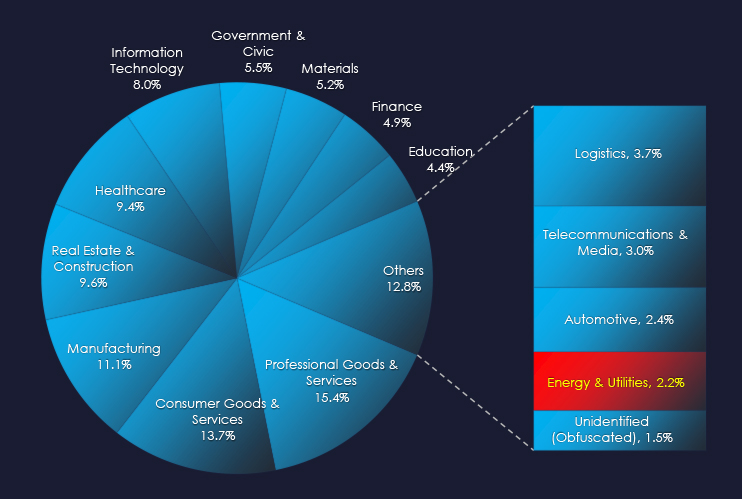
In the past 90 days, CYFIRMA has identified 31 verified ransomware victims in the energy & utilities industry. This accounts for 2.2% of the overall total of 1,420 ransomware victims during the same period, placing this industry as the least frequent victim of ransomware.
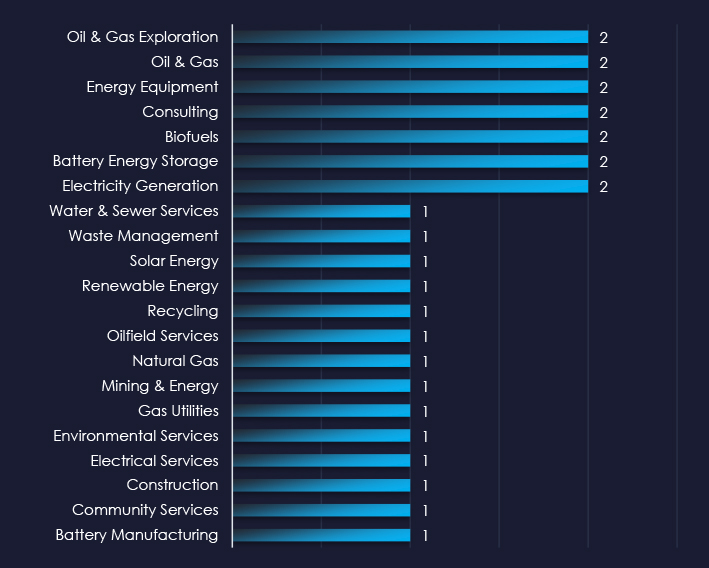
Oil & Gas and Battery sectors are among the most frequent victims of ransomware in the energy & utilities industry.
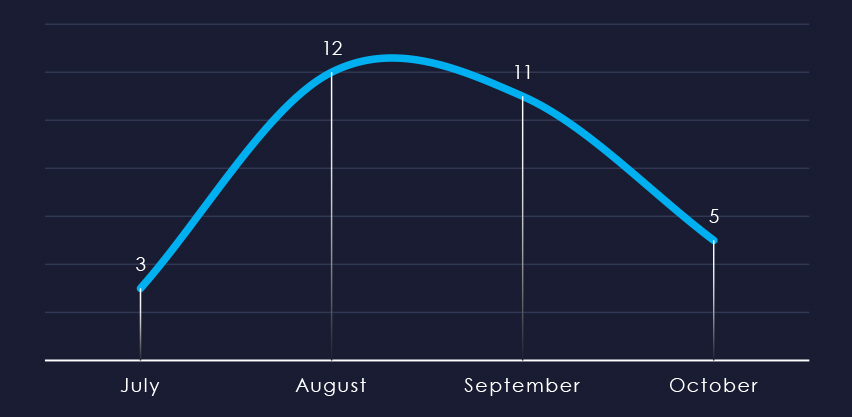
Considering the split months of July and October, we can see sustained numbers of victims with a mild spike during August.
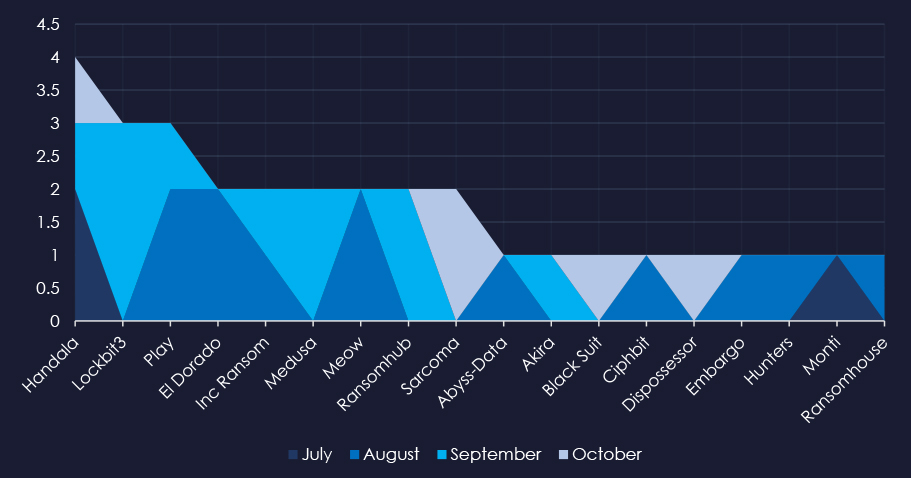
A breakdown of the monthly activity provides insights into which gangs were active each month. For example, Medusa was active in September and Play during August.
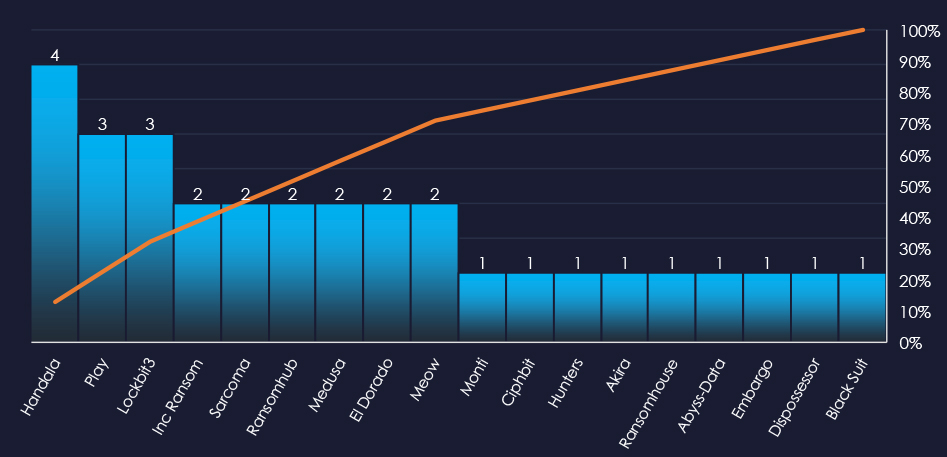
In total 18 out of 58 active groups recorded energy & utilities organizations victims in the past 90 days.
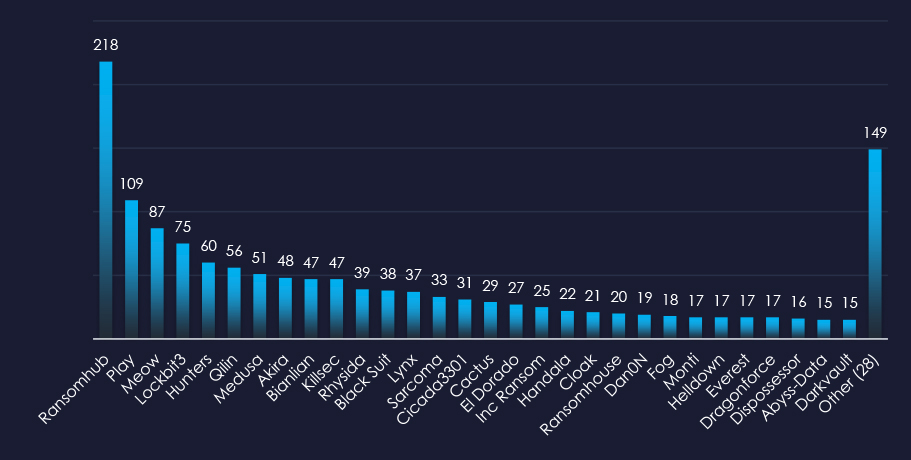
Comparing the energy & utilities industry to all recorded victims, Handala stands out with high percentage of victims in this industry recording 4 out of 22 (18%) of their victims in this industry, implying a focus.
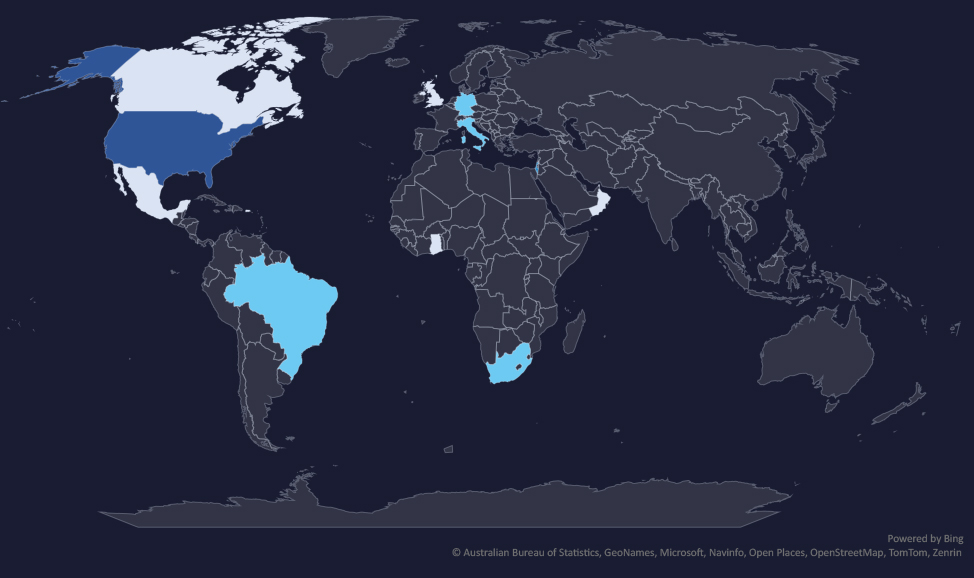
The geographic distribution heatmap underscores the widespread impact of ransomware, highlighting the countries where victims in this industry have been recorded.
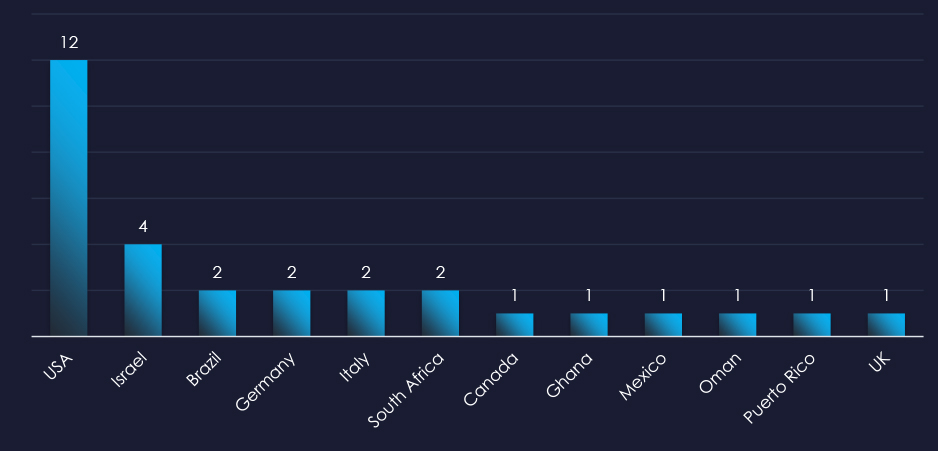
In total 12 countries recorded ransomware victims with the US alone accounting for ~41% of all victims with identified geography.

Risk Level Indicator: Low
The energy & utilities industry is placed as the least frequent victim. It faces a low, yet sustained ransomware threat, with attacks affecting a wide range of sub-sectors, however, highly focused on the US. Therefore, the US warrants a slightly higher risk factor, whereas the rest of the world is low.
Monthly Activity Trends
Ransomware activity in the energy & utilities industry recorded a mild spike during August.
The Handala group was the most active across all months. Play, El Dorado and Meow groups recorded most of their victims in August, contributing to the mild spike.
Ransomware Gangs
A total of 18 out of 58 active ransomware groups targeted the energy & utilities industry in the past 90 days:
Handala: 18% of their victims were from the energy & utilities industry (4 out of 22 victims).
Handala is not strictly a ransomware group. However, it focuses on Israel in the context of ongoing conflict and aims at critical infrastructure with the aim to disrupt it as much as possible.
Geographic Distribution
The geographic distribution of ransomware victims in the energy & utilities is seemingly randomly spread. However, it roughly corresponds with the countries known for strong energy-related sectors.
41% of all victims with identified geography are located in the US.
In total, 12 countries recorded ransomware victims in the energy & utilities industry.
For a comprehensive, up-to-date global ransomware tracking report, please refer to our new monthly “Tracking Ransomware” series here.
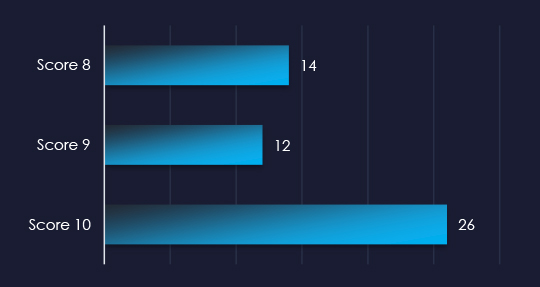
Over the past 3 months, CYFIRMA’s DECYFIR platform recorded 5,711 reported vulnerabilities with scores higher than 8. This is out of a total of 16,063 reported vulnerabilities.
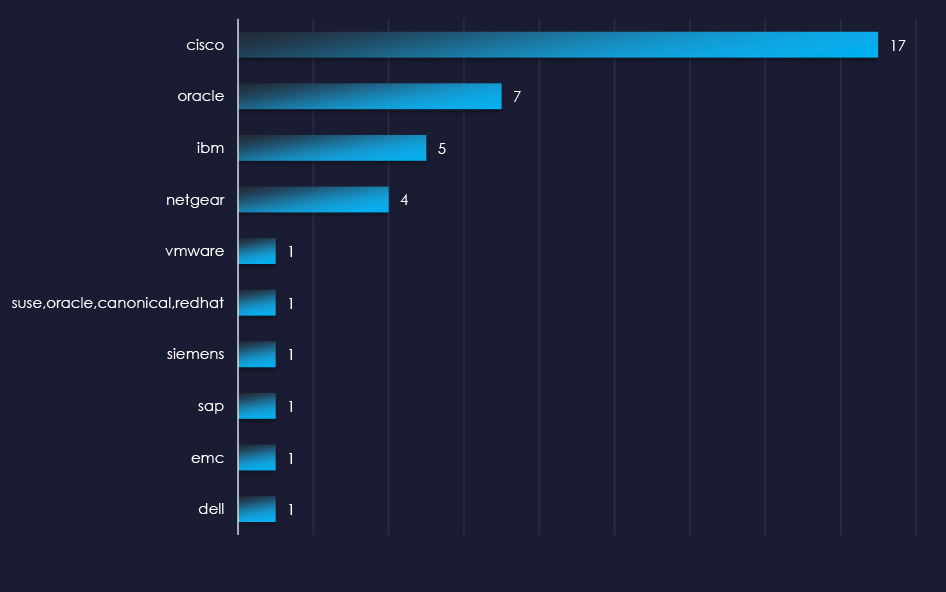
Filtered by vendors, we have observed 69 vulnerabilities related specifically to the energy & utilities industry out of which 52 are with a score of 8 or higher. 14 of the reported vulnerabilities have a known exploit.
| Title | Source Type |
| CVE-2018-2628 : Vulnerability in the Oracle WebLogic Server component of Oracle Fusion Middleware (subcomponent: WLS Core Components). Suppo | https://nvd.nist.gov/vuln/detail/CVE-2018-2628 |
| CVE-2019-3010 : Vulnerability in the Oracle Solaris product of Oracle Systems (component: XScreenSaver). The supported version that is affec | https://nvd.nist.gov/vuln/detail/CVE-2019-3010 |
| CVE-2020-2555 : Vulnerability in the Oracle Coherence product of Oracle Fusion Middleware (component: CachingCacheStoreInvocation). Suppor | https://nvd.nist.gov/vuln/detail/CVE-2020-2555 |
| CVE-2020-14871 : Vulnerability in the Oracle Solaris product of Oracle Systems (component: Pluggable authentication module). Supported versi | https://nvd.nist.gov/vuln/detail/CVE-2020-14871 |
| CVE-2002-2379 : Cisco AS5350 IOS 12.2(11)T with access control lists (ACLs) applied and possibly with ssh running allows remote attackers to | https://nvd.nist.gov/vuln/detail/CVE-2002-2379 |
| CVE-2004-1621 : NOTE: this issue has been disputed by the vendor. Cross-site scripting (XSS) vulnerability in IBM Lotus Notes R6 and Domino | https://nvd.nist.gov/vuln/detail/CVE-2004-1621 |
| CVE-2013-7030 : The TFTP service in Cisco Unified Communications Manager (aka CUCM or Unified CM) allows remote attackers to obtain sensitiv | https://nvd.nist.gov/vuln/detail/CVE-2013-7030 |
| CVE-2015-7450 : Serialized-object interfaces in certain IBM analytics business solutions cognitive IT infrastructure and mobile and soci | https://nvd.nist.gov/vuln/detail/CVE-2015-7450 |
| CVE-2017-10271 : Vulnerability in the Oracle WebLogic Server component of Oracle Fusion Middleware (subcomponent: WLS Security). Supported v | https://nvd.nist.gov/vuln/detail/CVE-2017-10271 |
| CVE-2017-6736 : The Simple Network Management Protocol (SNMP) subsystem of Cisco IOS 12.0 through 12.4 and 15.0 through 15.6 and IOS XE 2.2 | https://nvd.nist.gov/vuln/detail/CVE-2017-6736 |
| CVE-2016-10174 : The NETGEAR WNR2000v5 router contains a buffer overflow in the hidden_lang_avi parameter when invoking the URL /apply.cgi?/ | https://nvd.nist.gov/vuln/detail/CVE-2016-10174 |
| CVE-2017-6334 : dnslookup.cgi on NETGEAR DGN2200 devices with firmware through 10.0.0.50 allows remote authenticated users to execute arbitr | https://nvd.nist.gov/vuln/detail/CVE-2017-6334 |
| CVE-2017-6077 : ping.cgi on NETGEAR DGN2200 devices with firmware through 10.0.0.50 allows remote authenticated users to execute arbitrary O | https://nvd.nist.gov/vuln/detail/CVE-2017-6077 |
| CVE-2016-6277 : NETGEAR R6250 before 1.0.4.6.Beta R6400 before 1.0.1.18.Beta R6700 before 1.0.1.14.Beta R6900 R7000 before 1.0.7.6.Beta | https://nvd.nist.gov/vuln/detail/CVE-2016-6277 |
In the past 90 days, energy and utilities organizations have faced moderate to high risk across monitored categories.
APT campaigns: Only 2 of 13 observed campaigns affected the energy and utilities sector in September, involving Chinese APT41 (MISSION2025) and Russian groups Cozy Bear, Fancy Bear, and TA505. The campaigns targeted web applications in 12 countries, mostly in East Asia, as well as Saudi Arabia and the U.S.
Phishing: The sector is rarely targeted due to fragmentation and lack of direct monetization. Only three brands were impersonated: Russian Gazprom, Polish PKN Orlen, and the Swiss Office of Energy. Phishing attacks primarily originated from the U.S., suggesting possible U.S.-based threat actors targeting European entities.
Ransomware: The energy and utilities industry is the least frequent victim yet faces a sustained threat, with a mild spike in August due to activity from Handala, Play, El Dorado, and Meow groups. Out of 58 active ransomware groups, 18 targeted the sector, with 41% of victims located in the U.S., and attacks recorded in 12 countries overall.
Vulnerabilities: Of 16,063 total vulnerabilities reported, 5,711 were high-severity. Specifically, 69 related to the energy and utilities sector (52 scored 8 or higher), with 14 known exploits requiring immediate attention.