
The CYFIRMA Industry Report delivers original cybersecurity insights and telemetry-driven statistics of global industries, covering one sector each week for a quarter. This report focuses on the consumer goods & services industry, presenting key trends and statistics in an engaging infographic format.
Welcome to the CYFIRMA infographic industry report, where we delve into the external threat landscape of the consumer goods & services industry over the past three months. This report provides valuable insights and data-driven statistics, delivering a concise analysis of attack campaigns, phishing telemetry, and ransomware incidents targeting the consumer goods & services organizations.
We aim to present an industry-specific overview in a convenient, engaging, and informative format. Leveraging our cutting-edge platform telemetry and the expertise of our analysts, we bring you actionable intelligence to stay ahead in the cybersecurity landscape.
CYFIRMA provides cyber threat intelligence and external threat landscape management platforms, DeCYFIR and DeTCT, which utilize artificial intelligence and machine learning to ingest and process relevant data, complemented by manual CTI research.
For the purpose of these reports, we leverage the following data from our platform. These are data processed by AI and ML automation based on both human research input and automated ingestions.
While this report contains statistics and graphs generated primarily by automation, it undergoes thorough review and enhancement for additional context by CYFIRMA CTI analysts to ensure the highest quality and provide valuable insights.
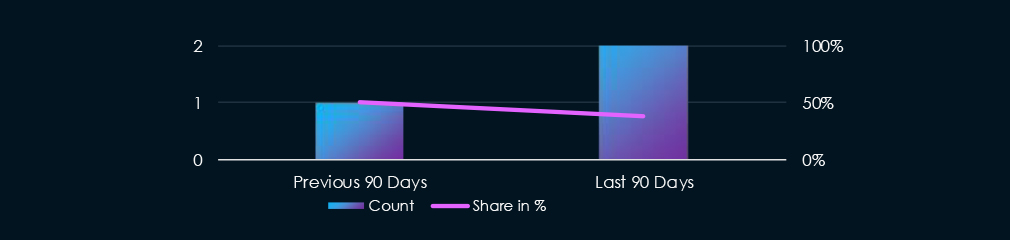
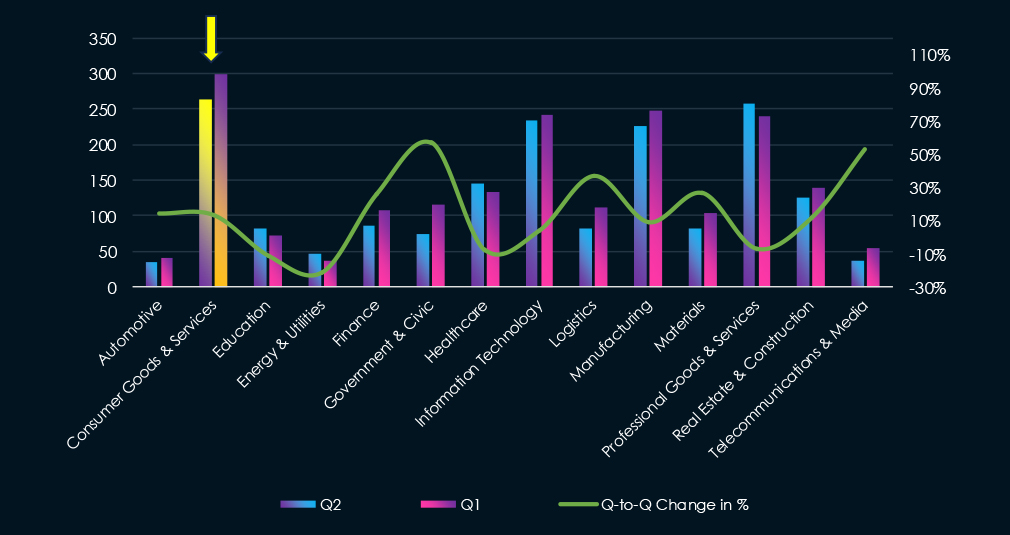
Consumer goods & services industry featured in 3 of the 8 observed campaigns, which is a presence in 38% of all campaigns, more than in the previous period (1 out of 2, 50%), however, a lower presence.

Observed campaigns were distributed across months of last 90-day period.

Somewhat unusually, we observed no typical Chinese or Russian threat actors in consumer goods & services APT campaigns in the last 90 days. Observed campaigns are by Pakistani, Algerian, and Thai groups.
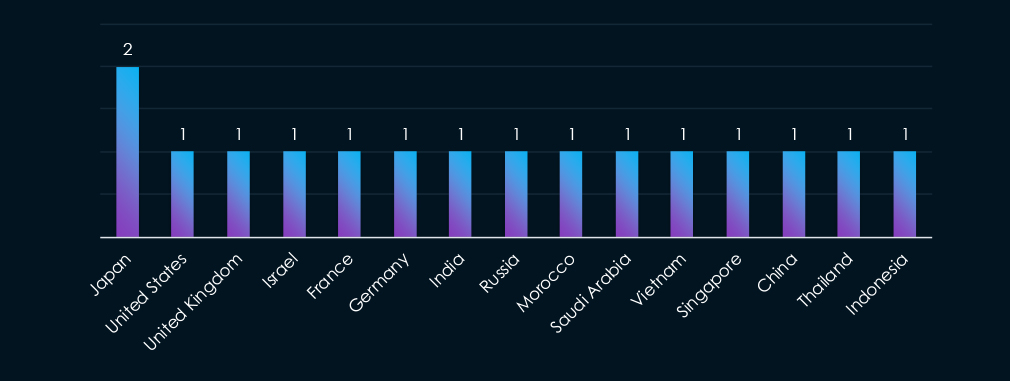
Only Japan featured in 2 out of 3 campaigns. Rest of the countries were in only one campaign each. This underlines the diverse origin of threat actors, each with very different objectives and targets.
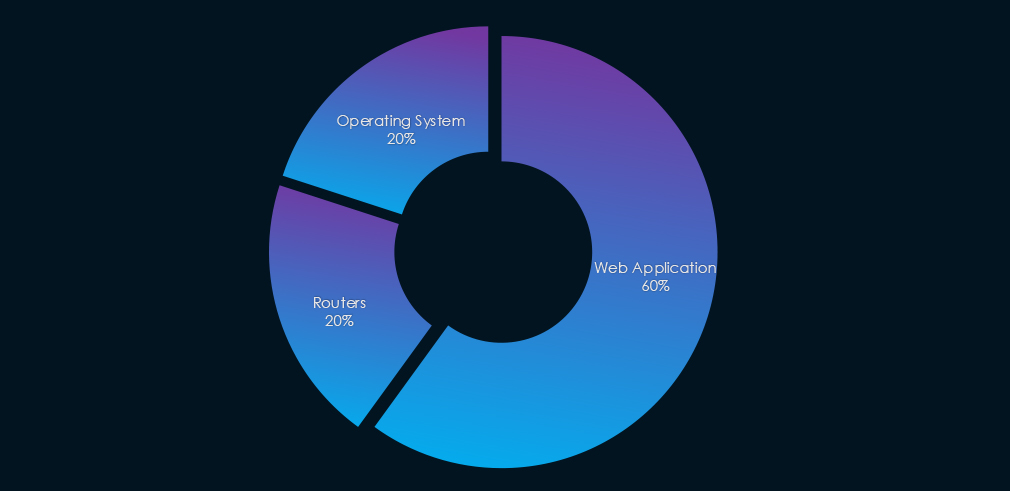
All three observed campaigns targeted web applications, one also targeted operating systems, and other routers.

In the past 90 days, consumer goods & services industry has been moderately affected by advanced persistent threat (APT) campaigns. 3 out of 8 observed APT campaigns targeted this industry, representing a 38% presence.
This is more than the previous 90-day period, when 1 out of 2 campaigns targeted this industry, however, a decline from the overall share of 50%.
Monthly Trends
The observed campaigns occurred across months of the last 90-day period, suggesting sustained interest.
Key Threat Actors
The campaigns did not feature the usual Chinese or Russian threat actors, instead, we have observed Pakistani, Algerian, and Thai groups behind the observed campaigns.
Geographical Impact
The campaigns have affected a total of 15 countries. Only Japan recorded victims in 2 campaigns, all other countries recorded victims in only one campaign. This is in line with diverse threat actors, each with very different objectives and targets.
Targeted Technologies
Web applications were targeted in all 3 campaigns, and then operating systems and routers were attacked in one campaign each.
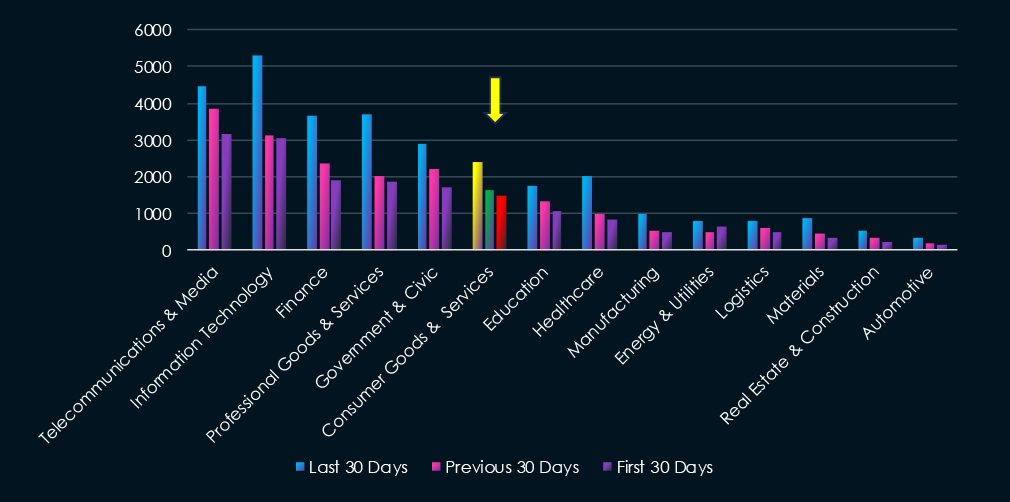
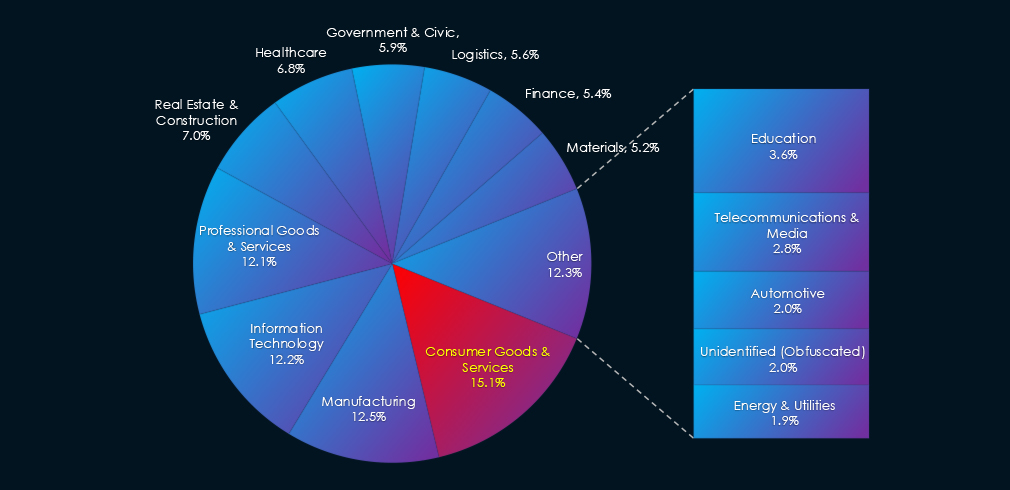
Over the past three months, CYFIRMA’s telemetry has identified 5,540 mentions of the consumer goods & services industry out of a total of 67,952 industry mentions. This is from a total of 317,791 posts across various underground and dark web channels and forums.
Consumer goods & services industry placed 6th out of 14 industries in the last 90 days with a share of 8.15% of all detected industry-linked chatter.
Below is a breakdown by 30-day periods of all mentions.
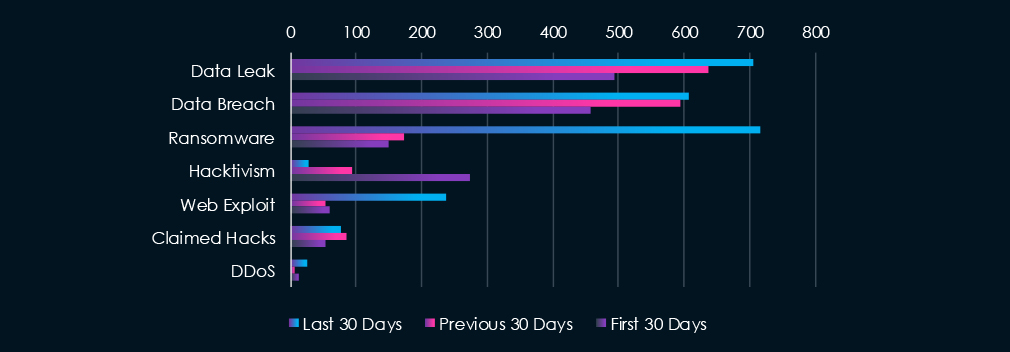
Data Leaks and Data Breaches are the most common category of recorded chatter for this industry. Ransomware chatter and claimed hacks were high in the first 30 days and declined sharply during the last 60 days. On the contrary, hacktivism increased in the last 30 days.

In total, the consumer goods & services industry comprise of 8.14% of all detected industry underground and dark web chatter in the last 90 days, ranking 4th out of 14 industries.
Below are observed key trends across 90 days:
Massive Surge in Ransomware Activity
150 → 174 → 717 (↑378% from previous period)
Indicates a sharp escalation in ransomware targeting, likely driven by profit potential in this high-volume industry.
Steady Growth in Data Compromise
Data Leak: 493 → 637 → 706
Data Breach: 457 → 594 → 608
Consistent rise in both suggests ongoing issues with data exposure, potentially through poor security practices or third-party leaks.
Web Exploits Skyrocketed
60 → 53 → 237 (↑347% from previous)
Suggests attackers are actively exploiting vulnerabilities in web-facing infrastructure, possibly e-commerce platforms or customer portals.
Hacktivism in Sharp Decline
274 → 93 → 27 (↓90% since start)
Indicates a shift from ideologically driven attacks to financially motivated threats like ransomware and data theft.
Claimed Hacks & DDoS Increasing Again
Claimed Hacks: 54 → 85 → 76 → Still elevated above the first period
DDoS: 13 → 7 → 25 (↑257%)
Suggests growing public declarations of breaches and DDoS on underground forums—often used to extort or sell stolen data.
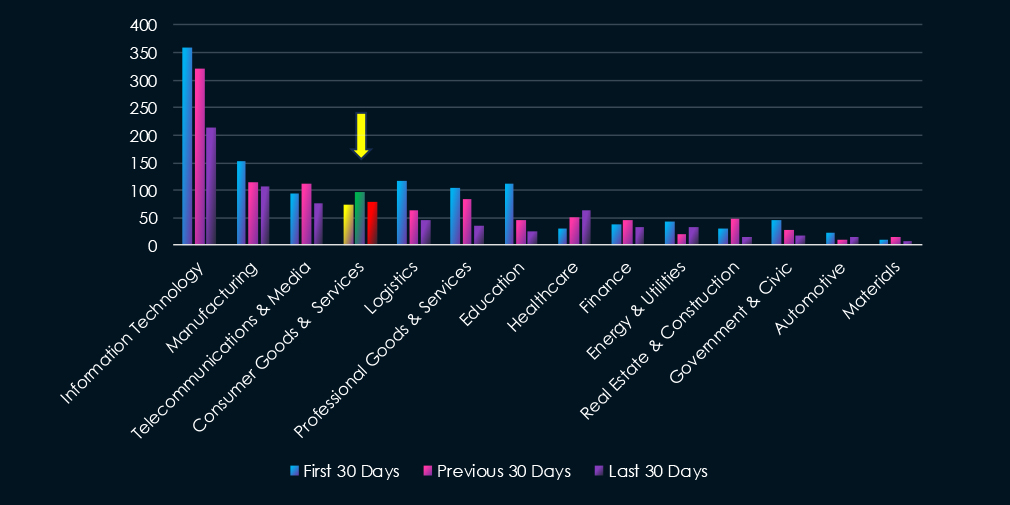
Over the past three months, CYFIRMA’s telemetry has identified 249 mentions of consumer goods & services industry out of a total of 3,059 industry mentions. This is from total of 10,982 CVE published in 90 days.
Consumer goods & services industry ranked 4th out of 14 industries in the last 90 days with a share of 8.14% of all detected industry-linked vulnerabilities.
Below is a breakdown by 30-day periods of all mentions.
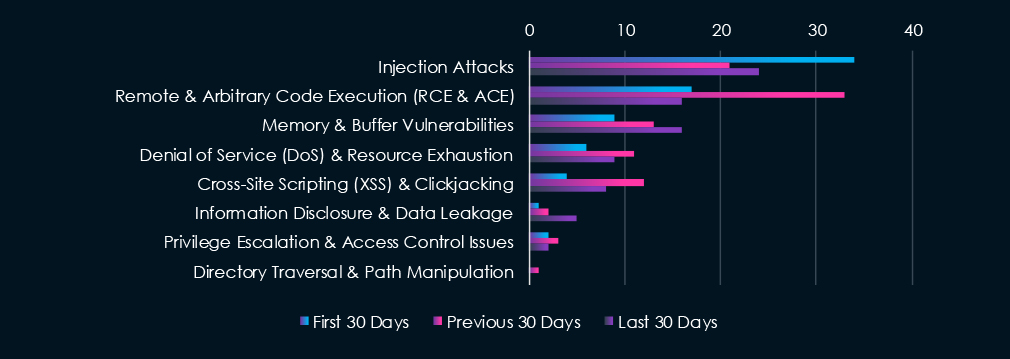
Injection attacks and Remote & Arbitrary Code Execution (RCE, ACE) are leading the chart. Memory & buffer vulnerabilities are in third place. DoS & resource exhaustion with Cross-Site Scripting (XSS) & Clickjacking are close in fourth and fifth place, respectively.

In total, the consumer goods & services comprise 8.14% of all detected industry-linked vulnerabilities in the last 90 days, ranking 4th out of 14 industries.
Below are observed key trends across 90 days.
Injection Attacks Remain the Top Threat
34 → 21 → 24
Still the most reported CVE type—a consistent and serious risk, particularly in web applications like e-commerce and customer portals.
RCE Volatility
17 → 33 → 16
Spiked in the middle period, then dropped back—still a critical issue due to its exploit potential.
Memory & Buffer Vulnerabilities Rising
9 → 13 → 16 (↑78% since first period)
Indicates increased risk of application instability or system-level attacks, often tied to outdated software or low-level bugs.
Moderate Web Vulnerabilities
XSS & Clickjacking: 4 → 12 → 8
Directory Traversal: Only 1 mention total → minimal but not absent
Suggests ongoing risk in front-end systems.
DoS and Info Disclosure Consistent
DoS: 6 → 11 → 9
Information Disclosure: 1 → 2 → 5 (increasing)
Privilege Escalation Remains Low
2 → 3 → 2 → A minor but persistent vector that shouldn’t be ignored.
In the past 90 days, CYFIRMA has identified 299 verified ransomware victims in the consumer goods & services industry. This accounts for 15.1% of the overall total of 19,81 ransomware victims during the same period, placing the consumer goods & services industry 1st out of 14 industries.
Furthermore, a quarterly comparison reveals an increase of interest in the consumer goods & services industry of 13.3% from 264 to 299 victims. The overall share increased from 14.6% to 15.1% of all victims.
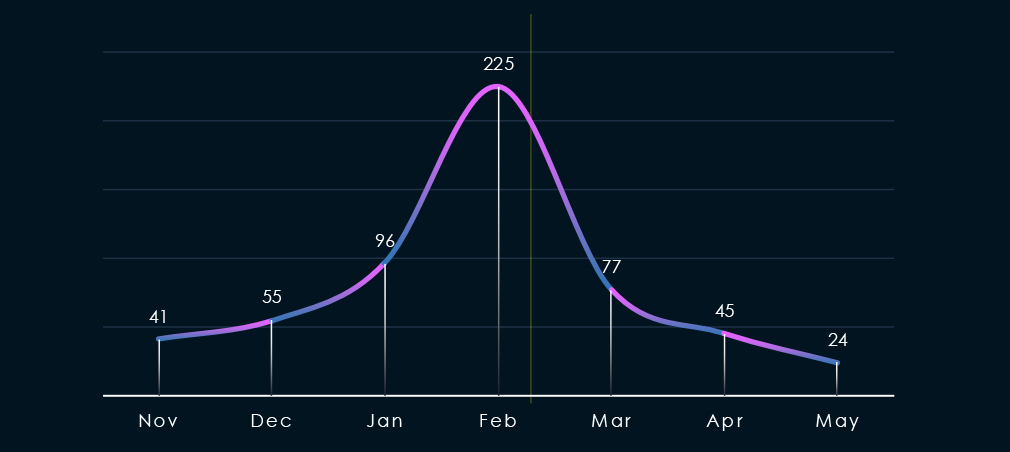
Over the past 180 days, we have observed sustained activity across months with a massive spike during and around February. This was driven by the Cl0p ransomware rampage.
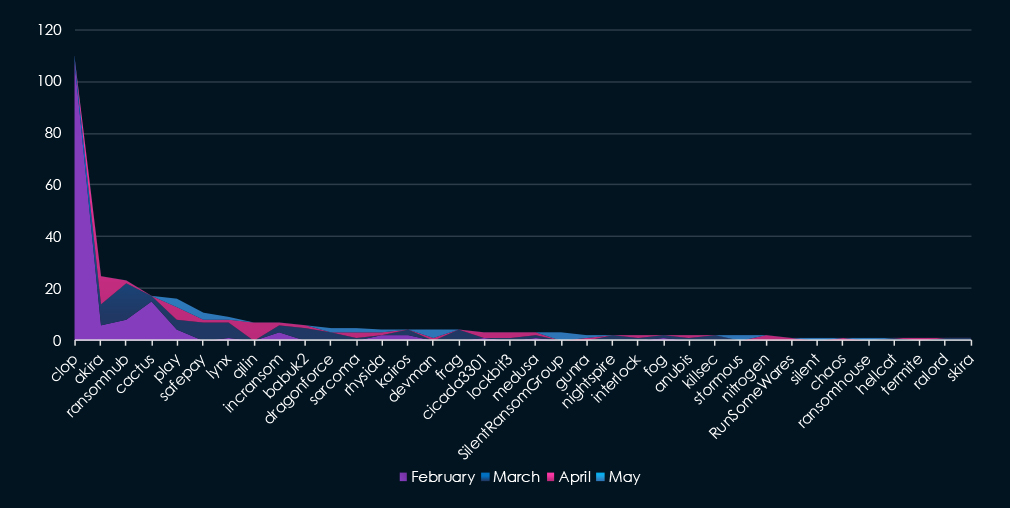
A breakdown of monthly activity per top 30 gangs provides insights into which gangs were active each month. For example, the most active gang, Cl0p was behind the sharp spike during February. Whereas, RansomHub and Akira were active across months. Furthermore, Qilin only recorded victims in April.
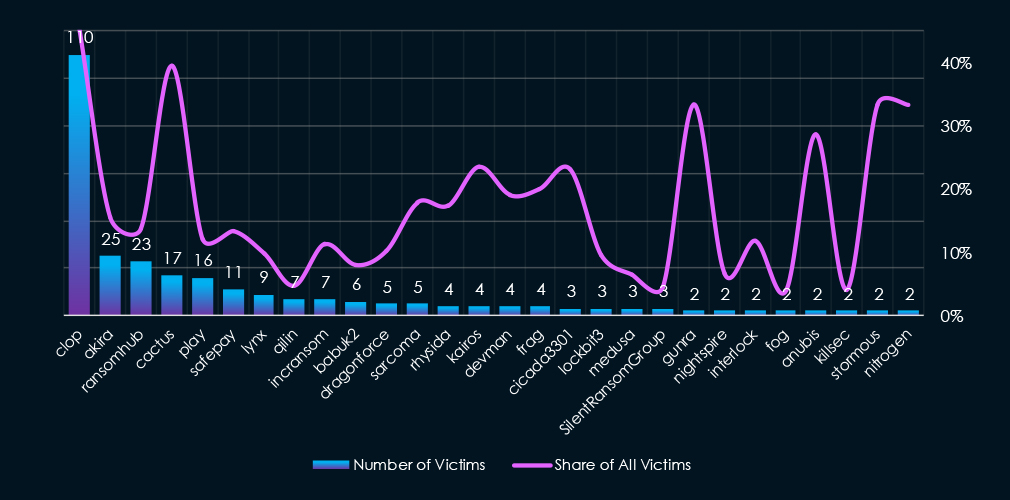
Out of the 74 gangs, 42 recorded victims in this sector in the last 90 days (58% participation). Cl0p gang had the highest number of victims (110), followed by Akira (25) and RansomHub (23).
The share of victims for many gangs in this industry is relatively high. Eight out of the top 10 gangs recorded 10% or more of the victims in this industry.
Among the top 5 gangs, Clop (46%), Akira (16%) and Cactus (40%) recorded high shares in this industry, suggesting focus on consumer goods & services businesses. Particularly, the Cl0p rampage disproportionately hit this industry.
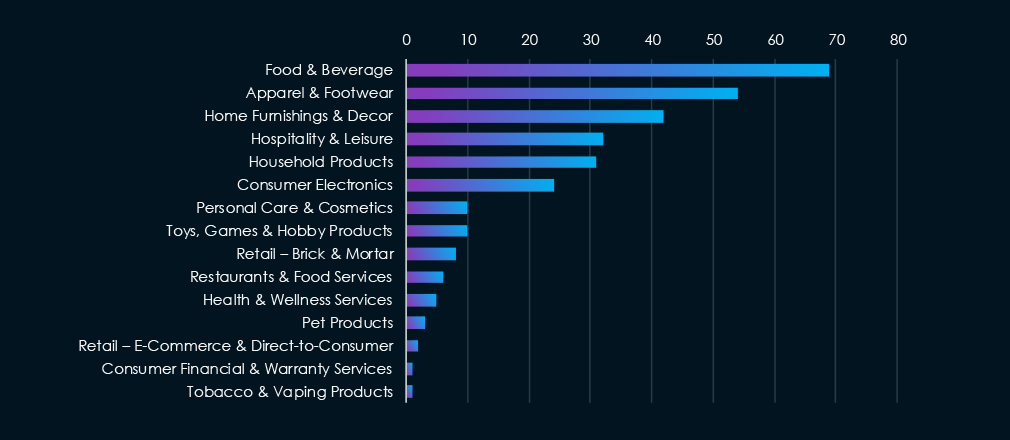
Food & beverage, apparel & footwear and home furnishing & decor are the most frequent victims of ransomware in this industry in past 90 days.
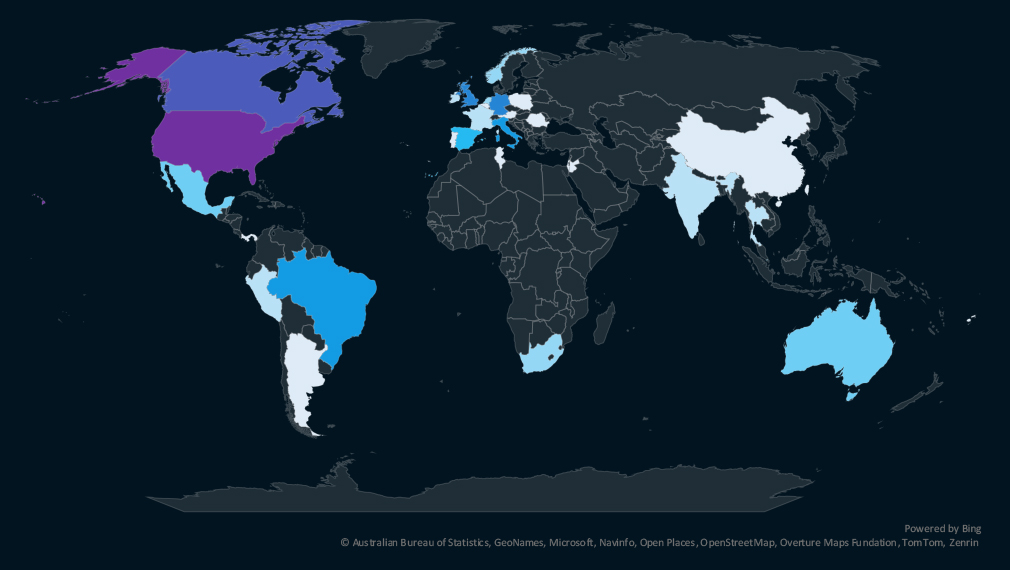
The geographic distribution heatmap underscores the widespread impact of ransomware, highlighting the countries where victims in this industry have been recorded.
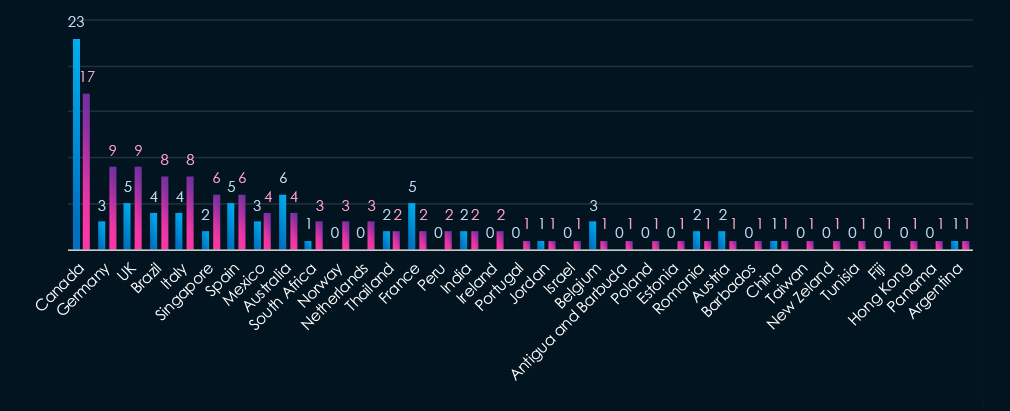
The chart shows quarter-to-quarter changes in targeted countries. Data is sorted by the last 90 days and compared to the previous 90 days, marked in blue. The USA is omitted from the chart as it skews the scale drastically.
The USA recorded 188 victims in the last 90 days, an increase from 154, and represents 64% of all victims. Germany, the UK, Brazil, and Italy follow in the top. Notably, Singapore also ranked high. Many countries recorded no victims in the previous 90 days, illustrating the expanded reach of Clop rampage.

Consumer goods & services placed 1st out of 14 monitored industries, recording 296 victims in the last 90 days, an increase of 13.3% from 262 victims in the previous 90-day period.
The overall share increased from 14.6% to 15.1% of all ransomware victims.
Monthly Activity Trends
Monthly activity was steady and sustained across the last 180 days, with a massive spike in February nearly quintupling the monthly average.
Cl0p ransomware rampage behind the February spike disproportionately hit this industry, with 46% of all their victims in the consumer goods & services sector.
Ransomware Gangs
A total of 42 out of 77 active ransomware groups targeted this industry in the past 90 days – 58% participation:
Clop: The most active with 110 victims and 46% (110 out of 242) victims.
Cactus: Second highest share of 40% (17 out of 43) victims. Suggest high interest in consumer goods & services businesses.
Akira, Ransomhub: Two most active gangs in 2025 so far. Also recorded a high share of their victims (15.5%, 13.8%) in this industry, further contributing to pushing it as the most frequent victim of ransomware.
Geographic Distribution
The geographic distribution of ransomware victims is relatively low given number of victims. The USA (188) accounting for 64% of all victims. Followed by Germany (9), the UK (9), Brazil (8), Italy (8) and Singapore (6).
In total, 36 countries recorded ransomware victims in this industry in the last 90 days, a decline from 42 in the previous period.
For a comprehensive, up-to-date global ransomware tracking report, please refer to our new monthly “Tracking Ransomware” series here.
APT Campaigns (Moderate): Consumer goods & services organizations were impacted by 3 of 8 observed APT campaigns (38%) over the last 90 days, a moderate risk level. This marks an increase in campaign count but a decline in proportional targeting from the previous period. All campaigns were spread across the quarter, indicating sustained attacker interest. Notably, these campaigns were not attributed to Chinese or Russian groups, but rather to actors from Pakistan, Algeria, and Thailand. A total of 15 countries were affected, with Japan the only repeat target. Web applications were targeted in all cases, with some attacks also hitting operating systems and routers.
Underground & Dark Web Chatter (Moderate): The industry accounted for 8.1% of underground and dark web chatter—4th among all industries. Ransomware mentions surged 378% in the last 30 days, indicating an aggressive targeting shift. Data breaches and leaks rose steadily, while web exploit discussions spiked 347%, likely reflecting increased exploitation of e-commerce and customer platforms. Hacktivism declined sharply (down 90%), while DDoS and claimed hack chatter rebounded—suggesting greater emphasis on financially driven cybercrime.
Vulnerabilities (Moderate): Consumer goods & services ranked 4th for linked CVEs (8.1%). Injection flaws remained the top issue across periods, with web-facing systems at risk. RCE vulnerabilities spiked mid-quarter before declining but remain serious. Memory/buffer issues rose significantly, often tied to outdated software. Web vulnerabilities like XSS and clickjacking showed moderate activity, while DoS and information disclosure trends remained consistent. Privilege escalation risks stayed low but persistent.
Ransomware (High): This sector ranked 1st in ransomware frequency, with 296 victims—up 13.3% from the prior quarter. Consumer goods & services made up 15.1% of global ransomware incidents. A February spike, largely driven by Cl0p (110 victims, 46% of their total), dramatically elevated risk. Cactus also showed strong interest, with 40% of its victims from this sector. Other active groups like Akira and RansomHub contributed heavily. The U.S. accounted for 64% of incidents. Despite the victim volume, the geographic spread declined slightly to 36 countries.