
The CYFIRMA Industry Report delivers original cybersecurity insights and telemetry-driven statistics of global industries, covering one sector each week for a quarter. This report focuses on the consumer goods & services industry, presenting key trends and statistics in an engaging infographic format.
Welcome to the CYFIRMA infographic industry report, where we delve into the external threat landscape of the consumer goods & services industry over the past three months. This report provides valuable insights and data-driven statistics, delivering a concise analysis of attack campaigns, phishing telemetry, and ransomware incidents targeting the consumer goods & services sectors.
We aim to present an industry-specific overview in a convenient, engaging, and informative format. Leveraging our cutting-edge platform telemetry and the expertise of our analysts, we bring you actionable intelligence to stay ahead in the cybersecurity landscape.
CYFIRMA provides cyber threat intelligence and external threat landscape management platforms, DeCYFIR and DeTCT, which utilize artificial intelligence and machine learning to ingest and process relevant data, complemented by manual CTI research.
For the purpose of these reports, we leverage the following data from our platform. These are data processed by AI and ML automation, based on both human research input and automated ingestions.
While this report contains statistics and graphs generated primarily by automation, it undergoes a thorough review and enhancement for additional context by CYFIRMA CTI analysts to ensure the highest quality and provide valuable insights.
The consumer goods & services industry over the past 90 days featured in 3 out of the 14 observed campaigns, which is a presence in 21% of all campaigns. That is a decline from 4 in the previous 90 days, and a notable drop in overall share from 57% (4 out of 7).


Activity has peaked during June and July. August did not record new campaigns, but it is likely that June and July campaigns are ongoing.

Active threat actors originate from China and Southeast Asia. Volt Typhoon is a known nation-state actor from China. CCTH2501 and CCVN2501 are cybercrime groups from Thailand and Vietnam, respectively, both observed in 2025 for the first time.
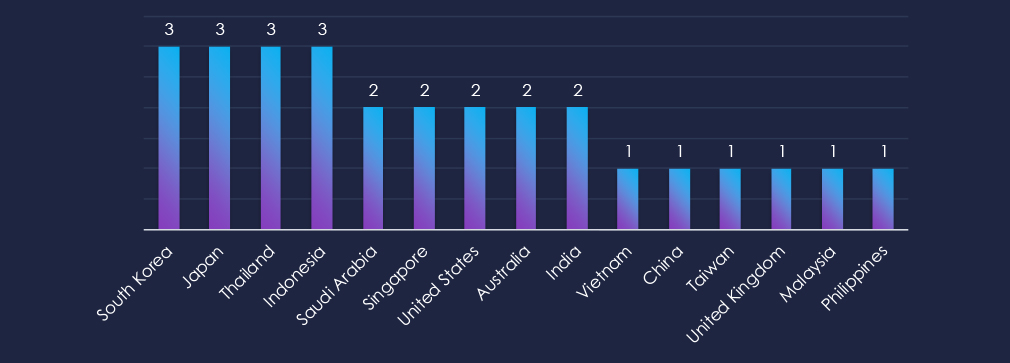
Asian countries are the most prominent, South Korea, Japan, Thailand, and Indonesia recorded victims in all 3 campaigns. It is surprising that Thai victims were observed in all 3 campaigns, meaning Thai cybercriminals are attacking their own country. Typically, cybercrime avoids domestic targets to avoid local law enforcement.
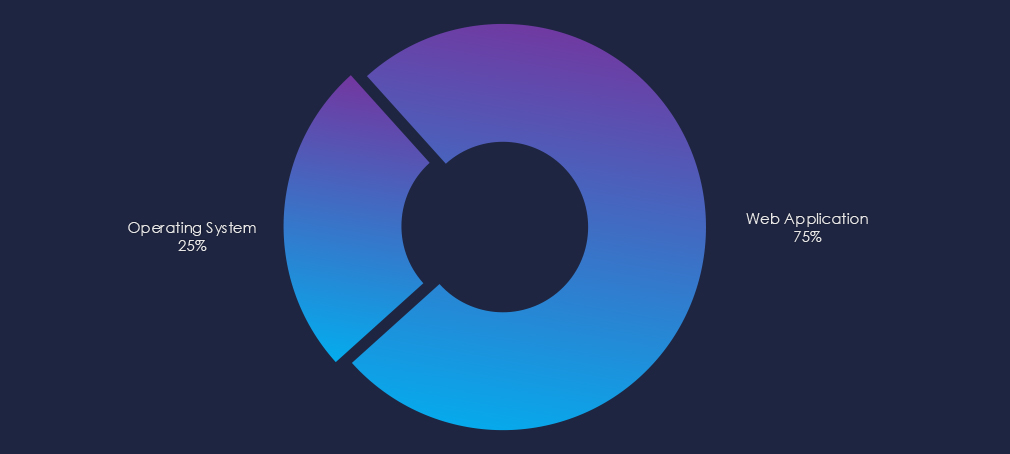
Observed campaigns were fairly straightforward, directly attacking Web Applications and OS.

Over the past 90 days, the consumer goods & services industry has not been significantly affected by advanced persistent threat (APT) campaigns.
Out of the 14 observed APT campaigns, only 3 targeted this sector, representing 21% of the observed campaigns. This is a decline from the previous 90-day period, during which 4 out of 7 campaigns targeted the consumer goods & services businesses.
Monthly Trends
June and July recorded 1 and 2 campaigns, respectively. August did not observe a new campaign, but many campaigns do continue.
Key Threat Actors
Active threat actors have been identified in China and Southeast Asia. Volt Typhoon is a known Chinese state-sponsored group, while CCTH2501 (Thailand) and CCVN2501 (Vietnam) are cybercrime groups first observed in 2025.
Geographical Impact
Overall, 15 countries recorded victims in the observed campaigns.
South Korea, Japan, Thailand, and Indonesia reported victims across all three campaigns. Notably, Thai actors targeted domestic victims, an uncommon move since cybercriminals usually avoid local targets to reduce law enforcement risk.
Targeted Technologies
Observed campaigns were fairly straightforward, directly attacking Web Applications and OS.
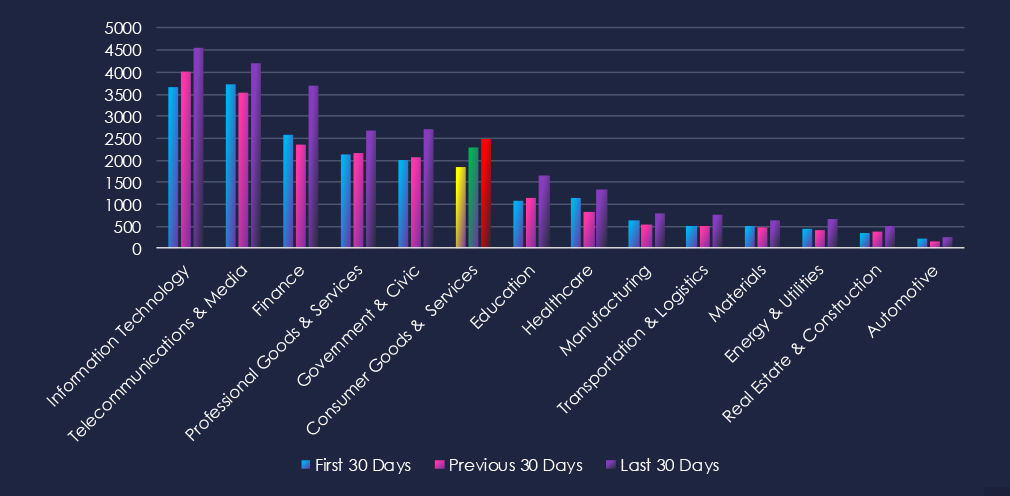
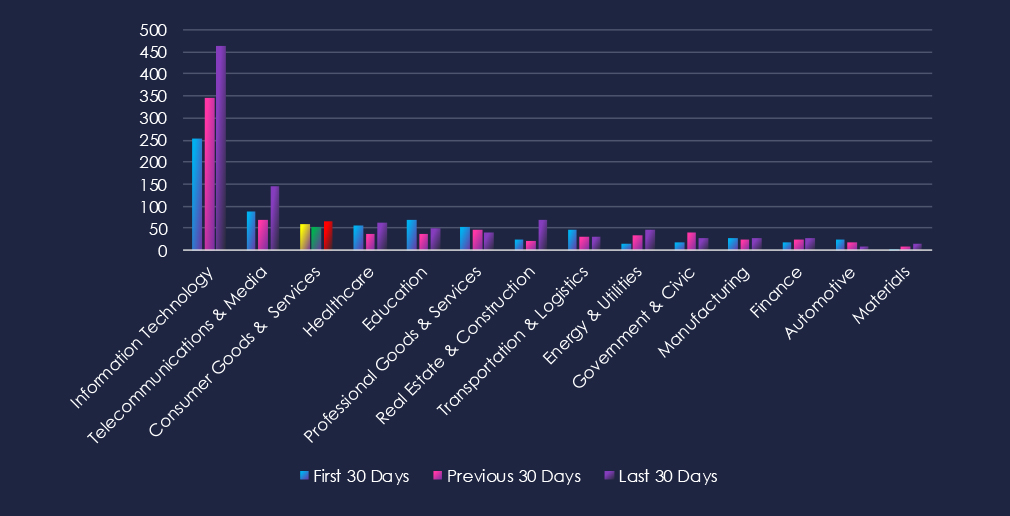
Over the past three months, CYFIRMA’s telemetry has identified 6,607 mentions of the consumer goods & services industry out of a total of 68,578 industry mentions. This is from a total of 300k+ posts across various underground and dark web channels and forums.
Consumer goods & services industry placed 6th out of 14 industries in the last 90 days with a share of 9.6% of all detected industry-linked chatter.
Below is a breakdown by 30-day periods of all mentions.
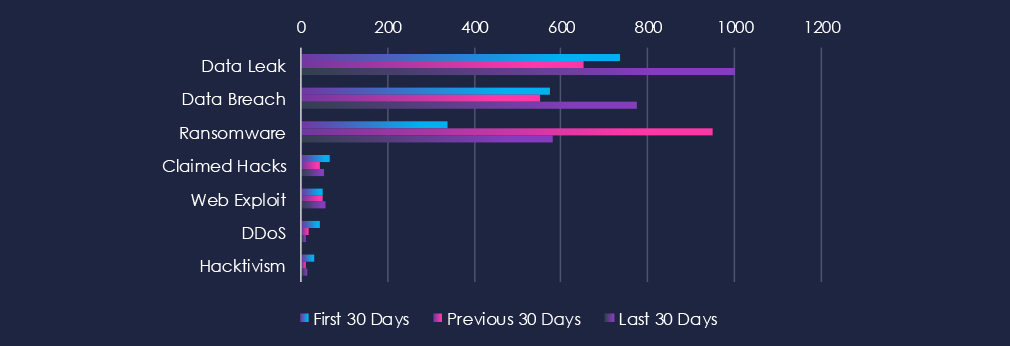
Data Leaks and Data Breaches are by far the most common category of recorded chatter, spiking during the last 30 days and showing high sustained interest. Ransomware chatter has spiked in the previous 30 days, and although weaker, it maintained an elevated number in the last 30 days.

In total, the consumer goods & services industry comprises 9.6% of all detected industry underground and dark web chatter in the last 90 days, ranking 6th out of 14 industries.
Below are observed key trends across 90 days:
Data Leak
737 → 653 → 1001, Significant surge in the most recent 30 days. Reflects increased exposure of sensitive consumer and retail data, likely through compromised e-commerce platforms, loyalty databases, and vendor breaches.
Data Breach
575 → 550 → 776, Stable at first, then a sharp rise. Suggests a renewed wave of compromises targeting customer records and corporate systems within the sector.
Ransomware
339 → 949 → 581, A massive spike in the middle period followed by a decline, though still elevated. Indicates ransomware operators remain highly active in this industry, but intensity has moderated after the peak.
Claimed Hacks
65 → 45 → 52, A small rebound in the latest period. Shows that intrusions continue to be reported or advertised in underground channels, often used to sell access or demonstrate impact.
Web Exploit
51 → 50 → 55, Consistently steady across all periods. Highlights ongoing exploitation of retail web apps, online portals, and e-commerce infrastructure.
DDoS
42 → 19 → 12, Steady decline across all periods. Suggests volumetric disruption is becoming less of a focus compared to direct compromise and extortion.
Hacktivism
31 → 11 → 13, Reduced activity overall, but still present. May reflect low-level ideologically driven campaigns, overshadowed by financially motivated attacks.
Over the past three months, CYFIRMA’s telemetry has identified 176 mentions of the consumer goods & services industry out of a total of 2,652 industry mentions. This is from over 10k CVEs reported and updated in the last 90 days.
Consumer goods & services industry ranked 3rd out of 14 industries in the last 90 days, with a share of 6.7% of all detected industry-linked vulnerabilities.
Below is a breakdown by 30-day periods of all mentions.
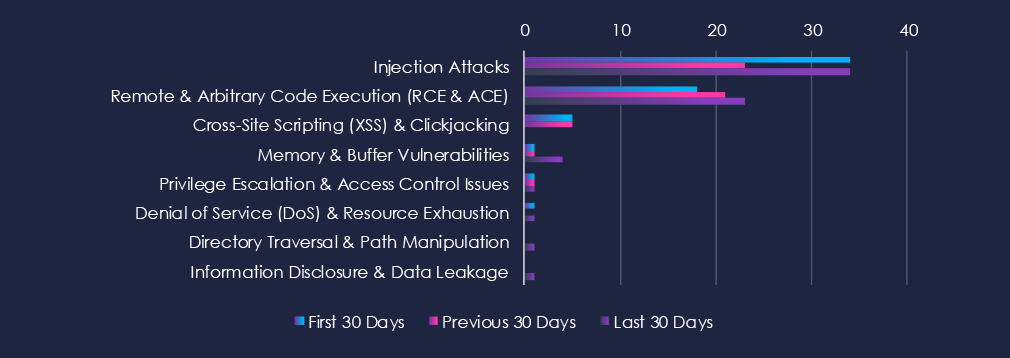
Injection attacks are the most common type of vulnerability. Followed by Remote & Arbitrary Code Execution (RCE & ACE). In third place are Cross-Site Scripting (XSS) & Clickjacking. This aligns with the online retail and e-commerce nature of this industry.

In total, the consumer goods & services industry comprises 6.7% of all detected industry-linked vulnerabilities in the last 90 days. And ranking 3rd out of 14 industries.
Below are observed key trends across 90 days.
Injection Attacks
34 → 23 → 34, After a dip in the middle period, injection vulnerabilities rose again to previous levels. This pattern suggests recurring discovery of input validation flaws in consumer-facing platforms and e-commerce systems.
Remote & Arbitrary Code Execution (RCE & ACE)
18 → 21 → 23, Steady and gradually increasing disclosure volume. Indicates consistent researcher and vendor focus on high-severity vulnerabilities that could enable full compromise of retail or service platforms.
Cross-Site Scripting (XSS) & Clickjacking
5 → 5 → 0, Stable reporting early on, but none in the most recent period. May reflect remediation in key platforms or reduced researcher focus on these categories.
Memory & Buffer Vulnerabilities
1 → 1 → 4, Gradual rise, showing increased identification of memory-handling issues, possibly in third-party libraries or embedded retail software.
Privilege Escalation & Access Control Issues
1 → 1 → 1, Minimal but persistent, reflecting occasional discoveries of permission or role mismanagement vulnerabilities.
Denial of Service (DoS) & Resource Exhaustion
1 → 0 → 1, Very low volume but recurring, suggesting sporadic disclosure of availability-related flaws.
Directory Traversal & Path Manipulation
0 → 0 → 1, Rare, but recent disclosure highlights potential for file access or misconfiguration flaws in consumer-facing applications.
Information Disclosure & Data Leakage
0 → 0 → 1, Minimal but notable given the sector’s reliance on customer data, indicating isolated findings of unintended exposure.
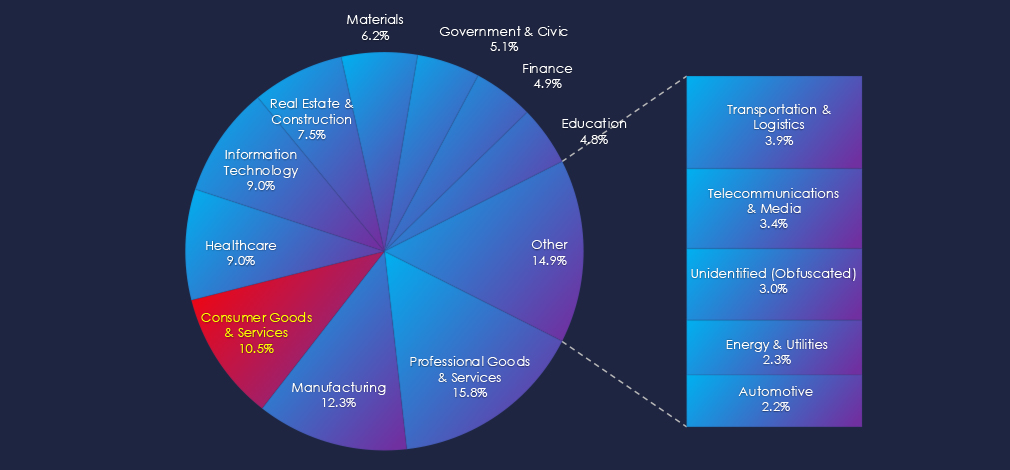
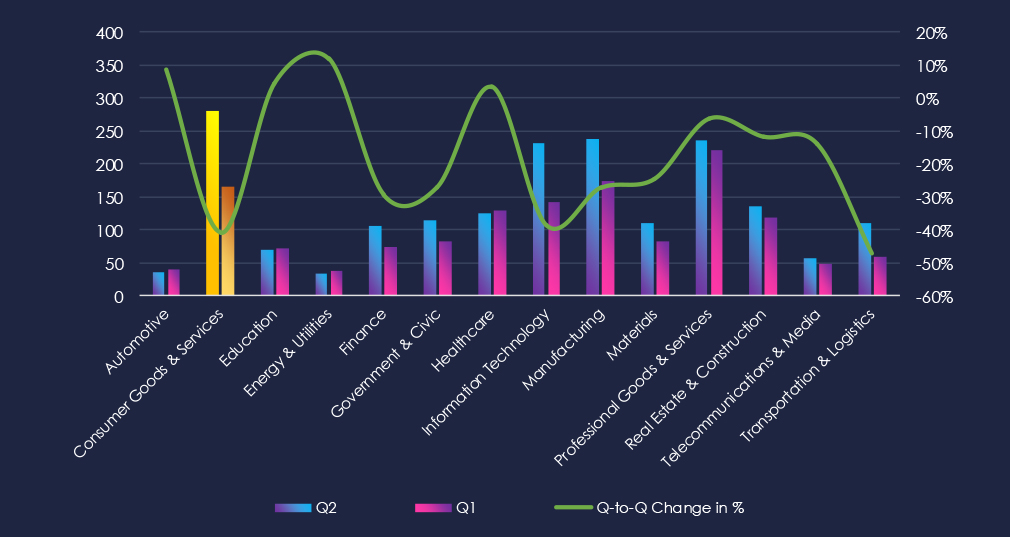
In the past 90 days, CYFIRMA has identified 152 verified ransomware victims in the consumer goods & services industry. This accounts for 10.5% of the overall total of 1,445 ransomware victims during the same period, placing the consumer goods & services sector 3rd out of 14 industries.
Furthermore, a quarterly comparison reveals a major decline in victims in the consumer goods & services industry by 20.4% from 191 to 152 victims. The overall share of victims also increased from 11.5% to 10.5% of all victims.
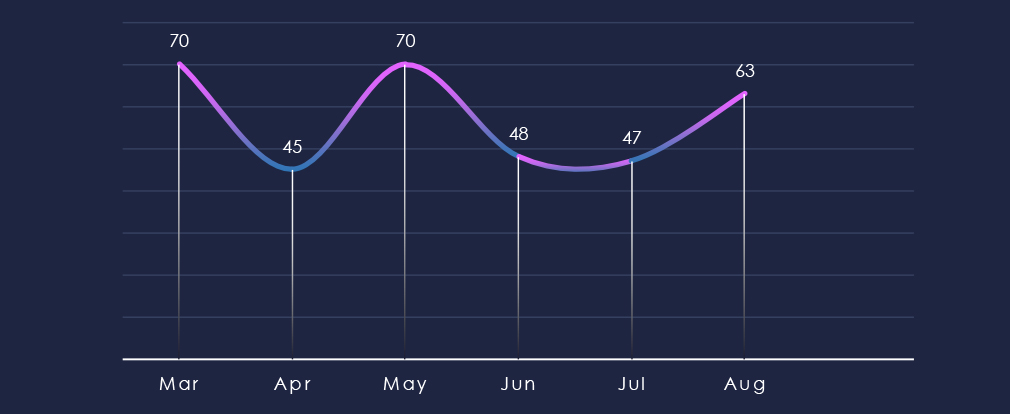
Over the past 180 days, the number of victims has been sustained but somewhat choppy, with high activity months alternating with more moderate months.
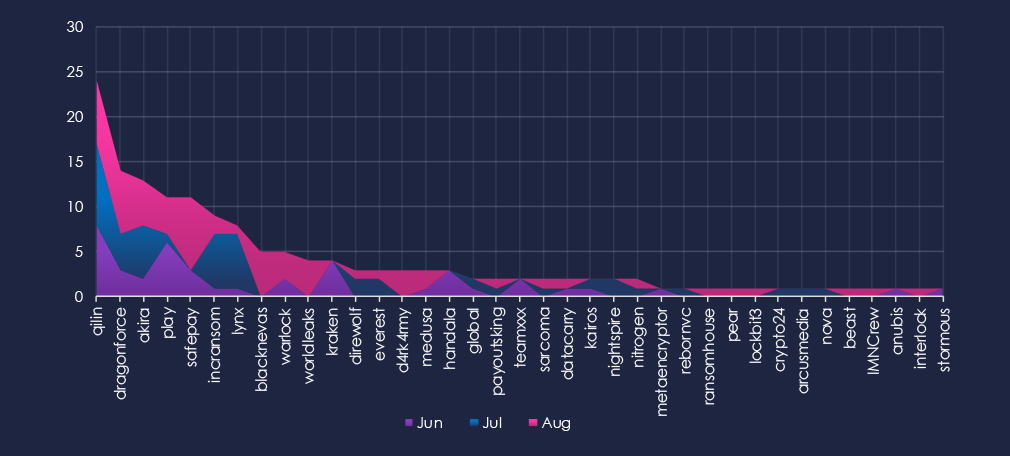
A breakdown of monthly activity per gang provides insights into which gangs were active each month. For example, by far the most active gang, Qilin, was active across the last 3 months. On the other hand, the fourth most active gang, Play, was nearly inactive during July. Emerging gangs Blacknevas, Worldleaks, D4rk4rmy, and many others were active only in August.
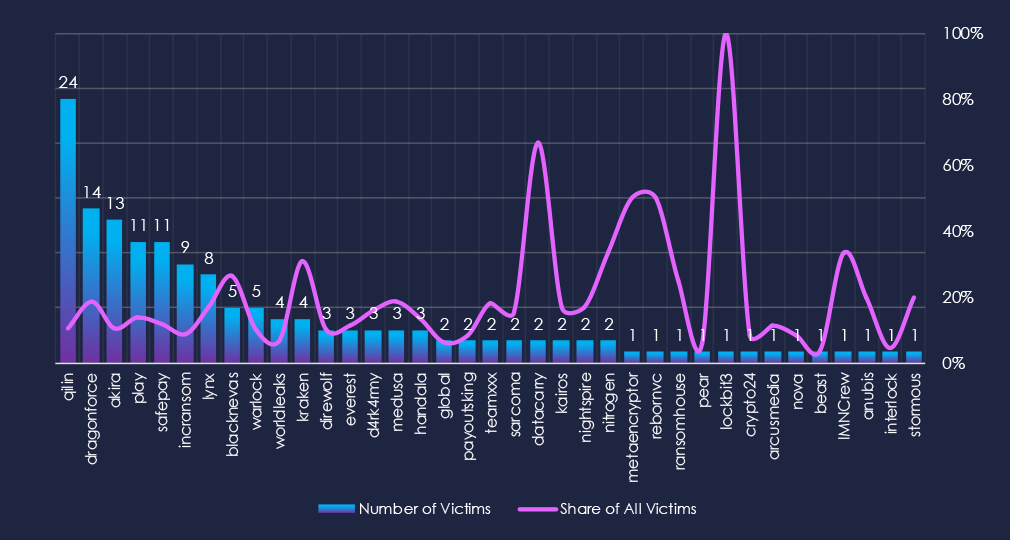
Out of the 70 gangs, 37 recorded victims in this industry in the last 90 days (53% participation). Qilin had the highest number of victims (24) with an elevated share (11%).
The share of victims for many gangs in this industry is high. Most gangs have more than 10% share of their victims from small and medium businesses.
Dragonforce (18%), Blacknevas (26%), and Kraken (31%) had the highest shares of victims among more active gangs, implying a high focus on this industry.
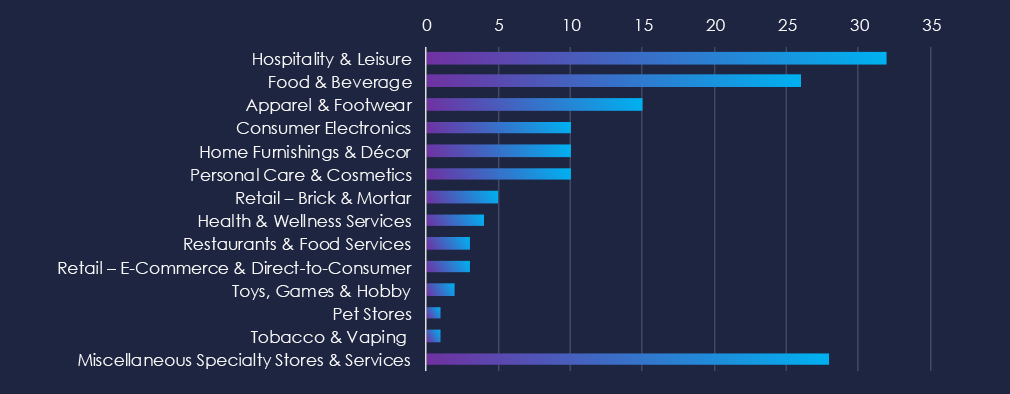
Hospitality & Leisure are the most common victims of ransomware in this industry. Food & Beverage with Apparel & Footwear retailers follow on top.
Miscellaneous Specialty Stores & Services are the second most frequent group overall, underlining the highly diverse nature of this industry.
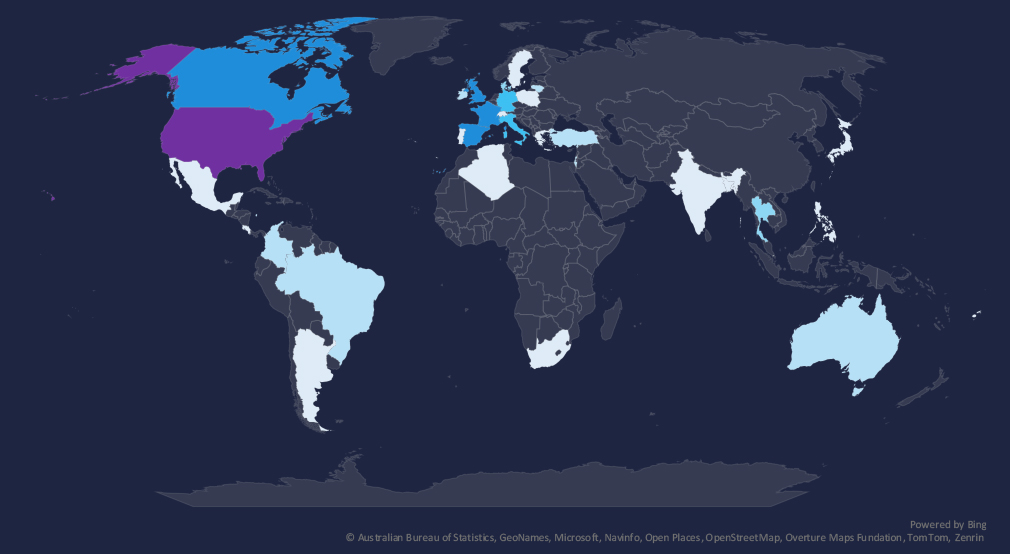
The geographic distribution heatmap underscores the widespread impact of ransomware, highlighting the countries where victims in this industry have been recorded in last 90 days.
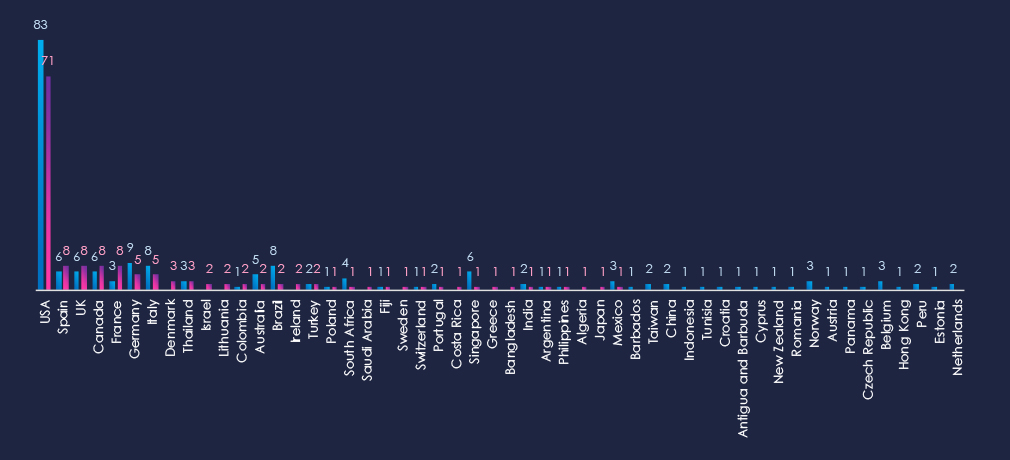
The chart shows quarter-to-quarter changes in targeted countries. Data is sorted by the last 90 days and compared to the previous 90 days, marked in blue.
In the last 90 days, the USA recorded 71 victims (47% of all victims). Spain, the UK, Canada, and France follow in shared 2nd place. Germany, Italy, Brazil, and Singapore recorded a drop in victims, while France recorded a notable increase.
Many countries from the previous 90 days did not record new victims at all.

Consumer goods & services are the 3rd frequent victims of ransomware. This is largely due to the high number of small and medium sized businesses present.
The number of victims declined since the previous 90-day period (191 to 152). Overall share also dropped from 11.5%% to 10.5% of all ransomware victims.
Monthly Activity Trends
Victim numbers have held at a consistent level but with noticeable swings, as months of elevated activity alternated with more moderate ones.
Ransomware Gangs
A total of 37 out of 70 active ransomware groups targeted this industry in the past 90 days, representing 53% participation:
Qilin: The most active, with 24 victims, has a high share of 11% (24 out of 225) of all its victims.
Dragonforce: Second most active (14) with 18% (14 out of 76) share.
Blacknevas, Kraken: Highest shares of 26% (5 out of 19) and 31% (4 out of 13) victims among top gangs. Showing high focus on this industry.
Geographic Distribution
The geographic distribution of ransomware victims is relatively high yet quite concentrated in the USA*(USA warrants a higher risk), which accounts for 47% of all victims.
With 8 cases, Spain, the UK, Canada, and France held second place. Italy, Brazil, and Singapore saw fewer victims, whereas France registered noticeable increases.
In total, 33 countries recorded ransomware victims in this industry in the last 90 days, a decline from 41 in the previous 90-day period.
For a comprehensive, up-to-date global ransomware tracking report, please refer to our new monthly “Tracking Ransomware” series here.
APT Campaigns (Low): Consumer goods & services remained a low-priority target for APTs. Only 3 of 14 observed campaigns (21%) hit this sector, down from 57% in the prior period. Campaigns were active in June and July, with no new ones recorded in August. Chinese state-linked Volt Typhoon and newly observed Southeast Asian groups (CCTH2501 and CCVN2501) were involved, with Thailand-based actors unusually targeting local victims. Fifteen countries recorded incidents, with South Korea, Japan, Thailand, and Indonesia present in all three campaigns. Most attacks focused on web applications and operating systems.
Underground & Dark Web Chatter (Moderate): This sector accounted for 9.6% of chatter, ranking 6th. Data leaks surged sharply to over 1,000 mentions in the last 30 days, while breaches also rose, highlighting the ongoing compromise of consumer and retail data. Ransomware chatter spiked mid-period before moderating, though still elevated. Claimed hacks ticked up again, suggesting continued access sales. Web exploit chatter stayed steady, showing persistent pressure on e-commerce and retail platforms. DDoS mentions dropped steadily, while hacktivism diminished but remains present at a low level.
Vulnerabilities (High): Consumer goods & services ranked 3rd in vulnerability disclosures, with 6.7% of industry-linked CVEs. Injection flaws rebounded strongly, showing recurring risks in consumer-facing portals and online platforms. RCE vulnerabilities grew steadily, reflecting continuous discovery of high-severity exposures. XSS activity disappeared in the latest period, possibly due to patching, while memory flaws rose modestly. Access control, DoS, and information leakage were minimal but persistent.
Ransomware (High): This sector is the 3rd most frequent ransomware victim, though victim numbers declined from 191 to 152 (10.5% of all cases). Activity fluctuated but remained consistent. Qilin was the most active group, recording 24 victims (11% of its total), followed by Dragonforce with 14, and others showing disproportionately high focus. The USA accounted for nearly half of the victims, with Spain, the UK, Canada, and France also significant. Overall, 33 countries recorded victims, a drop from 41 previously, suggesting narrower but still global exposure.