
The CYFIRMA Industry Report delivers original cybersecurity insights and telemetry-driven statistics of global industries, covering one sector each week for a quarter. This report focuses on the consumer goods & services industry, presenting key trends and statistics in an engaging infographic format.
Welcome to the CYFIRMA infographic industry report, where we delve into the external threat landscape of the consumer goods & services industry over the past three months. This report provides valuable insights and data-driven statistics, delivering a concise analysis of attack campaigns, phishing telemetry, and ransomware incidents targeting the consumer goods & services industry.
We aim to present an industry-specific overview in a convenient, engaging, and informative format. Leveraging our cutting-edge platform telemetry and the expertise of our analysts, we bring you actionable intelligence to stay ahead in the cybersecurity landscape.
CYFIRMA provides cyber threat intelligence and external threat landscape management platforms, DeCYFIR and DeTCT, which utilize artificial intelligence and machine learning to ingest and process relevant data, complemented by manual CTI research.
For the purpose of these reports, we leverage the following data from our platform. These are data processed by AI and ML automation based on both human research input and automated ingestions.
While this report contains statistics and graphs generated primarily by automation, it undergoes thorough review and enhancement for additional context by CYFIRMA CTI analysts to ensure the highest quality and provide valuable insights.
Consumer goods & services organizations featured in 4 out of the 12 observed campaigns, which is a presence in 33% of all campaigns.

The number of observed APT campaigns targeting this industry peaked in October and sharply declined over the past 90 days.
Observed threat actors originate mostly from Russia. The consumer goods & services industry is mostly a victim of financially motivated cybercrime as it generally does not have a strategic geopolitical value.
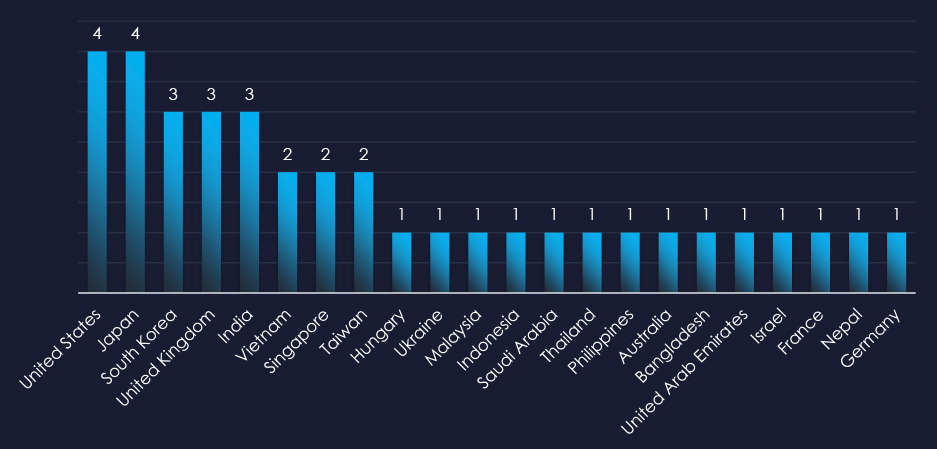
The recorded victims of observed attack campaigns span 22 countries. The scattered nature of the victims underlines opportunistic, financially motivated cybercrime.
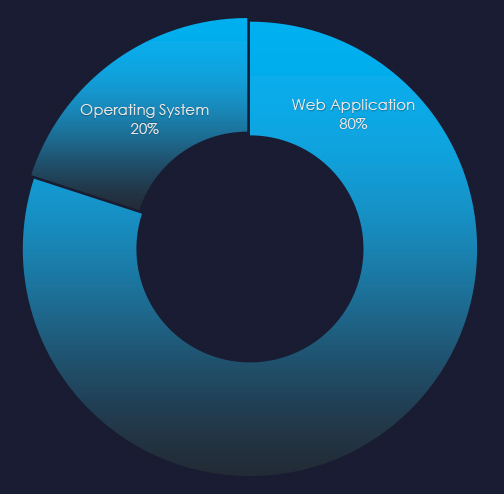
Most campaigns utilized Web Application attacks as a primary attack vector. One campaign utilized operating systems exploitation.
Risk Level Indicator: Moderate

In the past 90 days, consumer goods & services organizations have been moderately impacted by advanced persistent threat (APT) campaigns. 33% of observed APT campaigns recorded consumer goods & services industry victims, with 4 out of 12 total campaigns.
Monthly Trends
Activity peaked in October and sharply slowed down since then.
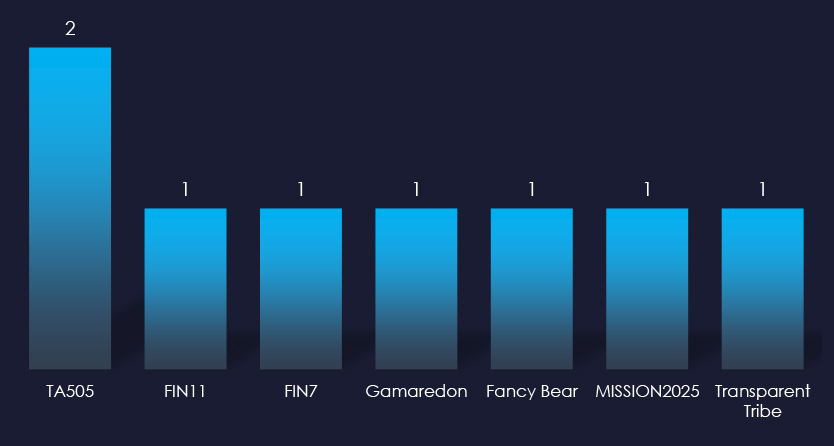
Key Threat Actors
The consumer goods & services industry is mostly highly fragmented and localized and generally does not have significant strategic value for nation-states. As such it attracts mostly financially motivated cybercrime. In the past 90 days, it was predominantly Russia, with one Chinese and Pakistani campaigns.
Geographical Impact
The campaigns have affected a total of 22 countries, dispersed across continents in line with the opportunistic nature of financial cybercrime.
Targeted Technologies
Web applications remain the most frequently targeted technology with operating systems also being exploited.
Over the past 3 months, CYFIRMA’s telemetry detected 4,000 phishing campaigns themed around the consumer goods & services industry out of a total of 205,150.
The chart below illustrates the global distribution of observed themes. Combined consumer goods & services-related phishing accounts for 1.95% of all captured phishing campaigns.
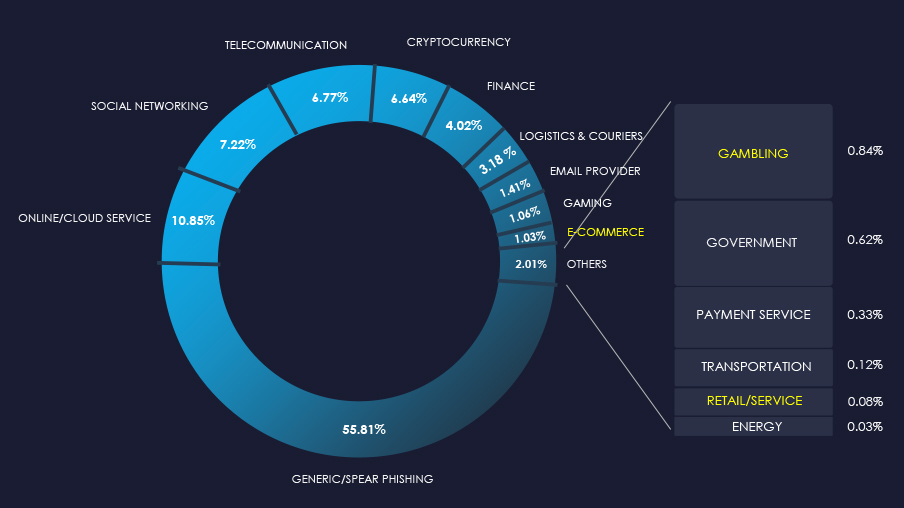
Gambling platform Bet365 and e-commerce platforms like Amazon, eBay, and Alibaba are among the most popular phishing themes for consumer goods & services.
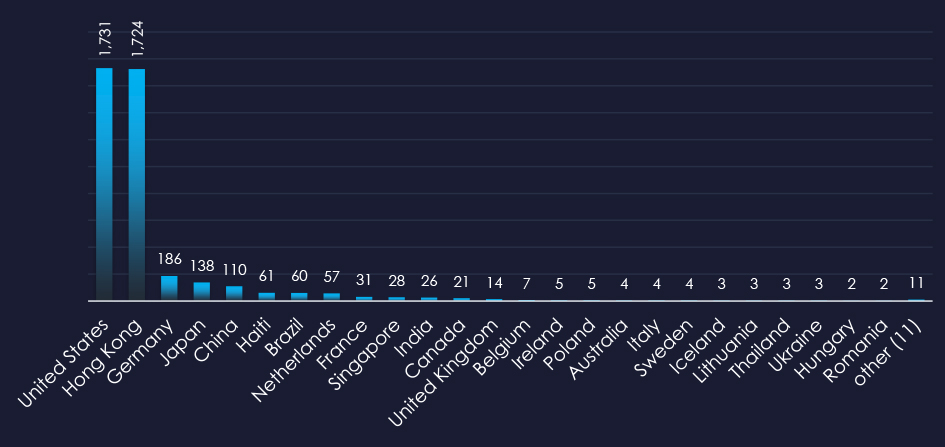
The United States and Hong Kong are by far the largest sources of observed phishing, followed by Germany and Japan. Surprisingly, Haiti is in sixth place.
Risk Level Indicator: Moderate

The consumer goods & services remain a moderately popular phishing theme due to the direct monetization avenue as well as account takeovers. However, its share mildly decreased from 2.92% to 1.95%. This is largely due to the increasing share of unique and uncategorized Generic/Spear Phishing.
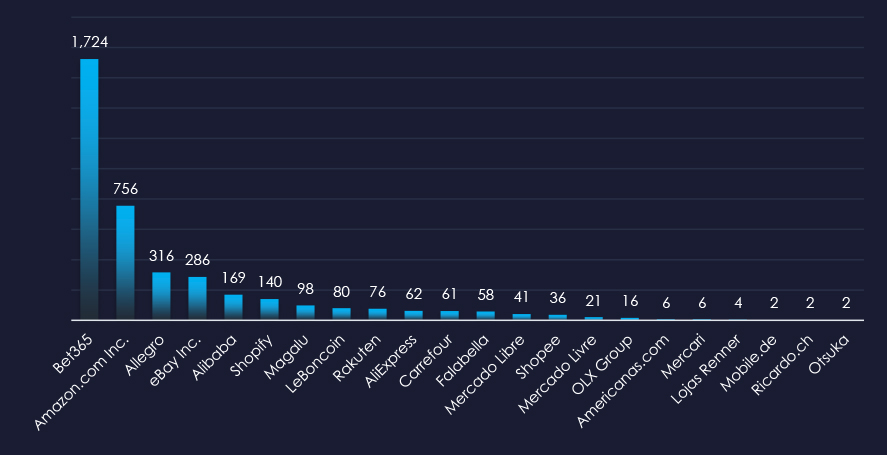
Gambling platform Bet365 and e-commerce platforms like Amazon, eBay, and Alibaba stand out as the most impersonated brands in the last 90 days.
Overall, the list includes 22 organizations from 36 countries.
ASN-origin data reveals that the United States and Hong Kong are the leading sources of phishing emails in this industry, reflecting the eastern and western targeting by respective threat actors.
Surprisingly, Haiti is ranked as the 6th most frequent source, impersonating retail chain Carrefour.
Furthermore, India, Thailand, Brazil, Chile, Peru, and Panama were observed as sources, underscoring South & Southeast Asia and Latin America as growing sources and targets of global phishing.
The presence in both developed and developing nations highlights that phishing campaigns are opportunistic and globally pervasive.
In the past 90 days, CYFIRMA has identified 179 verified ransomware victims in the consumer goods & services industry. This accounts for 10.6% of the overall total of 1,693 ransomware victims during the same period. Placing the consumer goods & services industry as the 3rd most frequent victim of ransomware.
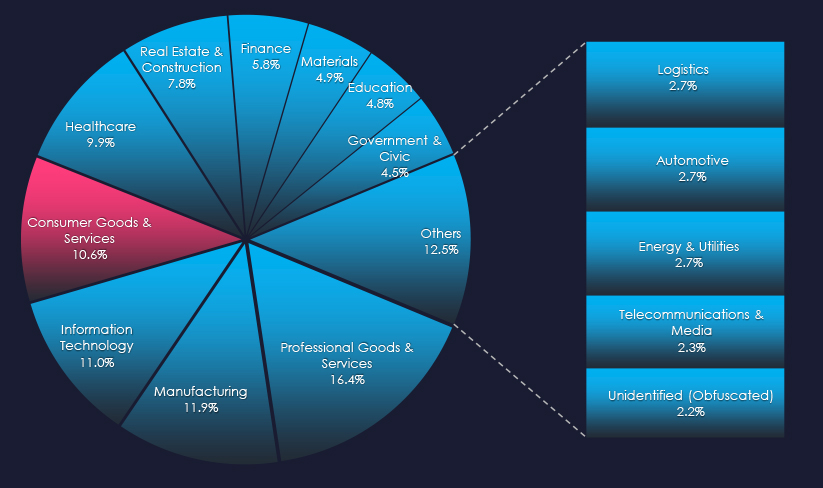
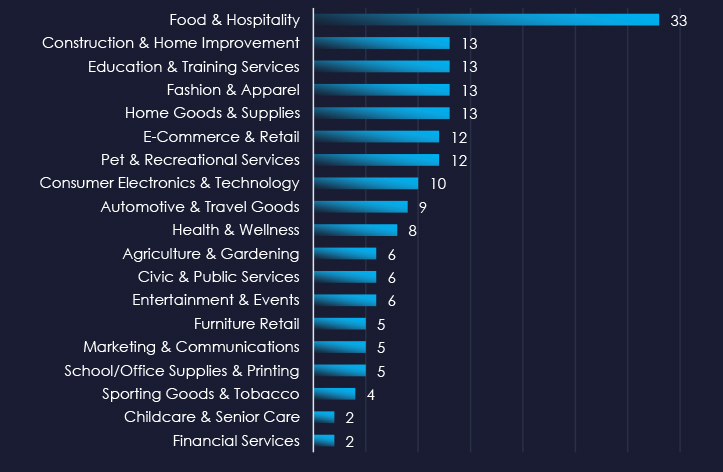
As per the consolidated sectors chart above, Food & Hospitality are the most frequent victims of ransomware by a significant margin in this industry.
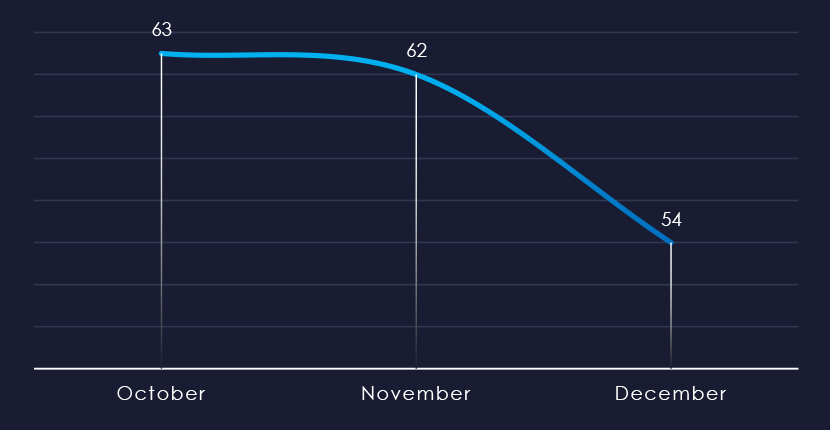
Over the past 90 days, we’ve observed sustained activity during October and November with a notable dip during December. Likely due to even cybercriminals observing the holiday season, rather than the downward trend of ransomware in general.
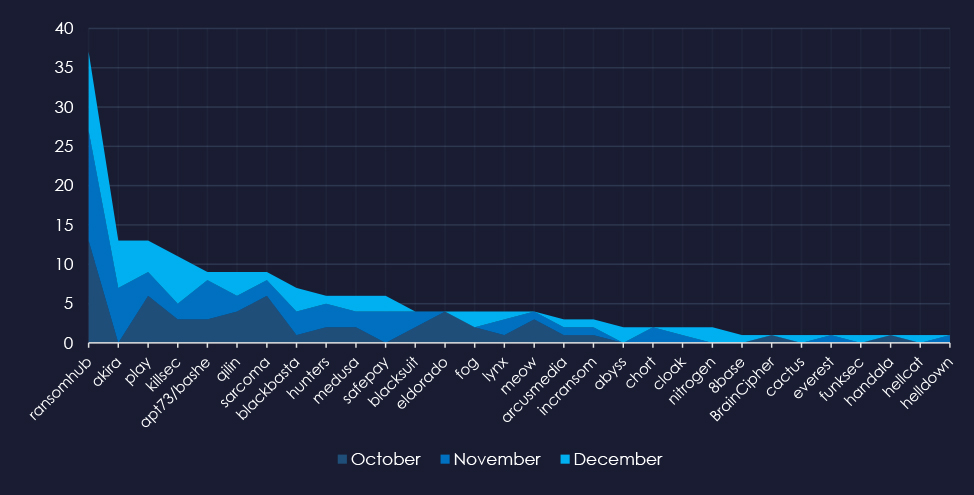
A top 30 gangs’ breakdown of the monthly activity provides insights into which gangs were active each month. For example, RansomHub was active for months. Akira recorded no victims in October while Eldorado recorded all their victims in October.
In total 42 out of 62 active groups recorded consumer goods & services organizations victims in the past 90 days. Notable is the relatively high distribution among many groups in this period.
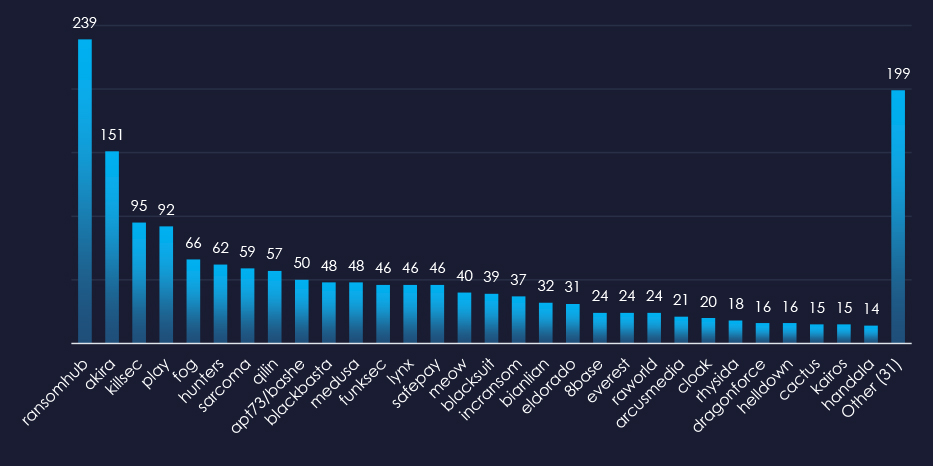
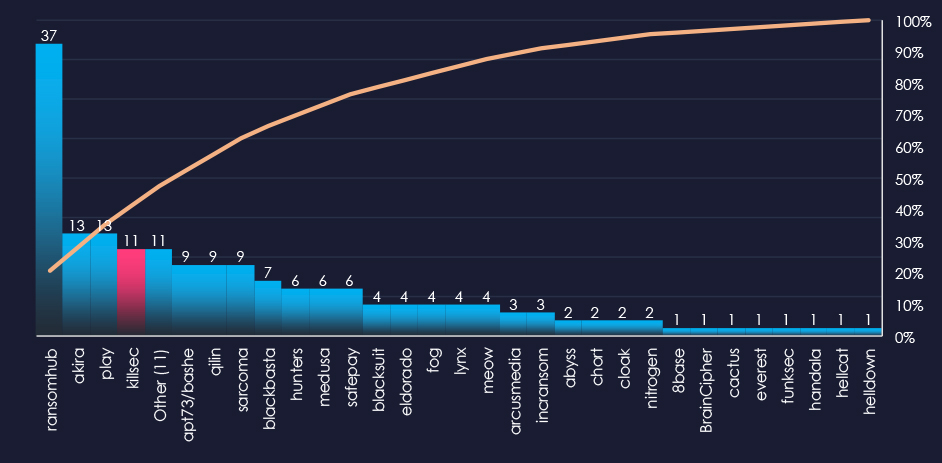
When comparing the consumer goods & services industry to all recorded victims, RansomHub emerges with the highest number of victims overall and a significant share of 15% of victims (37 out of 239). Qilin shows the highest targeting of this industry, with 16% (9 out of 57) of their victims coming from this industry.
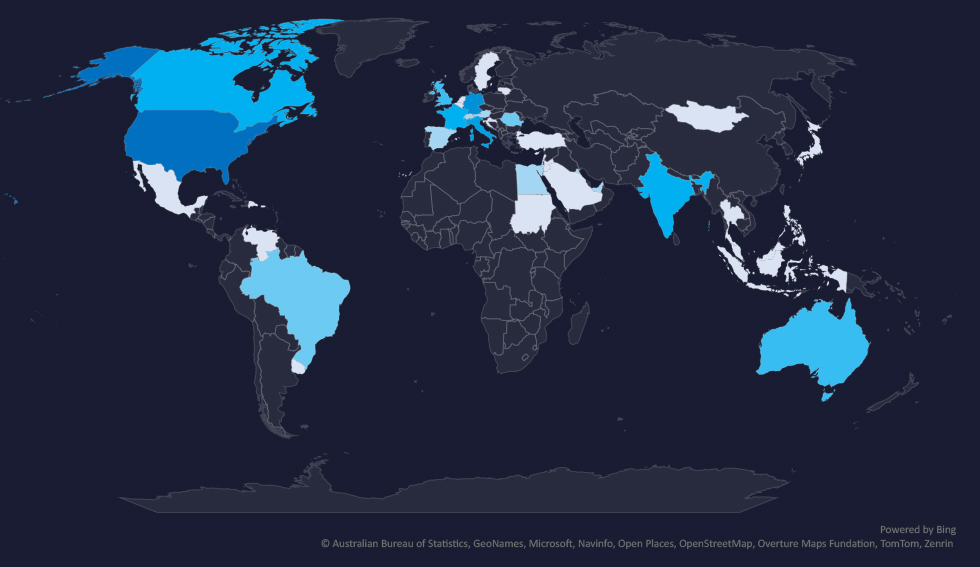
The geographic distribution heatmap underscores the widespread impact of ransomware, highlighting the countries where victims in this industry have been recorded.
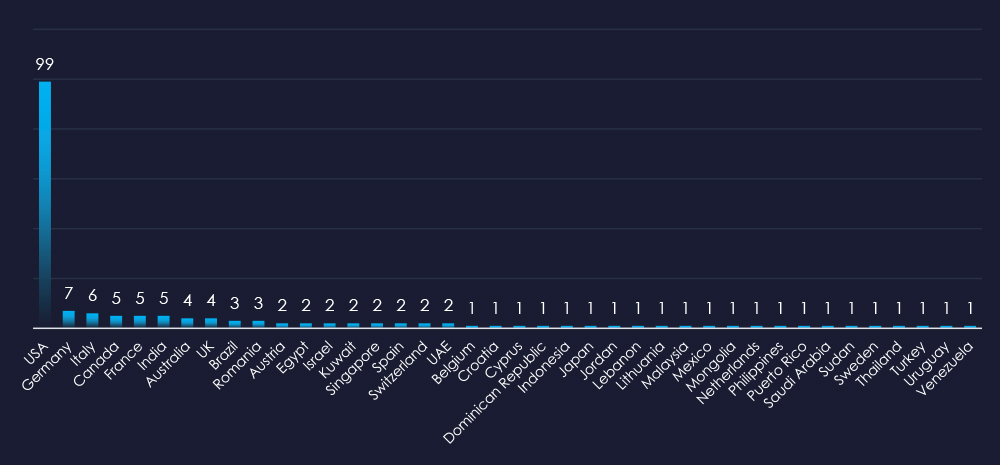
In total 40 countries recorded ransomware victims with the US alone accounting for 55% of all victims with identified geography.
Risk Level Indicator: High

The consumer goods & services industry is placed as 3rd most frequent victim. It faces a sustained ransomware threat, with attacks affecting a variety of sub-sectors and a broad geographic distribution. The steady monthly activity, coupled with the involvement of numerous ransomware groups, highlights the ongoing risk.
Monthly Activity Trends
Ransomware activity in the consumer goods & services industry was sustained during October and November and mildly declined during December.
Ransomware Gangs
A total of 42 out of 62 active ransomware groups targeted the consumer goods & services industry in the past 90 days:
RansomHub: Recorded the most victims (37 out of 239 victims), mostly due to the sheer volume, but they also show significant focus on this industry with a 15% of share of victims.
Qilin: The highest share of their victims were from this industry with 16% (9 out of 57 victims).
Geographic Distribution
The geographic distribution of ransomware victims in the consumer goods & services industry reflects the industry’s global nature and the widespread reach of these attacks:
55% of all victims with identified geography are located in the US.
Alongside the US, Germany, Italy, Canada, France, and India recorded the most victims. This correlates with large consumer markets in these countries.
In total, 40 countries recorded ransomware victims in the professional goods & services industry.
For a comprehensive, up-to-date global ransomware tracking report, please refer to our new monthly “Tracking Ransomware” series here.
Over the past 90 days, consumer goods & services organizations faced moderate to high cyber risks across monitored categories.
APT Campaigns (Moderate): 33% (4 out of 12) of observed campaigns targeted the sector, peaking in October before slowing sharply. Threat actors were predominantly Russia-based cybercriminals, with one campaign each linked to China and Pakistan. These attacks spanned 22 countries, targeting web applications and operating systems.
Phishing (Moderate): The sector’s phishing share dipped from 2.92% to 1.95%, yet it remains a viable target for monetization and account takeovers. Bet365, Amazon, eBay, and Alibaba were the most impersonated brands. The U.S. and Hong Kong led as phishing sources, with unexpected activity from Haiti (impersonating Carrefour). India, Thailand, Brazil, Chile, Peru, and Panama further illustrate growing global participation in phishing.
Ransomware (High): Ranked as the 3rd most frequently victimized industry, it faced a sustained threat from 42 out of 62 active ransomware groups. RansomHub claimed the most victims overall (37 out of 239), showing 15% focus on this sector, while Qilin recorded the highest relative focus at 16% (9 out of 57). More than half (55%) of identified victims were based in the U.S., followed by Germany, Italy, Canada, France, and India, totaling 40 affected countries.