


The CYFIRMA Industry Report delivers original cybersecurity insights and telemetry- driven statistics of global industries, covering one sector each week for a quarter. This report focuses on consumer goods and services, presenting key trends and statistics in an engaging infographic format.
Welcome to CYFIRMA infographic industry report, where we delve into the external threat landscape of the consumer goods and services industry over the past three months. This report provides valuable insights and data-driven statistics, delivering a concise analysis of attack campaigns, phishing telemetry, and ransomware incidents, targeting consumer goods and services, including food and beverage, leisure, gaming, luxury, e-commerce or apparel etc.
We aim to present an industry-specific overview in a convenient, engaging, and informative format. Leveraging our cutting-edge platform telemetry and the expertise of our analysts, we bring you actionable intelligence to stay ahead in the cybersecurity landscape.
Consumer goods and services organizations featured in 33 out of the 62 observed campaigns, which is a substantial presence in 53% of the campaigns. This high representation is attributed to the diverse array of sectors encompassed within the consumer goods and services industry. Monthly activity appears to calm down after June and July spikes.

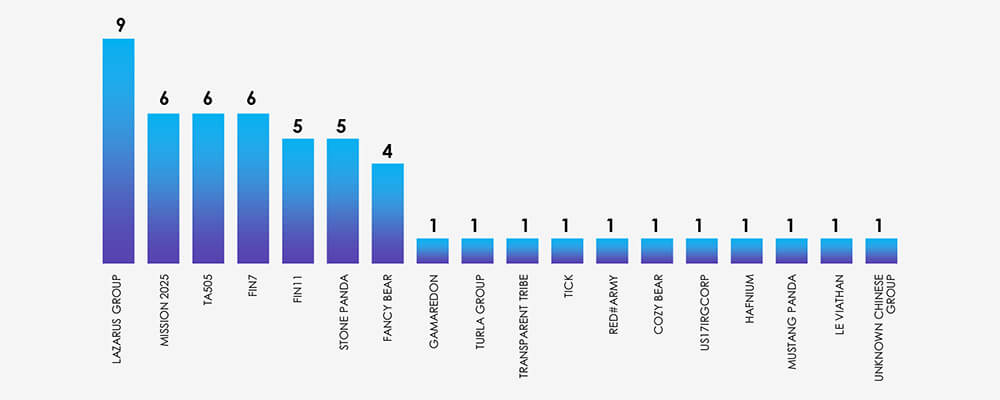
The diverse array of various sectors in this industry also translates into a diverse range of suspected threat actors. The aforementioned, June and July spikes are attributed to increased Lazarus Group activity, linked to the discovery of MagicRAT and QuiteRAT. There was also a surge in Chinese cyber activity, using the Barracuda ESG vulnerability and other TTPs used in the same campaigns, resulting in more detections.
Financially motivated threat actors, TA505 and FIN11 are connected to the Cl0p ransomware group, which carried out a widespread ransomware campaign, using the MoveIt file transfer vulnerability.
Europe is again taking the lead as the most attacked region, but more interestingly Southeast Asia is in the second place. This is reflective of the consumer goods industry’s presence in the region.
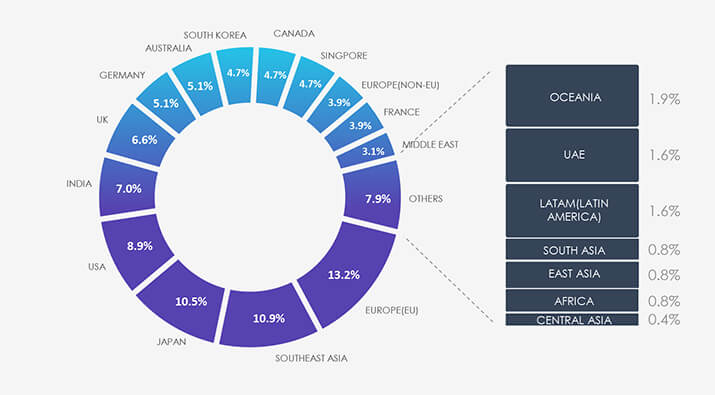
Due to the overlapping nature of monitoring telemetry, further breakdown beyond the top 10 countries is calculated for regions rather than individual countries to maintain clarity.
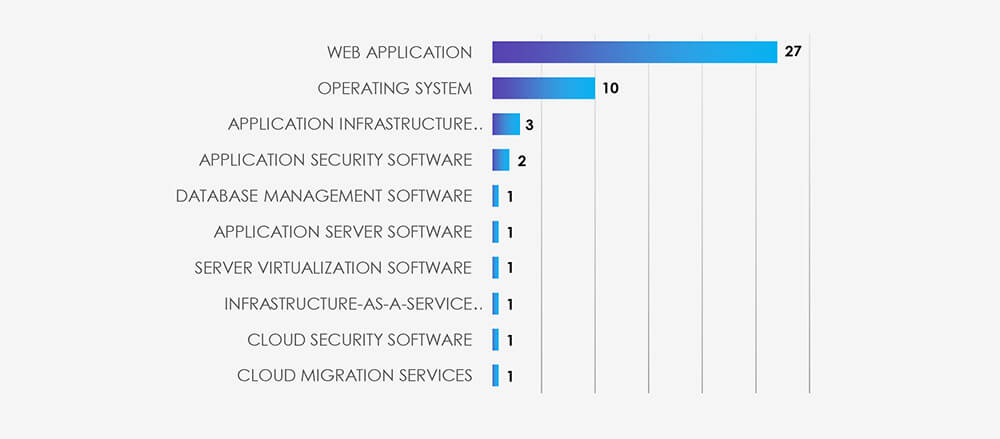
Web applications continue to be the primary target for cyberattacks across all industries, followed by operating systems. Notably, within this industry, there is a relatively high focus on infrastructure, cloud, and virtualization technology. This makes sense considering the nature of many sectors included in consumer goods and services.
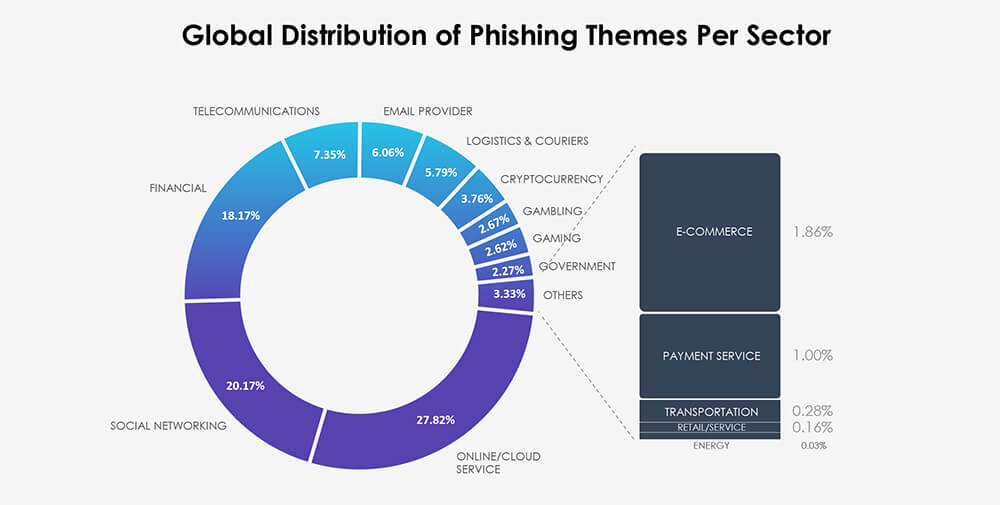
There are numerous phishing attacks that specifically target or impersonate consumer goods and services entities. However, due to the nature of our telemetry and the prevalence of small to medium-sized businesses in this sector, tracking these attacks comprehensively is currently challenging. The nature of this industry does provide compelling spear-phishing opportunities, but our telemetry primarily concentrates on broader phishing campaigns.
Over the past 3 months, CYFIRMA’s telemetry recorded 14,551 phishing attacks out of a total of 203,524, that included or impersonated various consumer goods and services targets.
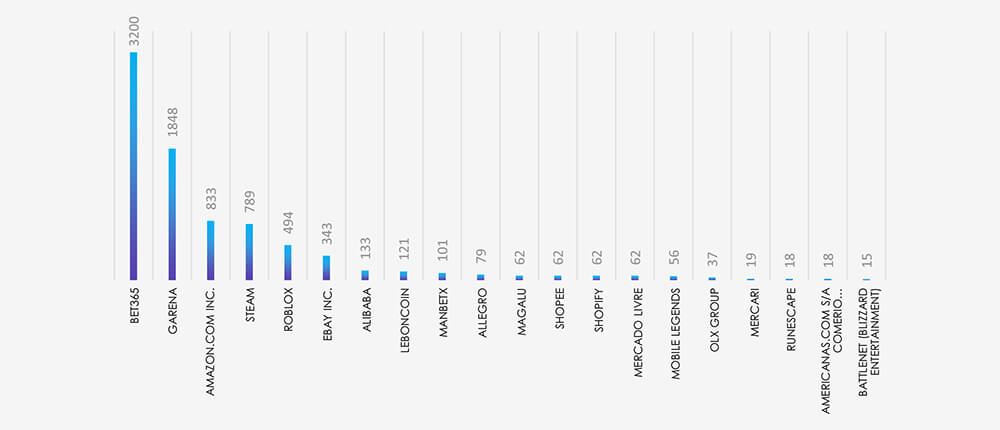
As per the chart below, our telemetry does not track this industry as a whole. Most of the relevant brands classify as Gambling, Gaming or e-Commerce. Together they account for 7.15% of observed attack campaigns.
Top 20 most impersonated brands show a heavy presence on the gambling platform Bet365 and various video gaming brands, along with e-commerce platforms with global presence.
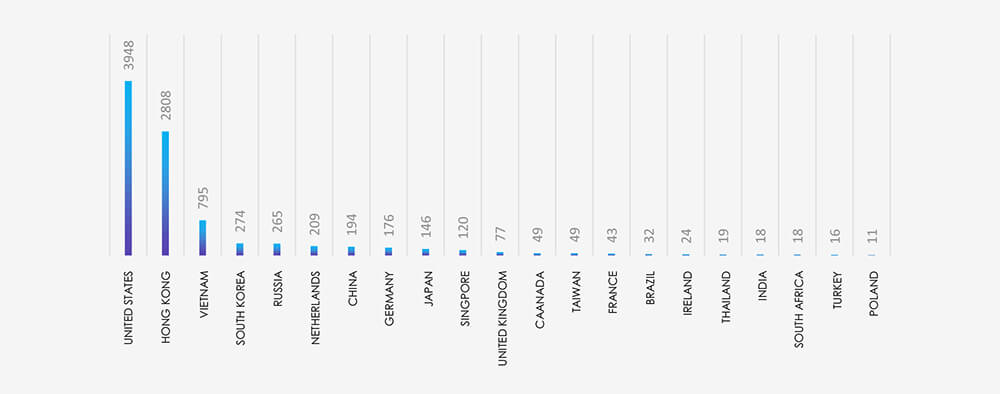
Our ASN Origin-based telemetry for geography data reflects the brands observed. The USA is unsurprisingly in first place as the biggest consumer market and target. However, significant presence of Asian countries mirrors the high volume of gaming brands, which have mainstream popularity in this region.
In the past 90 days, CYFIRMA has identified 126 verified ransomware victims within the consumer goods and services sectors. This accounts for 8% of the overall total of 1,579 ransomware incidents during the same period.
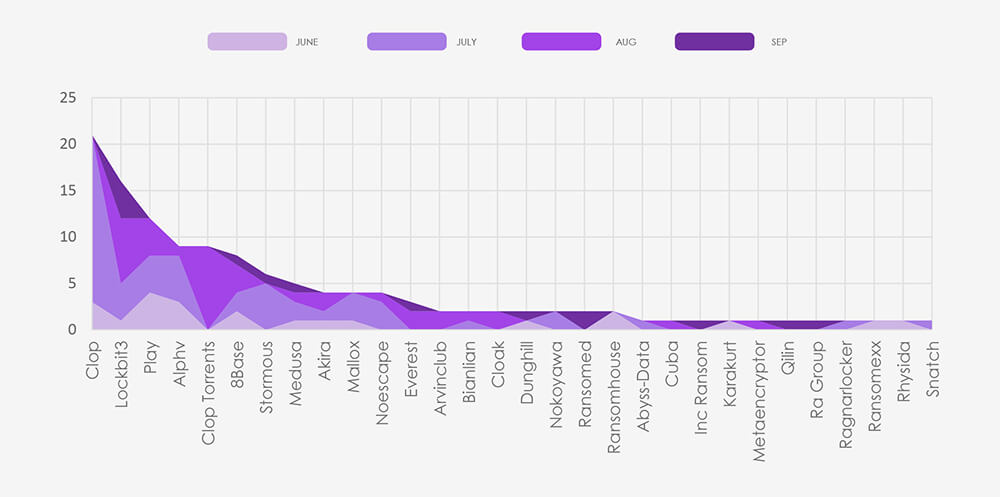
The chart below shows consistently high numbers of attacks with a significant spike in July.

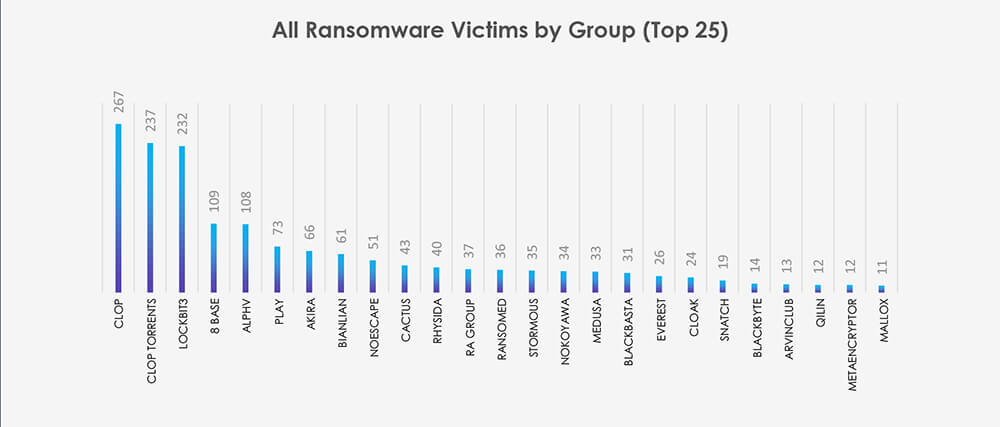
Breaking down the monthly activity by gangs, Cl0p with their July rampage is taking the lead. Combined with Cl0p Torrents, they account for 24% of all victims. Following is Lockbit3 with consistently high numbers and Play along with ALPHV, which were both very active in July.
The subsequent chart underscores the dominance of major ransomware gangs, with the top 5 accounting for 59% of all victims. Simultaneously, the chart illustrates how the collective activity of smaller groups contributes to a substantial number of victims.
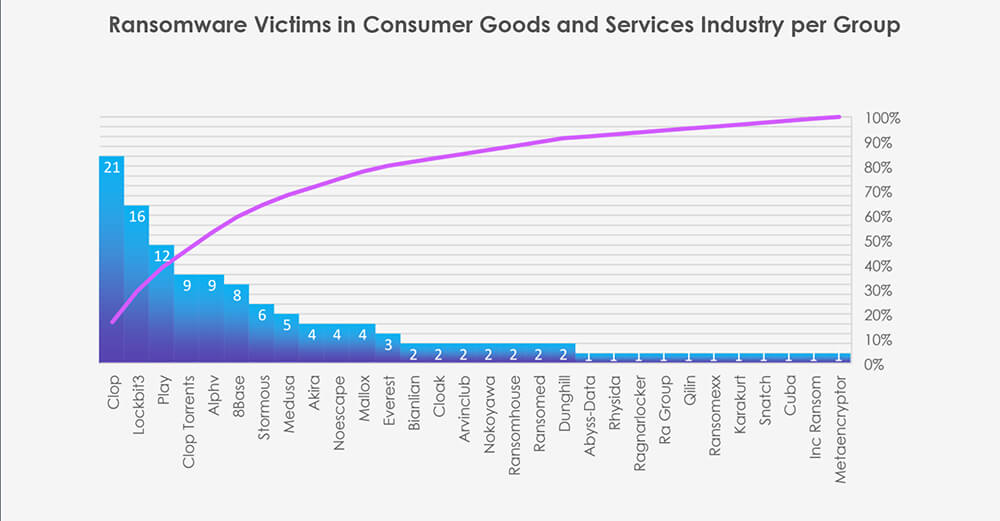
From 45 gangs active in the past 90 days, 30 recorded verified consumer goods and services victims. This is a significantly higher number compared to other industries. Average gang participation is between 12-15 for industry. We attribute this to a high volume of smaller size victims attacked by smaller and more opportunistic gangs.
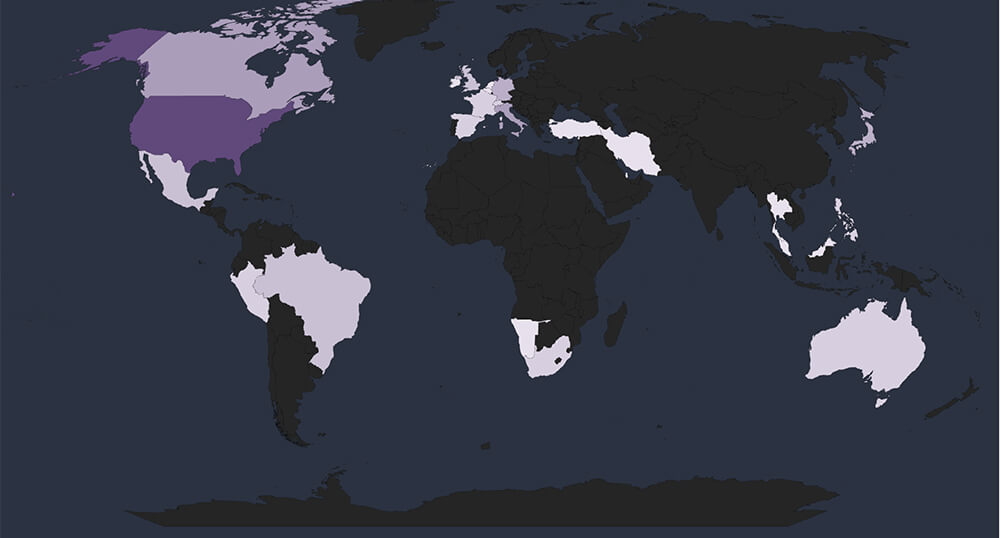
Global Spread – Out of the 115 victims with identified geography, the United States emerges as the most affected with 65 victims. Followed by Canada, Italy, Germany and Japan.
Together, the Top 5 countries account for 72% of all victims with identified geography.
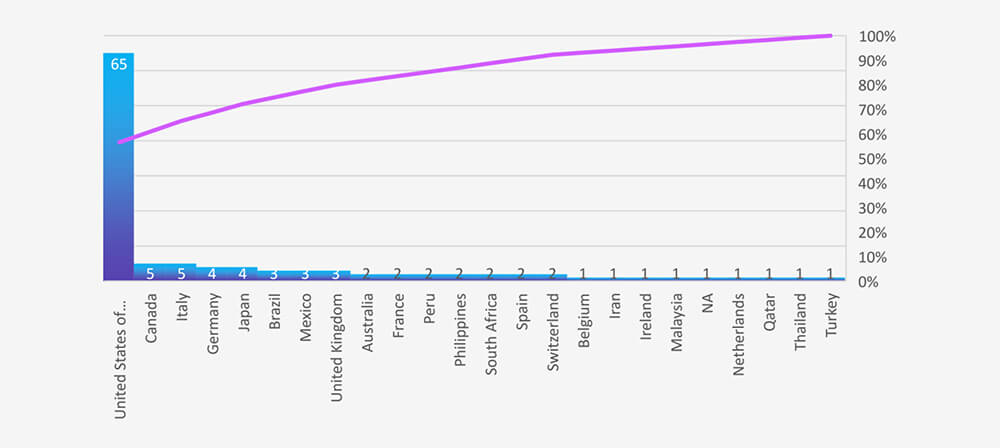
Geographical Vulnerability – The distribution of victims serves as a reminder that no region is exempt from ransomware threats. Cyber attackers have the capability to breach and target vulnerable organizations globally. This trend indicates that many threat actors prioritize exploiting vulnerabilities within organizations, regardless of their geographical locations.
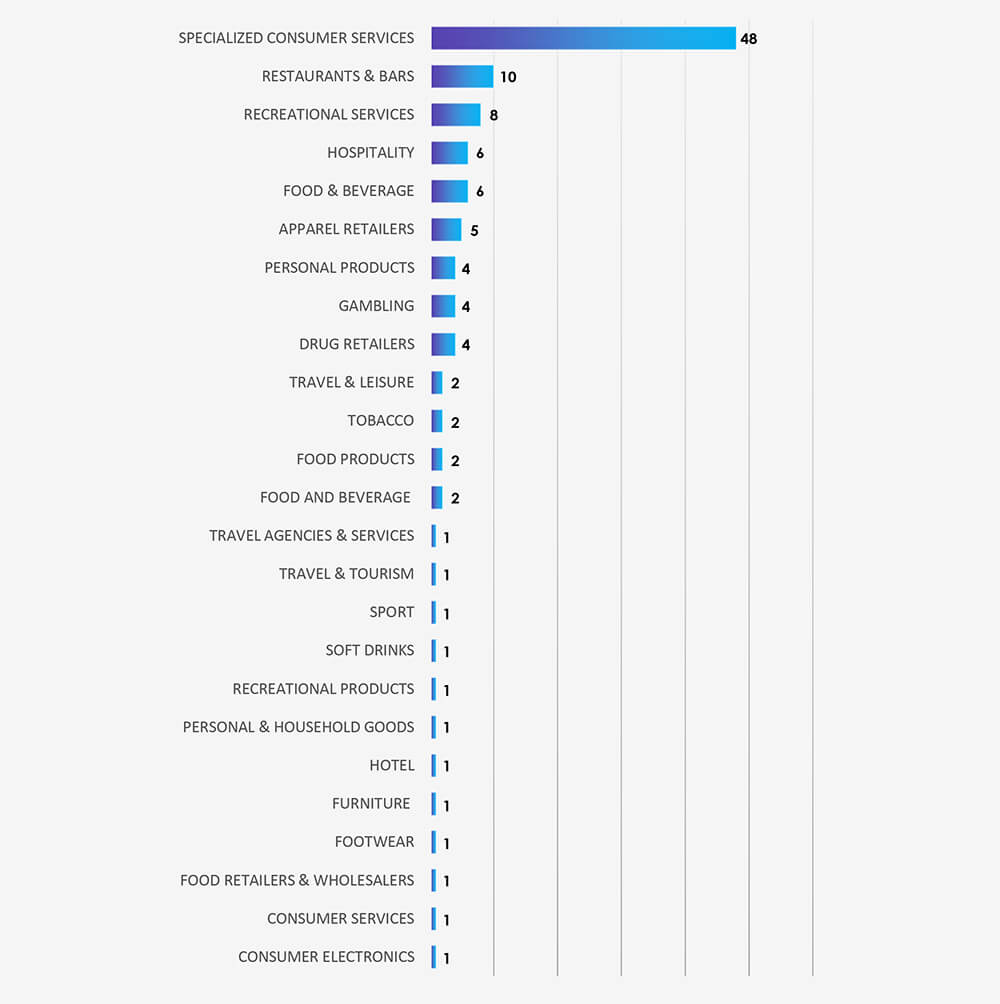
Sectors Distribution: The chart below illustrates the distribution of ransomware incidents over the past 90 days.
The highly diversified nature of the consumer goods and services industry does translate into highly diversified threats and threat actors. The high volume of European-based APT victims correlates with the European SME/Contractors market composition. The relatively high presence of infrastructure, cloud, and virtualization in attacked technologies also reflects the same nature of the victims. The second most attacked region by APTs is Southeast Asia, which reflects the region’s recent growth in this specific sector.
Consumer goods and services businesses present great spear-phishing lure but aren’t well suited for “spray and pray” kinds of campaigns. Most impersonated brands in this industry were Gambling, Gaming and e-Commerce. Notably, our telemetry shows a heavy focus on Asia with gaming-themed phishing.
In ransomware data, we also see a very diverse range of groups. 45 different ransomware gangs were recorded as consumer goods and services victims in the past 90 days. Most of which were Cl0p and Lockbit3. Most targeted sectors within the industry were specialized consumer services and hospitality, including leisure and restaurants.