
The CYFIRMA Industries Report delivers original cybersecurity insights and telemetry-driven statistics of global industries, covering one sector each week for a quarter. This report focuses on the information technology industry, presenting key trends and statistics in an engaging infographic format.
Welcome to the CYFIRMA infographic industry report, where we delve into the external threat landscape of the information technology industry over the past three months. This report provides valuable insights and data-driven statistics, delivering a concise analysis of attack campaigns, phishing telemetry, and ransomware incidents targeting the information technology organizations.
We aim to present an industry-specific overview in a convenient, engaging, and informative format. Leveraging our cutting-edge platform telemetry and the expertise of our analysts, we bring you actionable intelligence to stay ahead in the cybersecurity landscape.
CYFIRMA provides cyber threat intelligence and external threat landscape management platforms, DeCYFIR and DeTCT, which utilize artificial intelligence and machine learning to ingest and process relevant data, complemented by manual CTI research.
For the purpose of these reports, we leverage the following data from our platform. These are data processed by AI and ML automation based on both human research input and automated ingestions.
While this report contains statistics and graphs generated primarily by automation, it undergoes thorough review and enhancement for additional context by CYFIRMA CTI analysts to ensure the highest quality and provide valuable insights.
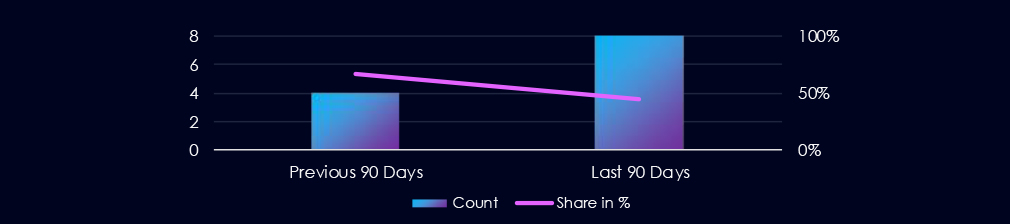
Information technology industry over past 90 days featured in 8 out of the 18 observed campaigns, which is a presence in 44% of all campaigns. That is increase from 4 in previous 90 days, however a decline in overall share from 67% (4 out of 6).

July has witnessed most of the campaigns, which have been preceded by sustained activity in May and June.
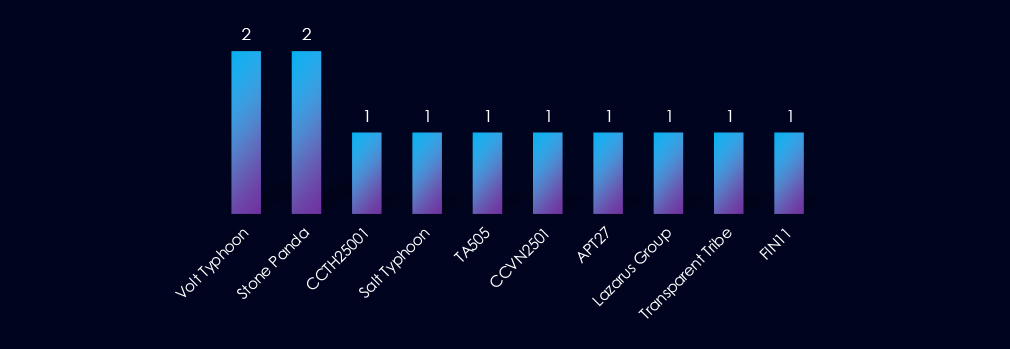
Active threat actors come from many corners of the world: Chinese Volt Typhoon and Stone Panda, Russian TA505 and FIN11, Vietnamese and Thai cybercriminals, or Pakistani Transparent Tribe.
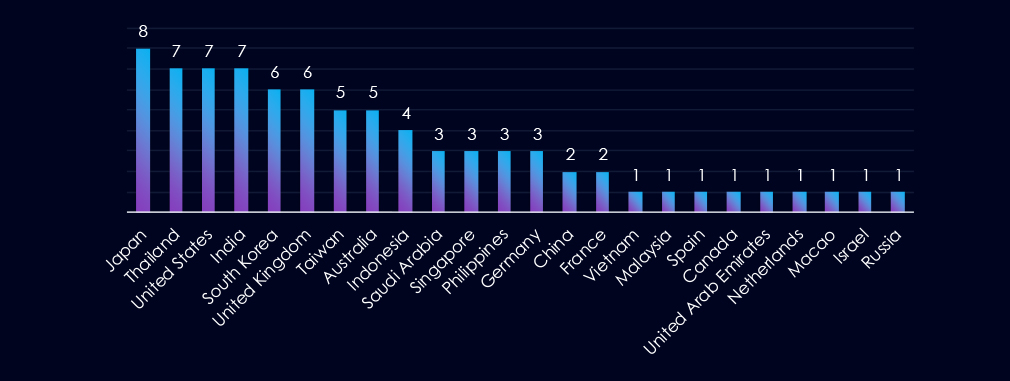
Japan is leading the chart with presence in 8 out 8 observed campaigns. At shared second place are Thailand, the USA and India. South Korea and the UK share third place.
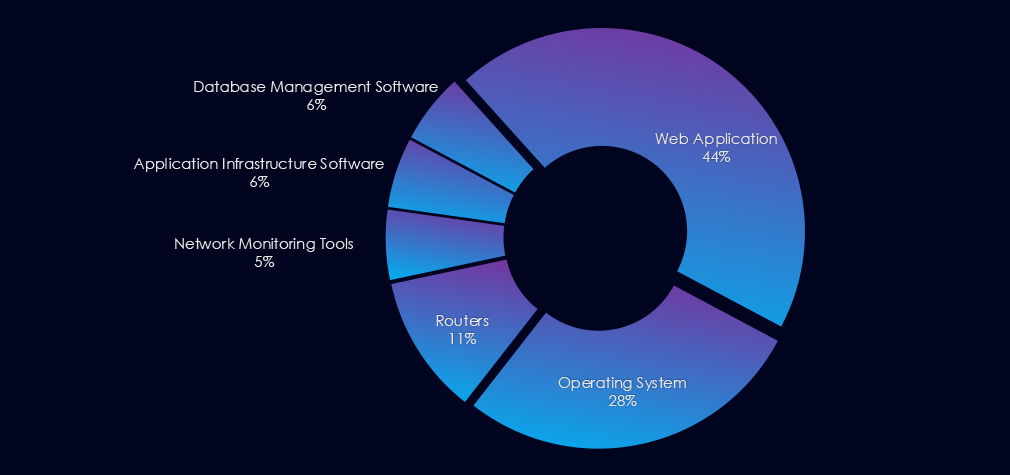
8 out of 8 campaigns used Web Application as primary attack vector. 5 exploited operating system vulnerabilities. Additionally various network, management and infrastructure software was observed.

Over the past 90 days, the information technology industry has been significantly affected by advanced persistent threat (APT) campaigns.
Out of the 18 observed APT campaigns, 8 targeted this industry, representing 44% of the observed campaigns. This is an increase from the previous 90-day period, during which 4 out of 6 campaigns targeted this industry.
Monthly Trends
Key Threat Actors
Active threat actors originate from various regions worldwide. Examples include Chinese Volt Typhoon and Stone Panda, Russian TA505 and FIN11, Vietnamese and Thai cybercriminals, and Pakistani Transparent Tribe.
Geographical Impact
Overall 24 countries recorded victims in observed campaigns. Japan leads the chart with its presence in eight out of oeght observed campaigns. Thailand, the US and India share second place, while South Korea and the UK share third place.
Targeted Technologies
Eight out of eight campaigns employed Web Applications as their primary attack vectors. Five of these campaigns exploited operating system vulnerabilities. Furthermore, various network, management, and infrastructure software was observed.
Over the past three months, CYFIRMA’s telemetry has identified 10,823 mentions of information technology industry out of a total of 59,236 industry mentions. This is from total of 300k+ posts across various underground and dark web channels and forums.
Information technology industry placed 1st out of 14 industries in last 90 days with share of 18.3% of all detected industry-linked chatter.
Below is a breakdown by 30 days periods of all mentions.
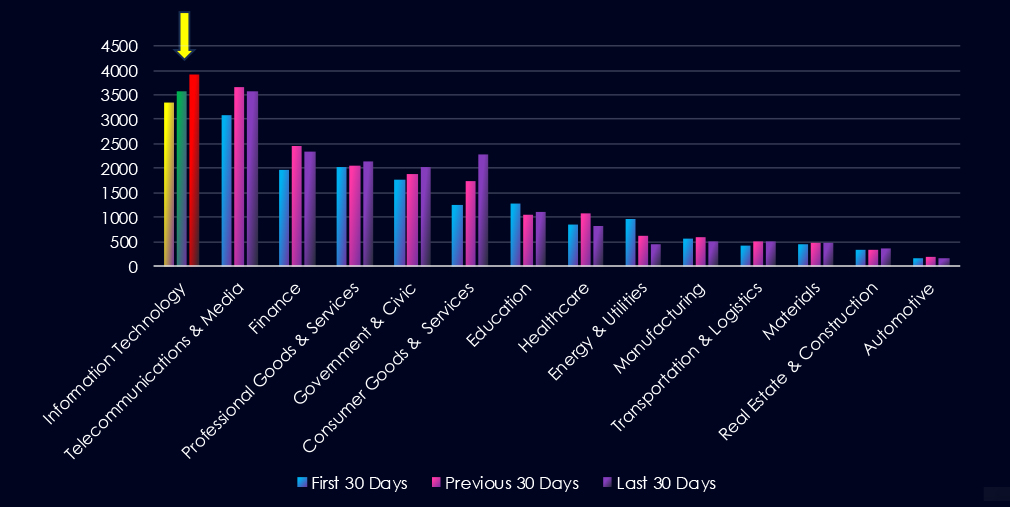
Data Leaks and Data Breaches are by far the most common category of recorded chatter for this industry, gradually growing and showing high sustained interest. Ransomware chatter has mildly surged in last 30 day.

In total, information technology industry comprise 18.3% of all detected industry underground and dark web chatter in the last 90 days. And ranking 1st out of 14 industries.
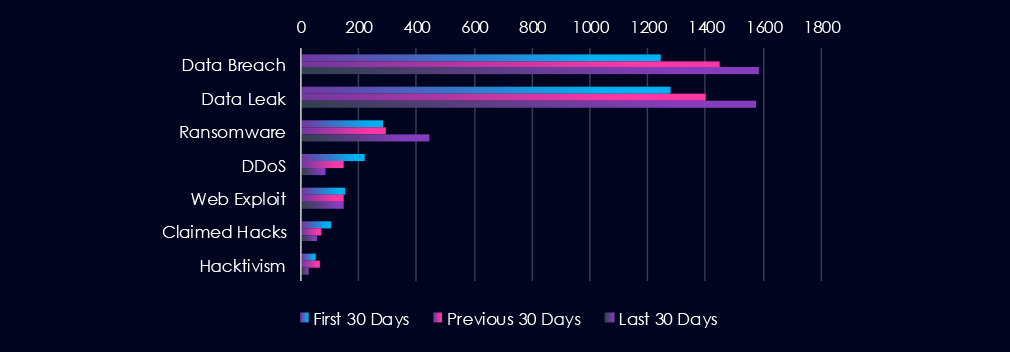
Below are observed key trends across 90 days:
Data Breach
1245 → 1450 → 1587, Consistently high and rising — IT firms remain a prime target for credential theft, code leaks, and customer data compromise.
Data Leak
1278 → 1399 → 1575, Parallels the breach trend, suggesting not only breaches but widespread exfiltration or reselling of data. Likely impacts cloud providers, software vendors, and MSPs.
Ransomware
283 → 295 → 445, Sharp spike in the last 30 days. Indicates a wave of ransomware campaigns targeting IT infrastructure and SaaS providers, possibly leveraging third-party access to downstream clients.
DDoS
222 → 149 → 83, Steady decline, though still notable. May reflect more targeted extortion tactics over broad denial attacks.
Web Exploit
153 → 146 → 147, Stable volume suggests continued exploitation of public-facing IT services, apps, and web infrastructure. Consistent with frequent CVEs in this area.
Claimed Hacks
102 → 69 → 53, Downtrend may indicate fewer public disclosures or quiet, high-value intrusions (e.g., supply chain compromises or stealth access-for-sale listings).
Hacktivism
49 → 65 → 28, Recent drop may signal a shift from ideological attacks to profit-driven activity, or fewer campaign targets in the IT space currently.
Over the past three months, CYFIRMA’s telemetry has identified 894 mentions of information technology industry out of a total of 2,499 industry mentions. This is from over 10k CVEs reported and updated in last 90 days.
Information technology industry ranked 1st out of 14 industries in last 90 days with share of 35.8% of all detected industry linked vulnerabilities.
Below is a breakdown by 30 days periods of all mentions.
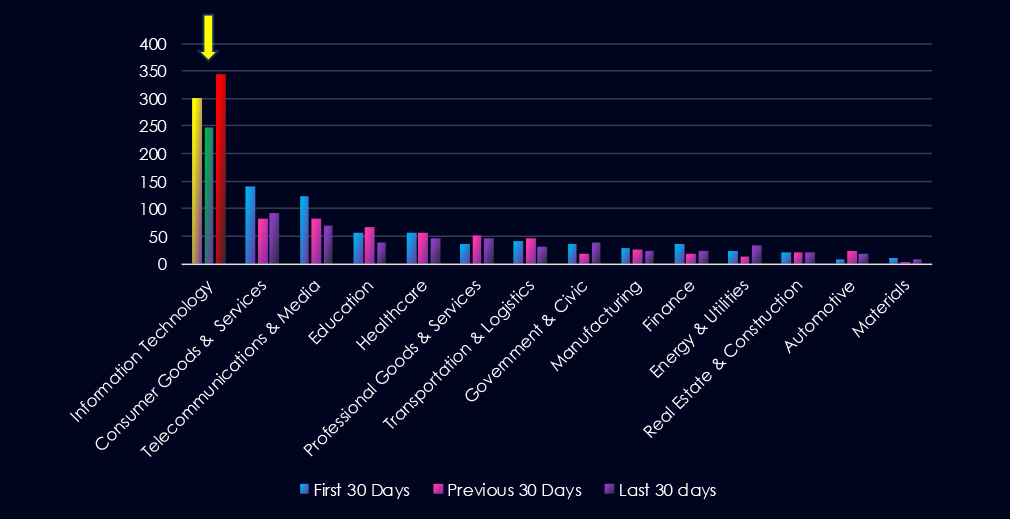
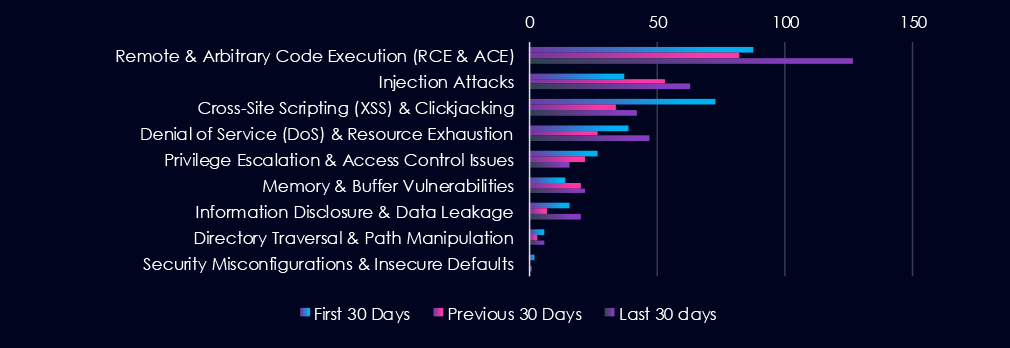
Remote & Arbitrary Code Execution (RCE & ACE), Injection Attack and XSS & clickjacking are leading the chart. Most categories recorded significant uptick in last 30 days.

In total, information technology industry comprise of 35.8% of all detected industry-linked vulnerabilities in the last 90 days. And ranking 1st out of 14 industries.
Below are observed key trends across 90 days.
Remote & Arbitrary Code Execution (RCE & ACE)
88 → 82 → 127 A sharp rise in the latest period suggests increased weaponization of code execution flaws.
Injection Attacks
37 → 53 → 63 Indicates an uptick in SQL, command, and template injection vectors, pointing to improperly sanitized inputs across APIs and applications.
Cross-Site Scripting (XSS) & Clickjacking
73 → 34 → 42 The rebound may reflect renewed focus on client-side vulnerabilities.
Denial of Service (DoS) & Resource Exhaustion
39 → 27 → 47 Surge likely tied to newly discovered flaws in infrastructure services.
Privilege Escalation & Access Control Issues
27 → 22 → 16 Drop may suggest either fewer new privilege bugs disclosed or less visibility into privilege management flaws during this window.
Memory & Buffer Vulnerabilities
14 → 20 → 22 Continued presence of memory-related flaws, likely in native codebases, drivers, or low-level services, though not dominant.
Information Disclosure & Data Leakage
16 → 7 → 20 Jump suggests increased risk of data exposure via misconfigurations, logging issues, or unintended system behaviours.
Directory Traversal & Path Manipulation
6 → 3 → 6 Modest volume but persistent — typically associated with file access vulnerabilities in web applications and storage systems.
Security Misconfigurations & Insecure Defaults
2 → 0 → 1 Remains infrequent in CVE reporting but is likely underrepresented. Real-world exploitation may still be significant, particularly in cloud environments.
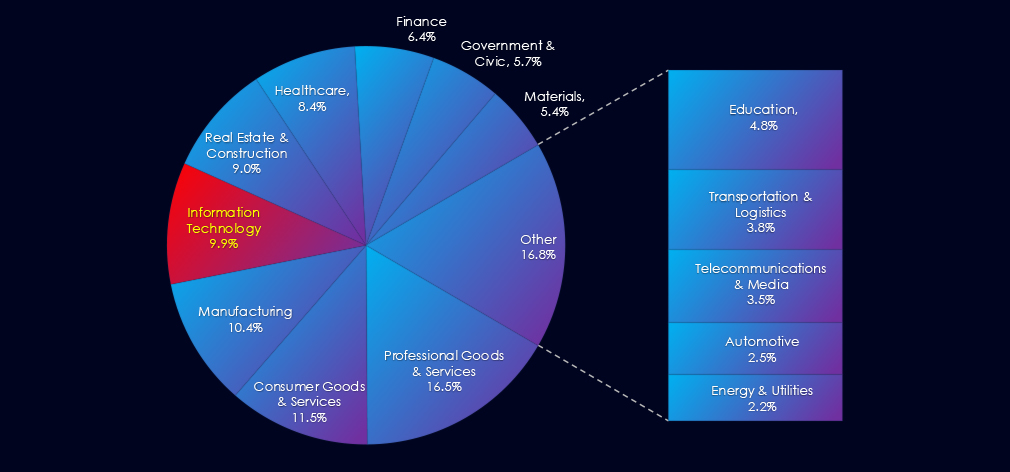
In the past 90 days, CYFIRMA has identified 140 verified ransomware victims in information technology industry. This accounts for 9.9% of the overall total of 1,417 ransomware victims during the same period. Placing the IT industry 4th out of 14 industries.
Furthermore, a quarterly comparison reveals a drastic drop in victims in the IT industry, with a reduction of -48% from 268 to 140 victims. The overall share of victims also dropped from 13% to 9.6% of all victims.
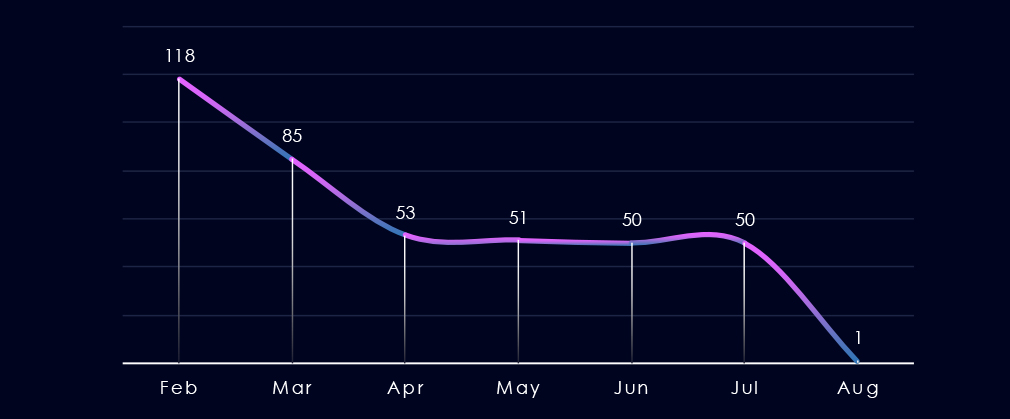
Over the past 180 days, numbers of victims have dropped from January to April and then remained remarkably sustained around 50 victims each month until end of July.
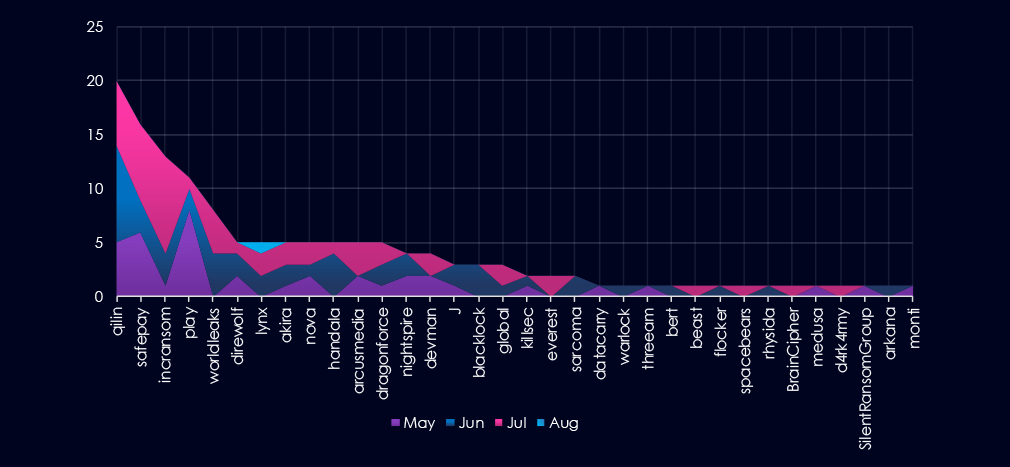
A breakdown of monthly activity per gang provides insights into which gangs were active each month. For example, by far the most active gang Qilin was active evenly across months. On the other hand, third most active gang Incransom recorded most victims in July. Conversely fourth most active gang Play contributed mostly in May.
This illustrates that even with remarkably even numbers of victims over time, different groups are being active.
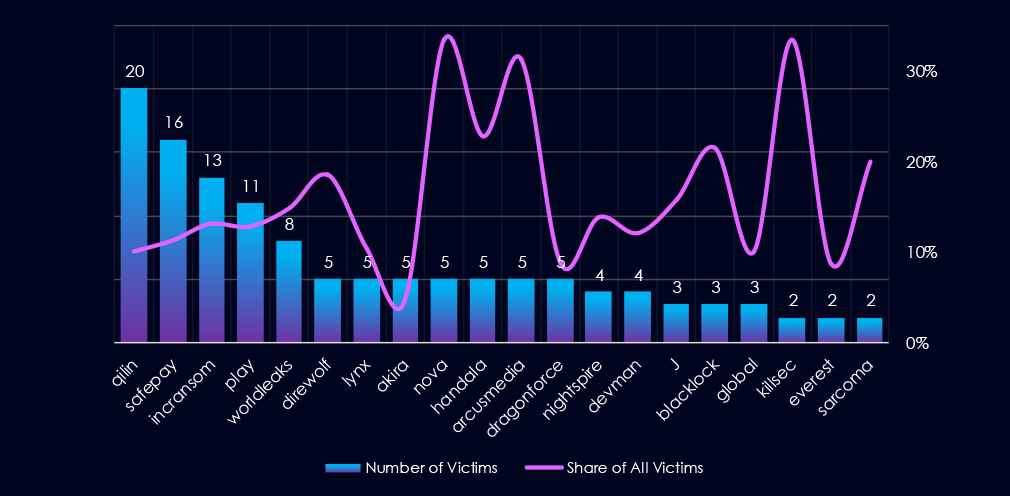
Out of the 73 gangs, 34 recorded victims in this industry in the last 90 days (47% participation). Qilin had the highest number of victims (20) with high share (10.1%).
The share of victims for most gangs in this industry is relatively high. From the top 10, only one gang recorded a share below 10% – Akira (4.7%).
Incranosm (14.8%, 13 out of 99), Nova (33%), and Arcusmedia (31%) had the highest share of victims; implying high focus on this industry.
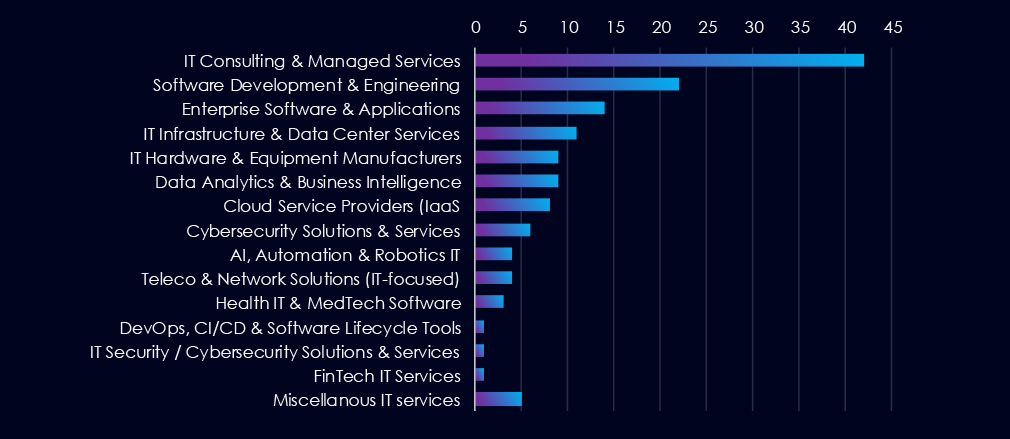
IT Consulting & Managed Services are the most frequent victims of ransomware in this industry. Distant second place are Software Development & Engineering companies.
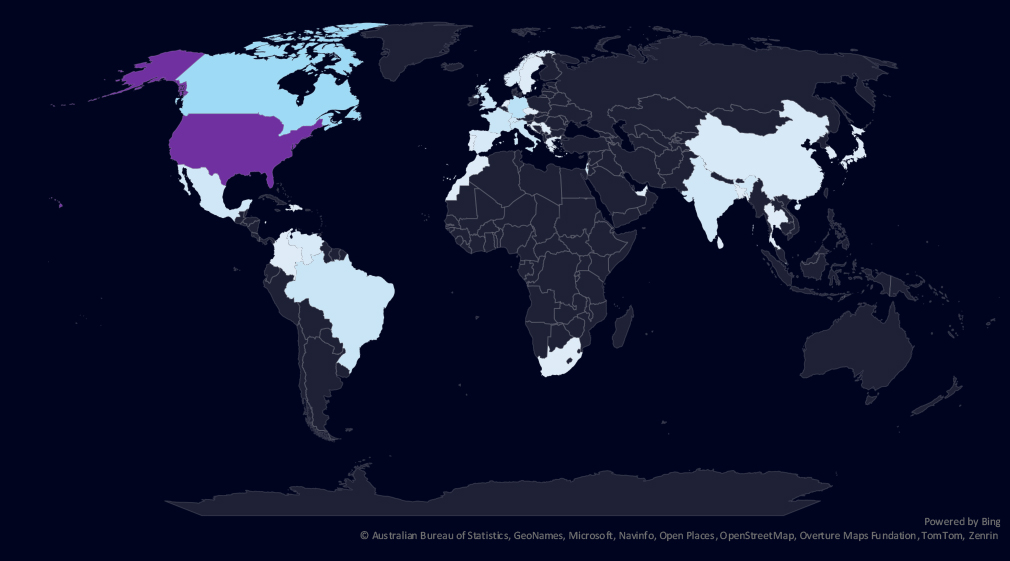
The geographic distribution heatmap underscores the widespread impact of ransomware, highlighting the countries where victims in this industry have been recorded in last 90 days.
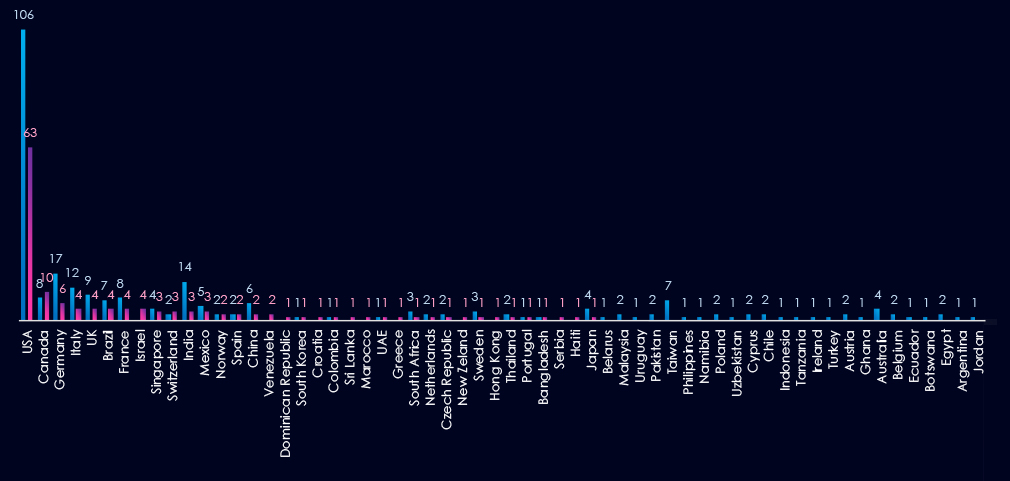
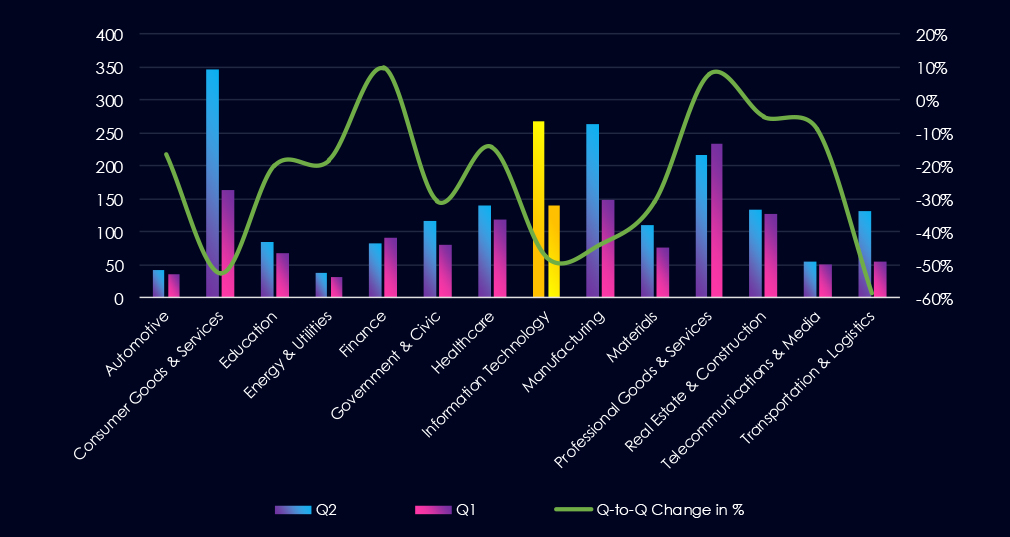
Chart shows quarter-to-quarter changes in targeted countries. Data is sorted by the last 90 days and compared to the previous 90 days, marked in blue.
In the last 90 days, the USA recorded 63 victims (45% of all victims). Canada and Germany follow in second and third place. Germany, Italy, India and Taiwan recorded significant drops from previous 90 days period.
Many countries from previous 90 days did not record new victims at all.

Information technology industry placed 4th out of 14 monitored industries recording 140 victims in last 90 days. Drastic decrease of -48% from 268 victims in previous 90 days period.
Overall share also declined from 13% to 9.6% of all ransomware victims.
Monthly Activity Trends
Monthly activity trends show sharp drop from February of 118 to March 85 and April 53. Then until July we saw remarkably stable number of victims (51, 50, 50)
Ransomware Gangs
A total of 34 out of 73 active ransomware groups targeted the this industry in the past 90 days representing 47% participation:
Qilin: The most active with 20 victims and 10.1% (20 out of 199) of all their victims.
Incransom: Third most active with 13.1% (13 out of 99) share.
Nova, Arcusmedial: Highest shares of 33% (5 out of 15) and 31% (5 out of 16) victims among top gangs. Suggesting high focus on this industry.
Geographic Distribution
The geographic distribution of ransomware victims is relatively high yet quite concentrated in the USA* which accounts for 45% of all victims.
Notably previously heavily hit countries like Germany, Italy, India or Taiwan recorded significant decline in victims.
In total, 36 countries recorded ransomware victims in this industry in last 90 days, thirteen less than 49 in previous period.
For a comprehensive, up-to-date global ransomware tracking report, please refer to our new monthly “Tracking Ransomware” series here.
APT Campaigns (Moderate): 8 of 18 APT campaigns (44%) targeted the IT industry—up from 4 of 6 previously. Activity was sustained across May–July, peaking in July. Key actors included Chinese (Volt Typhoon, Stone Panda), Russian (TA505, FIN11), and Southeast Asian groups (Vietnamese, Thai, Pakistani). Japan was affected in every campaign, followed by Thailand, U.S., India, South Korea, and UK. All campaigns targeted web applications, with five also exploiting OS vulnerabilities and broader infrastructure software.
Underground & Dark Web Chatter (High): The IT sector generated 18.3% of all dark web chatter—ranking 1st. Data breaches (↑27%) and leaks (↑23%) rose sharply, reflecting sustained interest in cloud platforms, software vendors, and MSPs. Ransomware chatter spiked to 445 mentions (↑51%), while DDoS dropped steadily. Web exploit chatter remained steady. Claimed hacks fell, possibly reflecting more covert breaches. Hacktivism dropped, pointing to a shift toward financially driven targeting.
Vulnerabilities (High): The IT industry accounted for 35.8% of all reported CVEs—by far the highest. RCEs surged (127), and injection attacks climbed (63), indicating escalating application-layer threats. DoS (47) and XSS (42) also rose. Memory flaws (22) persisted, while privilege escalation dropped. Directory traversal, disclosure bugs, and misconfigurations remained low but relevant—especially in cloud or multi-tenant environments.
Ransomware (Moderate*): 140 ransomware victims were recorded (↓48%), placing IT 4th overall. Sector share declined from 13% to 9.6%. After a steep drop from February, activity stabilized between May–July. Qilin (20 victims) led activity; Incransom, Nova, and Arcusmedial showed high proportional focus. U.S. accounted for 45% of all victims. A total of 36 countries were affected, down from 49 in the prior period.