

The CYFIRMA Industries Report provides cutting-edge cybersecurity insights and telemetry-driven statistics on global industries. Spanning the last 365 days and highlighting year-over-year changes between 2024 and 2025, this report covers 14 key industries and presents critical trends and data in a compelling infographic format.
This is Part 1 of the report covering only combined industries. If you would like to view the complete report with each industry detailed breakdown, it is available exclusively on our website.
Welcome to the CYFIRMA Infographic Industry Report, where we examine the external threat landscape across 14 industries over the past year. Through clear, data-driven visuals and expert insights, we present concise analyses of attack campaigns, underground and dark web chatter, reported vulnerabilities, and ransomware incidents affecting organizations worldwide.
Leveraging our cutting-edge platform telemetry and the deep expertise of our analysts, this report highlights both cross-industry trends and year-over-year changes, along with detailed, industry-specific breakdowns coming in Parts 2 and 3 soon.
Our goal is to equip you with actionable intelligence that helps you stay ahead in the ever-evolving cybersecurity landscape.
CYFIRMA delivers pre-emptive cybersecurity, cyber threat intelligence, and external threat landscape management through its platforms, DeCYFIR and DeTCT. These platforms have been purpose-built over many years to continuously collect, correlate, and analyse large volumes of external threat data, combining proprietary intelligence automation with deep, hands-on cyber threat research.
For the purposes of this report, the analysis draws on intelligence generated from CYFIRMA’s platforms. The data referenced has been processed through automated correlation and enrichment mechanisms, informed and validated by human-led research and investigative expertise, and sourced from both structured and unstructured external intelligence channels.
While this report contains data collected and processed by our in-house AI and ML, all charts, statistics, and analyses are done by human CYFIRMA CTI analysts to ensure the highest quality and provide accurate insights.
Annual increase in APT CAMPAIGNS
More APT Threat Actors
Data Leak and Data Breach Underground & Dark Web posts in 2025
Annual increase in RANSOMWARE victims
RANSOMWARE gangs active in 2025
Countries hit by RANSOMWARE in 2025
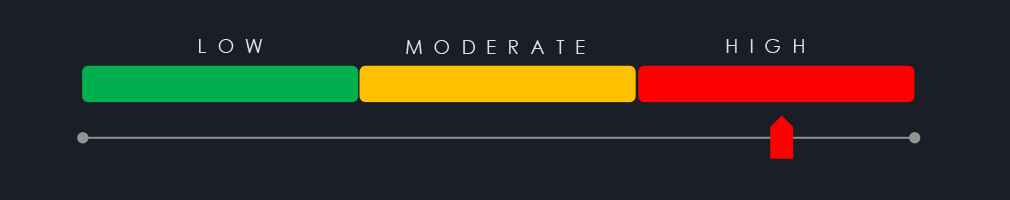
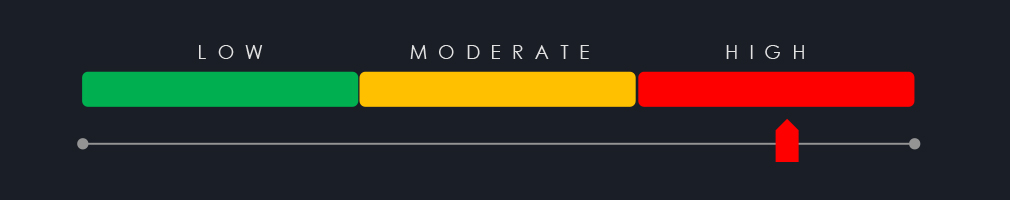
Year-to-Year Elevation: High
In 2023, our DeCYFIR platform recorded 27 campaigns. In 2024, this number grew by 14.8% to 31. And during 2025, by another 26.2% to 42 APT campaigns.

The threat landscape has shifted once again in 2025. Nearly all sectors across the board recorded an increased number of APT activity. The only exception is the Healthcare sector, which recorded a significant decline. IT and Retailers sustained the level of activity from the previous year.
35 countries saw an increase in recorded APT campaigns, while 12 countries saw a decline.
Year-to-Year Elevation: High
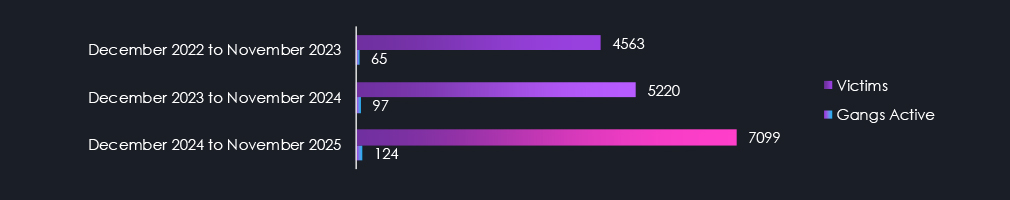
In 2023, CYFIRMA recorded 4,679 verified ransomware victims, while in 2024, the number increased to 5,219, representing a 11.5% year-over-year growth across all industries. 2025 showed even further growth to a new all-time high of 7,099 victims and 36% year-over-year jump.

Apart from Healthcare and Professional Goods & Services, which recorded nearly identical numbers of victims as in 2024, every other industry experienced a significant increase in victims. Materials, Transportation & Logistics, and Automotive are seeing the highest elevations.
The number of countries with recorded ransomware victims grew from 125 to 138 year-over-year. Below are the top 35 and their respective annual changes. South Korea, Singapore, Thailand, Colombia, and Turkey recorded some of the highest elevations.
YEAR-OVER-YEAR ELEVATION
In 2023, the DeCYFIR platform recorded a total of 27 campaigns. Meanwhile, in 2024, it recorded 31, representing a 14.8% increase year-over-year. Now in 2025, we have seen further growth to 42 campaigns and 35.5% year-over-year growth.
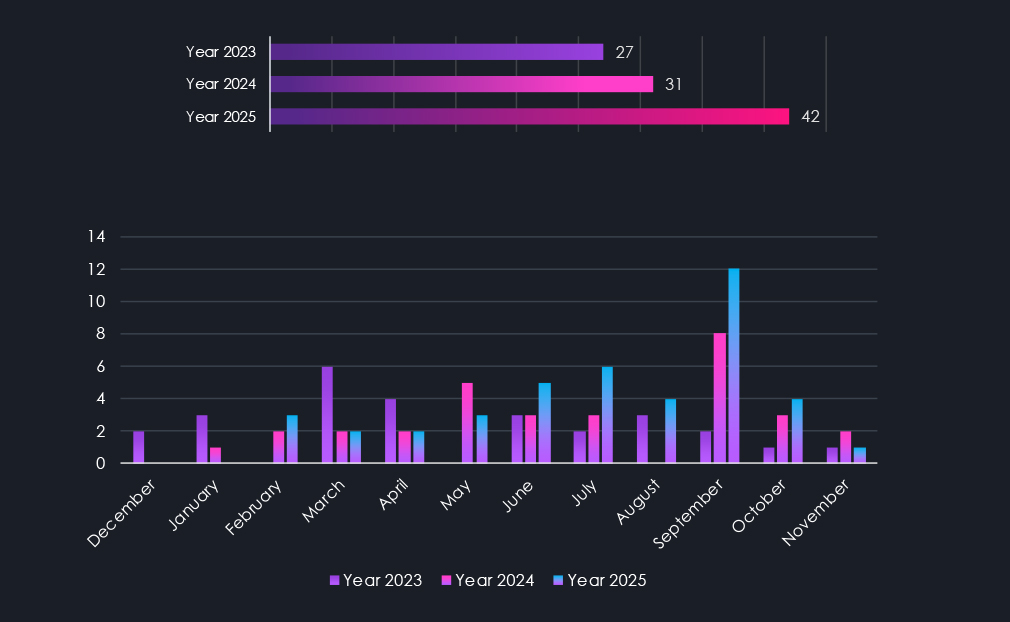
The monthly chart illustrates the frequency of observed campaigns. We can observe periods of relative tranquility as well as periods with significant spikes in activity.
While we acknowledge the collection bias introduced by updating campaigns over time, which may cause some detections to accumulate towards the later months of the year, there is still a discernible trend. November to January appears to be a calmer period for APT detections, with the spring months regaining momentum towards summer and autumn.
Alongside the increase in observed campaigns, we also noticed a growth in observed threat actors. In 2023, the detected APT campaigns were linked to 15 threat actors. In 2024, this number surged by 66% to 25 groups. In 2025, 33 threat actors were recorded in total, representing another 32% increase.
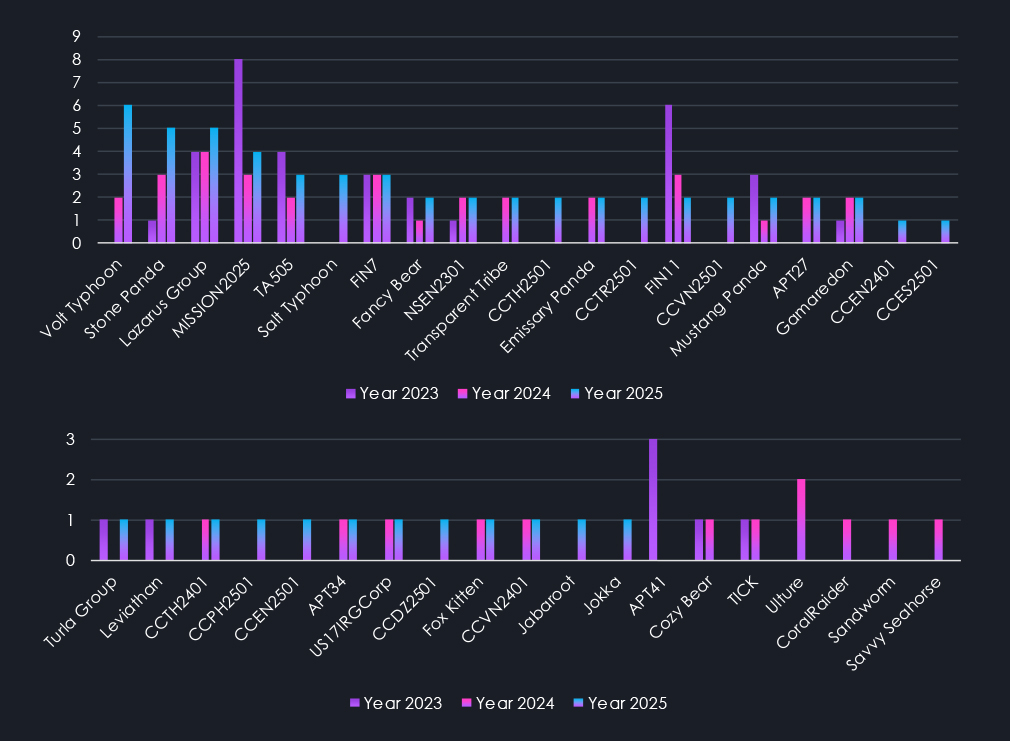
The charts above show activity by respective threat actors across the last three years, sorted by observed campaigns in 2025.
Notably, we see various regional cybercrime groups tracked as CC|country code|Year First observed. Among the most prominent are the Thai-speaking group CCTH2501, the Turkish-speaking CCTR2501, and the Vietnamese-speaking CCVN2501.
Furthermore, suspected English-speaking nation-state threat actor NS2301 has been observed since 2023 and continued to record new activity into 2025.
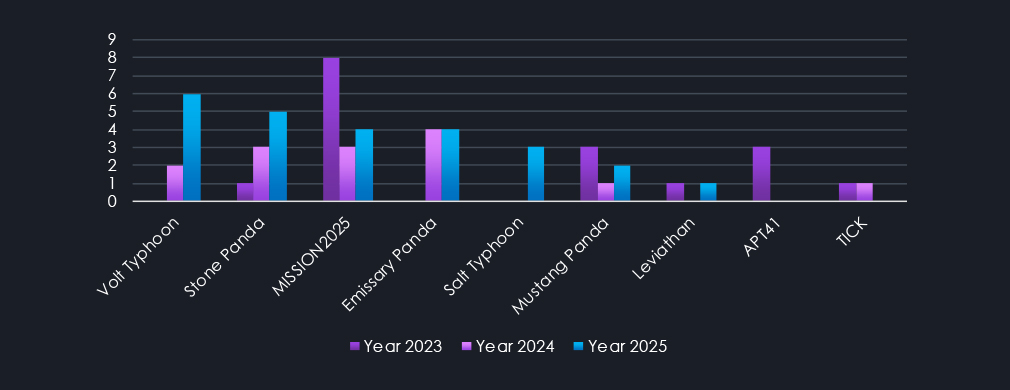
Threat actors’ data analysis shows a notable trend in active China-linked groups. While the APT41, MISSION2025 aka MISSION2074 (APT41 descendants) nexus of activity, and Mustang Panda saw a decrease since 2023, Volt Typhoon, Emissary Panda, and Salt Typhoon replaced the deficit.
APT41: Known for both espionage and financially motivated activities, APT41 is historically linked to China’s People’s Liberation Army (PLA). They have targeted various industries worldwide.
MISSION2025 aka MISSION2074: This is CYFIRMA’s codename for APT41 descendant’s nexus of activity, more specifically, multiple groups using overlapping TTP originally attributed to APT41.
TICK: Also known as Bronze Butler, TICK is a Chinese cyber espionage group targeting East Asian countries, particularly Japan and South Korea. They are linked to China’s People’s Liberation Army (PLA).
Emissary Panda: Also known as APT27, is linked to China’s People’s Liberation Army (PLA). Active since at least 2010, they have targeted sectors such as aerospace, government, and defense.
Volt Typhoon: Active since at least 2021, Volt Typhoon is a Chinese state-sponsored group targeting U.S. critical infrastructure. They employ “living-off-the-land” techniques to evade detection. The group is associated with China’s People’s Liberation Army (PLA).
Mustang Panda: This group is linked to China’s Ministry of State Security (MSS). They have been involved in cyber espionage campaigns targeting various sectors.
Leviathan: Also known as APT40, Leviathan is linked to China’s Ministry of State Security (MSS). They have targeted sectors such as maritime, defense, and healthcare.
Stone Panda: Also known as APT10, this group is linked to China’s Ministry of State Security (MSS). They have targeted various industries globally, focusing on intellectual property and sensitive data theft.
Salt Typhoon: A Chinese state-sponsored group targeting telecommunications sectors. They are associated with China’s Ministry of State Security (MSS).
This suggests to us that both PLA and MSS are reorganizing their cyber units and also equipping them with new tools by which they are tracked and separated from previous name attribution.
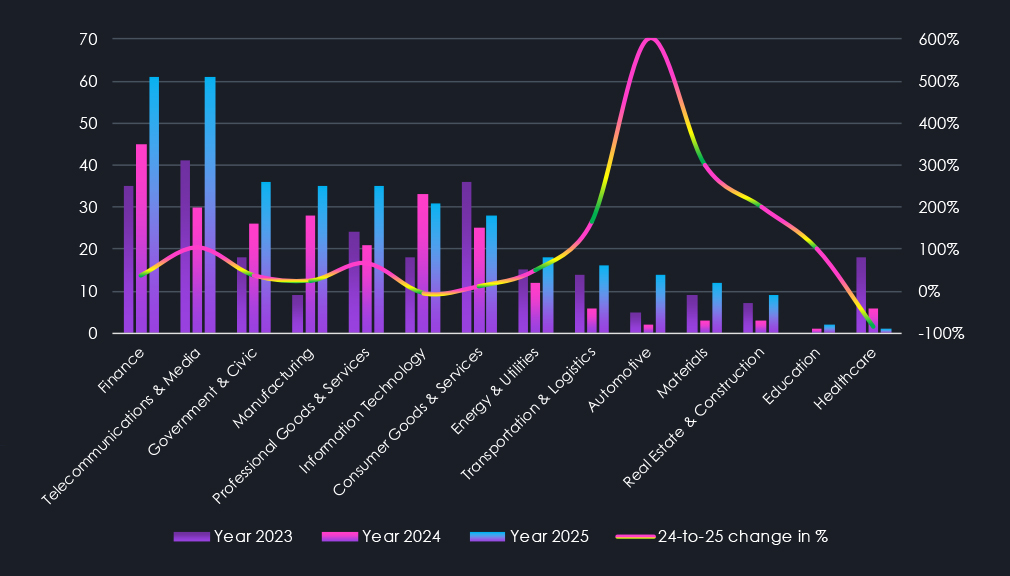
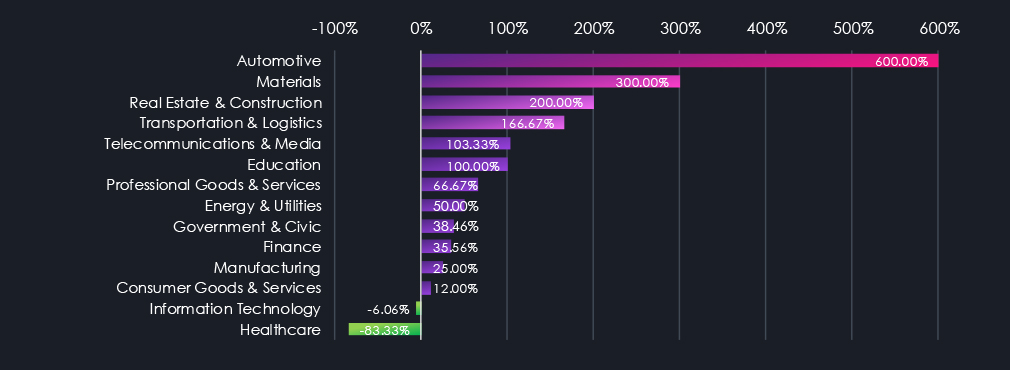
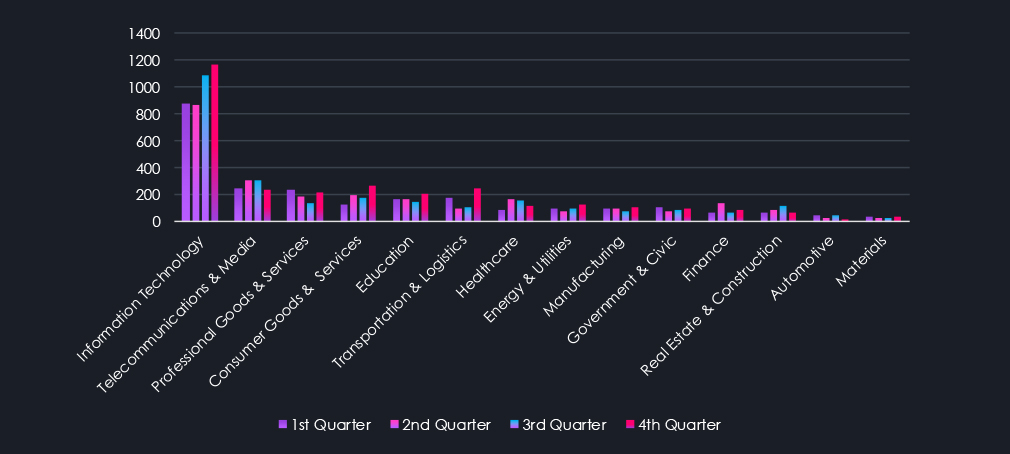
The chart above shows industries sorted by the number of recorded attacks in 2025, from the most frequently targeted to the least. Each bar for the respective industry indicates how many campaigns included victims from that sector in a specific year. The trendline shows percentage changes compared to the previous year.
In 2023, the most targeted industries were Telecommunications & Media, Consumer Goods & Services, and Finance. By 2024, the threat landscape shifted. Finance, Information Technology, and Manufacturing became the top three most targeted industries.
In 2025, the largest increases in attacks appeared in Automotive (+600%), Materials (+300%), and Real Estate & Construction (+200%). Transportation & Logistics (+167), Telecommunications & Media (+103%), and Professional Goods & Services (+67%) also recorded notable increases.
While nearly all industries recorded an elevation, Healthcare targeting declined by -83%. The only other industry with, albeit minor, decline is Information technology (-6%).
The case of the automotive industry is interesting as it has declined significantly in the previous year, with only a few traditional automotive companies targeted; however, 2025 saw a resurgence, specifically targeting EVs and related technology.
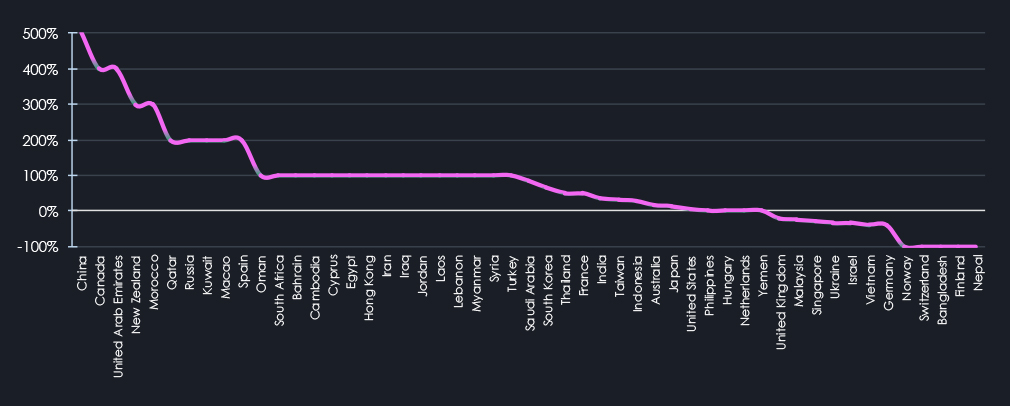
Data on the geographical distribution of attacks reveals an evolving global threat landscape. The number of affected countries increased from 30 in 2024 to 46 in 2025. As the number of countries affected grew, so did the distribution and intensity of the incidents.
Most of the countries that recorded their first victims in the last three years are located in the Middle East and Southeast Asia. Many Asian countries, including India, South Korea, Taiwan, Thailand, and Indonesia, showed heightened activity, indicating a growing regional focus. This focus may be linked to the expansion of digital infrastructure and geopolitical factors.
Furthermore, Australia, the Kingdom of Saudi Arabia, Canada, the United Arab Emirates, and China also saw increases in attack campaigns.
On the other hand, the UK, Singapore, Vietnam, Germany, Malaysia, and the Czech Republic recorded the most notable declines in APT targeting.
Malware and tactics, techniques, and procedures (TTPs) observed in recorded campaigns mostly follow the trend of the previous year. Specifically, there’s a growing use of commodity malware, but also an increase in custom and unique TTPs. Despite sounding contradictory, this combination makes a lot of sense in context. It follows how these tools are being used and how they’ve evolved.
It aligns with the increasing sophistication and capabilities of commodity tools, as well as the use of living-off-the-land techniques that leverage existing system tools. This combination allows threat actors to effectively use well-functioning common tools for heavy lifting and adapt on the fly to hide, pivot, and move laterally. They also minimize their footprint and use unique TTPs for attribution.
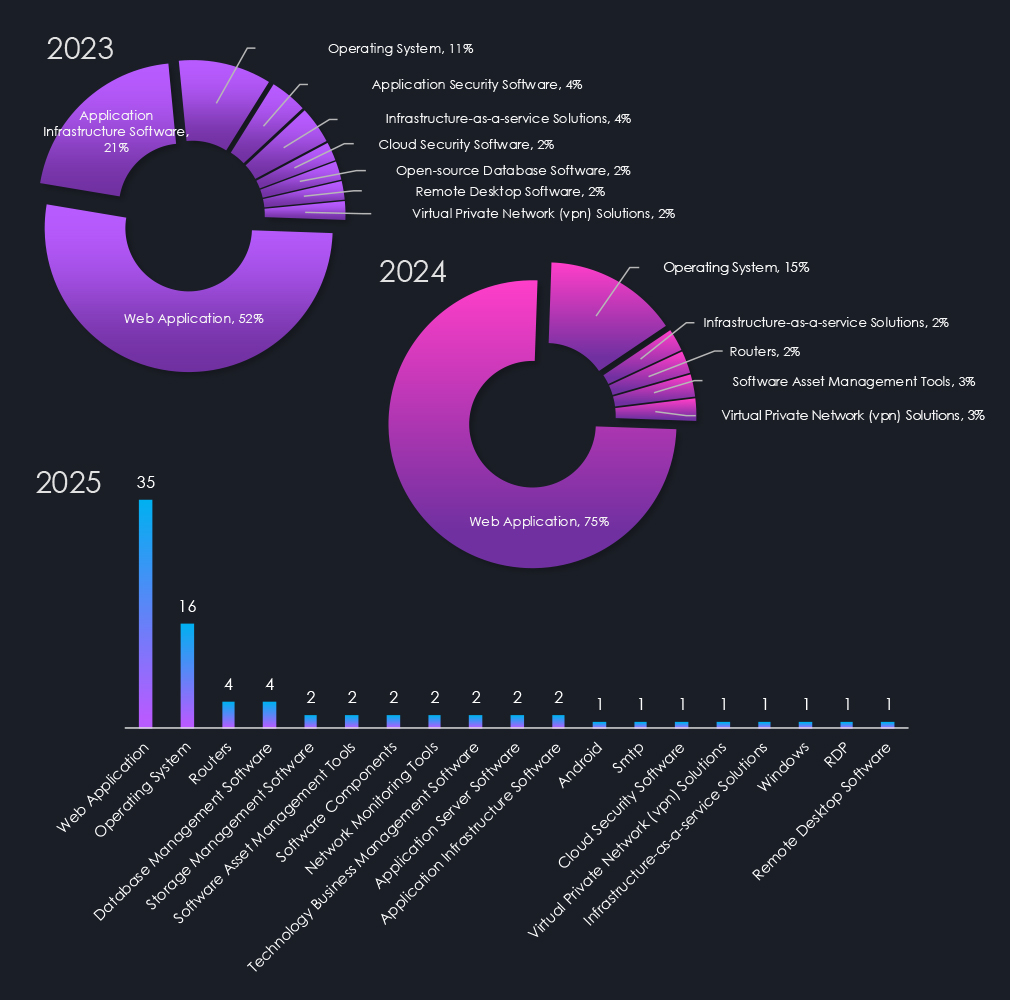
Attacked technologies are a surprisingly volatile statistic. In 2024, the increased reliance on commodity tools and malware was accompanied by a noticeable trend toward more unified attack techniques targeting fewer technologies compared to 2023.
However, in 2025, we have seen an even more diverse range of technologies being targeted than in 2023. While Web Applications and Operating systems remain the most frequent targets, as Web Apps are by their very nature internet-facing and operating systems are omnipresent on devices. A wide range of management, network, and application software has become increasingly more targeted.
Year-to-Year Elevation: High
APT activity tracked by the DeCYFIR platform continued its upward trajectory in 2025, reaching 42 recorded campaigns. This reflects 35.5 % year-over-year growth and a 55.6% increase compared to 2023, confirming sustained expansion rather than episodic spikes. While collection bias affects monthly visibility, multi-year patterns remain consistent, with reduced activity typically observed from November through January and increased tempo across spring, summer, and autumn.
Campaign growth closely aligns with an expanding set of active threat actors. Observed actors increased from 15 in 2023 to 25 in 2024 and further to 33 in 2025. This reflects both improved detection and genuine diversification. Several regional groups gained prominence in 2025, including Thai-, Turkish-, and Vietnamese-speaking actors, indicating the maturation of localized APT ecosystems.
China-linked activity shows clear signs of reorganization rather than decline. Reduced visibility of groups such as APT41, MISSION2025 aka MISSION2074, TICK, and Mustang Panda was offset by sustained or growing activity from Emissary Panda, Leviathan, Volt Typhoon, Stone Panda, and Salt Typhoon. This pattern suggests structural changes within both PLA- and MSS-linked cyber units, with new tooling and attribution clusters replacing legacy group identities.
Industry targeting shifted notably in 2025. While earlier years were dominated by Telecommunications, Finance, IT, and Manufacturing, 2025 saw sharp increases in Automotive, Materials, and Real Estate & Construction. The Automotive resurgence was driven by renewed targeting of EV technologies following a decline in 2024. Healthcare and, to a lesser extent, Information Technology were the only sectors to record declines.
Geographically, APT campaigns expanded in both reach and distribution. The number of affected countries rose from 30 in 2024 to 46 in 2025, with growth concentrated in Southeast Asia and the Middle East. Several Asia-Pacific countries, along with Australia, Saudi Arabia, the UAE, Canada, and China, recorded increased activity. In contrast, declines were observed in parts of Europe and Southeast Asia, including the UK, Germany, Singapore, Vietnam, and Malaysia.
Tradecraft in 2025 continued to use commodity malware and increasingly customized TTPs. Threat actors relied on mature off-the-shelf tools for scale while using living-off-the-land techniques and unique methods for evasion and attribution management. Attacked technologies also diversified beyond web applications and operating systems into management, network, and specialized enterprise software.
YEAR-OVER-YEAR ACTIVITY
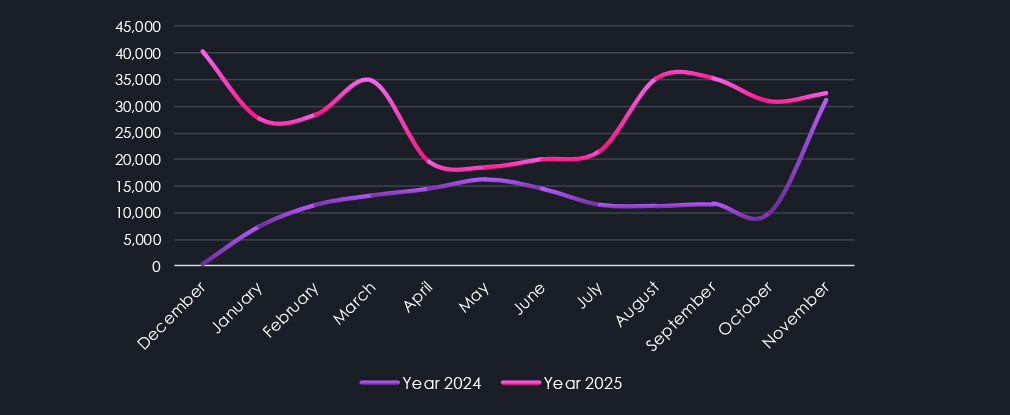
Over the past 23 months, CYFIRMA’s telemetry has identified 498,414 industry-linked mentions. This is from a total of 2.5 million posts across various underground and dark web channels and forums.
This collection was started at the end of December 2023. And has proven to be somewhat volatile as underground forums and channels are being taken down and re-emerge again.
Despite that, we can see clear trends in growing activity and respective categories across industries.
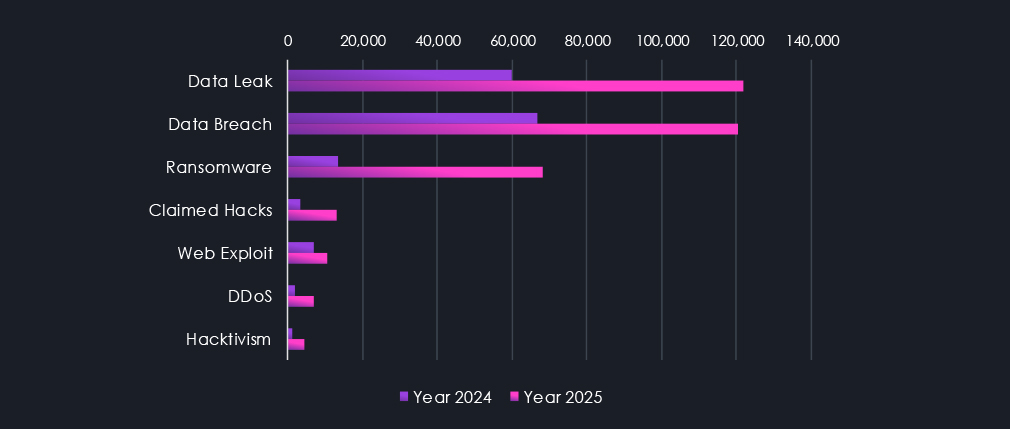
Data leaks and data breaches are among the most frequently mentioned topics in recorded conversations. Ransomware related chatter is firmly in third place. Claimed hacks traded places with Web Exploits discussions, while Denial of Service and Hacktivism represent the smallest, yet not insignificant portion of observed chatter.
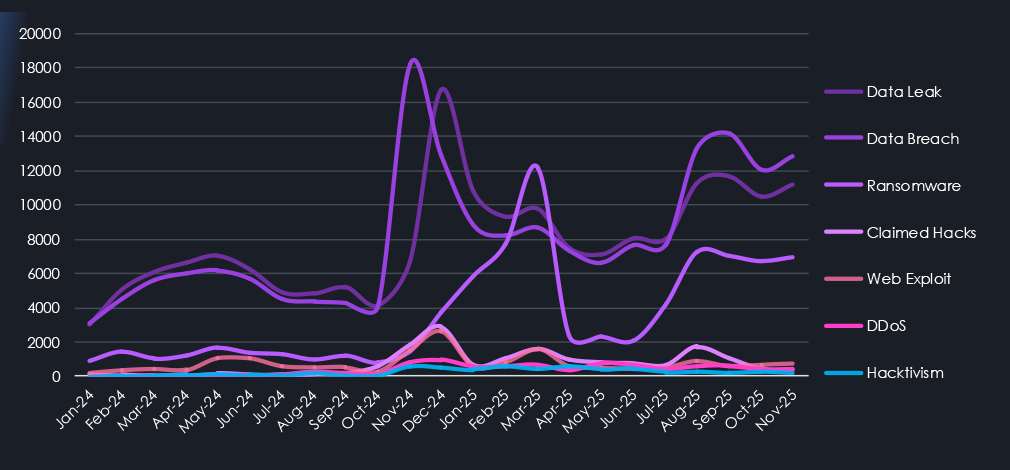
Breaking down individual chatter categories into trendlines over time, we can see that Data Leaks and Data Breaches were most prominent since the start of our collection and exploded during late 2024. Notably, we can see a correlated and delayed relationship between Data Breach chatter and consequent Data Leaks.
The ransomware category jumped up during early 2025, being shut down on many forums and then reappearing gradually at the end of 2025.
Claimed hack and Web Exploits seem to be also correlated in chatter volumes over time.
Finally, Denial of Service is a well-known weapon used by Hacktivist groups, and as such, we can see these two categories correlated in our chart.
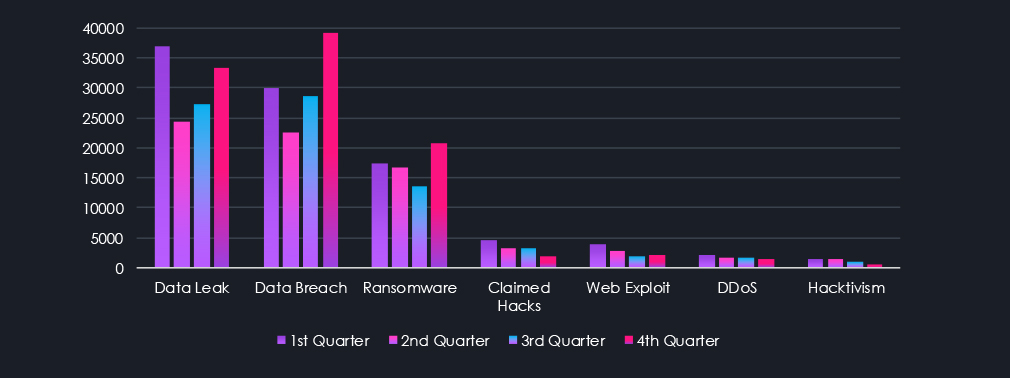
For a cleaner visual interpretation and focused specifically on the year 2025, the chart below shows the quarterly distribution of categories. Top 3 categories of Data Leaks and Breaches with Ransomware chatter are on an upward trajectory into 2026.
The same data is shown below by their respective industry mentions. Year-over-Year elevation is high across industries as both our collection and the overall number of forums and underground channel users grown significantly.
Information Technology and Telecommunications & Media industries are leading the mentions ranking. This is natural, given that discussions are in cyberspace and mostly around activity in cyberspace. Finance is in third place as a substantial amount of chatter revolves around hacking for profit, and finance organizations are the most direct way to steal currency.
Professional B2B Goods & Services, along with Government & Civic organizations, are frequent targets of Data Breaches and Data Leaks due to valuable databases. To a lesser extent, but with the same reasoning, this also applies to Consumer Goods & Services, Education, and Healthcare institutions.
More “offline” industries are least commonly mentioned as they do not present an easy target for most lower-tier actors, who represent the majority of captured chatter.
Throughout the year Elevation: High
Analysis of underground and dark web chatter collected over the past 23 months shows steadily increasing activity despite structural volatility caused by frequent takedowns and re-emergence of forums and channels. Since collection began in late December 2023, CYFIRMA telemetry has captured approximately 2.5 million posts, including 498,414 industry-linked mentions, providing sufficient volume to identify trends beyond short-term disruptions.
Data leaks and data breaches dominate underground discussions by a wide margin, consistently accounting for the largest share of observed chatter. Both categories intensified sharply in late 2024, with a clear delayed correlation between breaches and subsequent data leak discussions, reflecting common monetization and exposure workflows. Ransomware-related chatter remains the third most prominent category, showing a noticeable surge in early 2025, followed by suppression across multiple forums and a gradual re-emergence toward the end of the year.
Other categories show logical alignment over time. Claimed hacks and web exploit discussions track closely, reflecting their relationship and overlap, while denial-of-service chatter correlates strongly with hacktivism activity. Although these categories represent a smaller share of total volume, they remain persistent and operationally relevant.
A focused view of 2025 confirms that data leaks, data breaches, and ransomware chatter are trending upward into early 2026.
Industry-level analysis shows strong year-over-year growth in mentions across nearly all sectors, driven by both expanding collection coverage and increased underground participation. Information Technology and Telecommunications & Media dominate discussion volumes, reflecting the cyber-centric nature of underground ecosystems. Finance remains a primary focus due to its direct monetization potential, while Professional B2B Services and Government & Civic organizations are frequently discussed in the context of large-scale breaches and high-value datasets. Education, Healthcare, and Consumer Goods & Services follow similar patterns at lower volumes.
Industries with limited digital exposure or complex physical operations appear least frequently in chatter, underscoring that most underground activity is driven by lower-tier actors seeking accessible targets rather than high-complexity intrusions.
Overall, underground and dark web chatter data reinforces trends observed in incident-based telemetry. The ecosystem continues to grow in volume and specialization, with data exposure and monetization remaining central drivers. Despite the instability of the underground channels, the persistence and expansion of these discussions indicate a maturing and resilient underground cybercrime economy.
YEAR-OVER-YEAR ACTIVITY
Utilizing similar technology and approach as for underground and dark web chatter monitoring, we can analyze reported CVEs and find industry-linked vulnerabilities.
In 2024, we have identified 8,726 vulnerabilities linked to industries. Last year, this number grew slightly to 10,533, acknowledging an extra month in scope.
Monthly trends are mildly elevated from 2024, but mostly stable on average. We can account for the growing number of CVEs to the natural growth of technology and its penetration into previously less tech-dependent industries, including IoT devices and connected machinery.
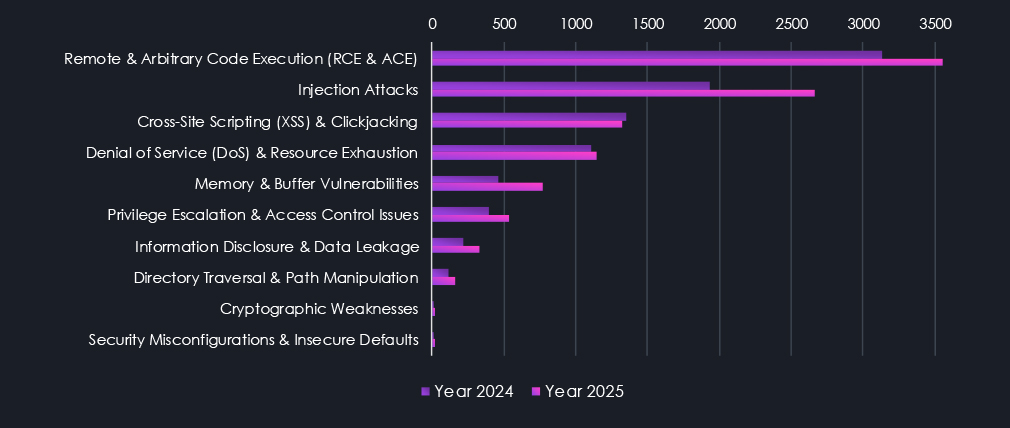
Remote & Arbitrary Code Execution (RCE & ACE) is the most prominent category of identified CVEs linked to industries. Though again, we need to acknowledge that they are also frequently updated CVEs, which inflate this number somewhat. However, the collection logic applies to all other categories, leveling the bias.
Injection Attacks are the second most frequent category and showed the highest increase year-over-year. Another notable category is Memory & Buffer vulnerabilities, also showing a significant jump during 2025.
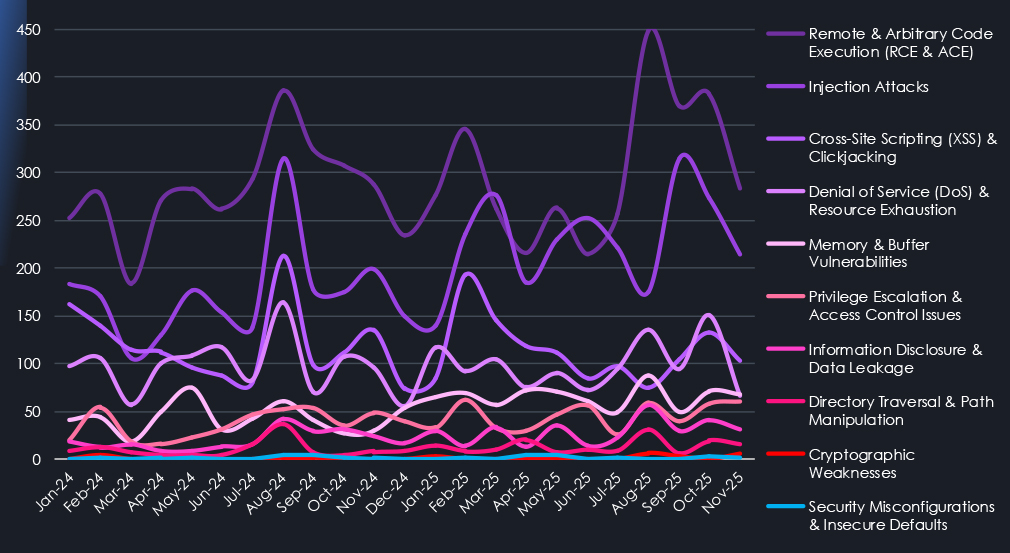
Trends over time for reported vulnerabilities show us the inherent irregular nature of research results and exploits discovery. August 2024 shows an interesting anomaly where multiple categories are being significantly elevated at the same time. Lookup shows multiple high-severity Windows products RCE, Memory, Privilege Escalation, Azure Denial of Service issues reported and exploited alongside ESXi, GeoServer, and ServiceNow bugs.
There are two more such spikes across categories in 2025, suggesting that when major flaws are discovered, they lead to further findings across products and categories.
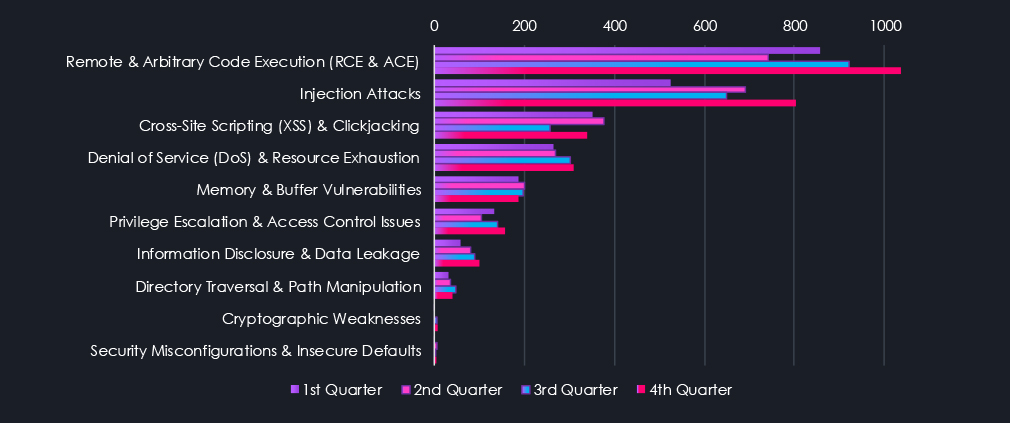
For a cleaner visual interpretation and focus, specifically on the year 2025, the chart below shows a quarterly distribution of reported categories.
The distribution of reported CVEs per industry is very much expected. Information technology represents the vast majority, as the very nature of CVEs and cybersecurity in general is part of Information Technology.
Our categorizations attempt to point out, where possible, specific software and technology are used within respective industries.
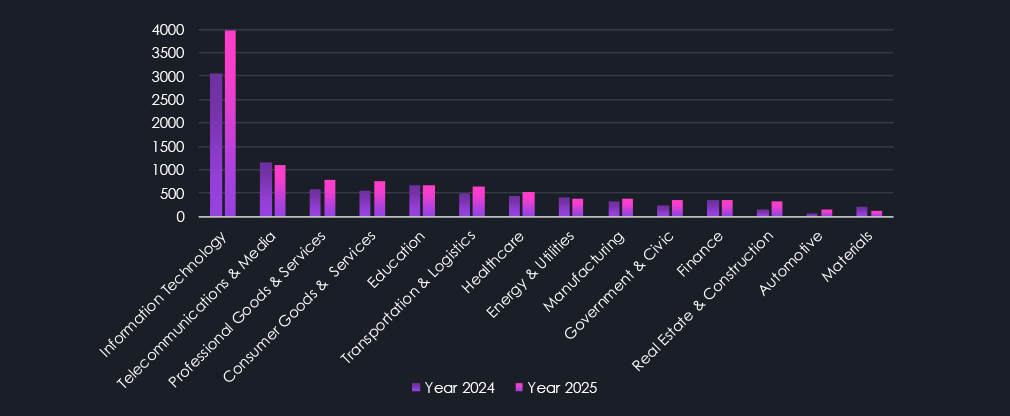
Telecommunication & Media are also expected to be in second place. Professional Goods & Services in the third include sectors such as accounting services, which utilize a variety of specialized software that tends to be regional due to varied tax laws and so on. Along similar lines are categorized tools used for retail, education, healthcare, supply chain management, banking, etc.
In the quarterly 2025 chart below, we can see recent and prominent elevations for IT, Consumer, Transportation & Logistics sectors.
Throughout the year Elevation: Low
Analysis of reported CVEs highlights a steadily expanding vulnerability landscape. In 2024, DeCYFIR identified 8,726 industry-linked vulnerabilities, increasing to 10,533 in 2025. While the year-over-year growth is partly influenced by an additional month in scope, the overall trend aligns with continued technology expansion into traditionally less digital environments, including IoT, operational technology, and connected machinery.
Monthly reporting trends remain largely stable with mild elevation compared to 2024. This stability suggests that vulnerability growth is being driven by organic technology adoption and complexity rather than a sudden deterioration in software security. As more industries integrate software-driven systems, their exposure to disclosed vulnerabilities naturally increases.
Remote and Arbitrary Code Execution vulnerabilities remain the most prevalent category across industries. Although these CVEs are more frequently updated and revised, similar collection bias applies across all categories, maintaining comparative validity. Injection attacks represent the second most common category and recorded the strongest year-over-year growth, while Memory and Buffer vulnerabilities also increased notably during 2025, reflecting persistent weaknesses in core software components.
Temporal analysis reinforces the episodic, event-driven nature of vulnerability discovery. August 2024 stands out as a multi-category spike, driven by simultaneous disclosure and exploitation of high-severity vulnerabilities affecting Windows, Azure, ESXi, GeoServer, and ServiceNow. Similar cross-category spikes observed in 2025 suggest that the discovery of major flaws often triggers broader vulnerability research across related products and technologies.
Industry distribution of reported CVEs follows expected patterns. Information Technology dominates due to its central role in software development and infrastructure. Telecommunications & Media follow, reflecting their reliance on complex, exposed network technologies. Professional Goods & Services rank third, driven by extensive use of specialized and often region-specific software, with similar dynamics observed in sectors such as retail, education, healthcare, logistics, and banking.
Quarterly analysis for 2025 highlights recent elevations in vulnerabilities affecting Information Technology, Consumer-facing technologies, and Transportation & Logistics.
Overall, reported CVE data indicates a maturing and increasingly interconnected technology ecosystem. Vulnerability growth appears structural and cumulative, driven by broader software adoption and complexity. The episodic nature of disclosure and exploitation shows periods of relative stability disrupted by concentrated bursts of high-impact findings.
Our DeCYFIR platform has been collecting available ransom victims’ data for several years. In 2023, it recorded 4,563 verified ransomware victims. In 2024, this number increased to 5,220, representing a 14.4% growth. 2025 recorded a new all-time high with a significant jump of 36% from 2024 to 7099 victims. For complete context, that is also an increase of 55.6% from 2023 to 2025. Alongside the victims, the number of active gangs has also nearly doubled since 2023.
In early 2023, the takedown of Hive caused a temporary dip in ransomware activity. However, this was quickly followed by a surge fuelled by Clop, which exploited the MOVEit vulnerability.
Similarly, the January 2024 slowdown caused by the takedown of LockBit3 was short-lived. Affiliates switched to other Ransomware-as-a-Service (RaaS) platforms. In 2025, February saw the return of Clop ransomware, this time using the Cleo software exploit. Later in the year, Clop also exploited the Oracle vulnerability.
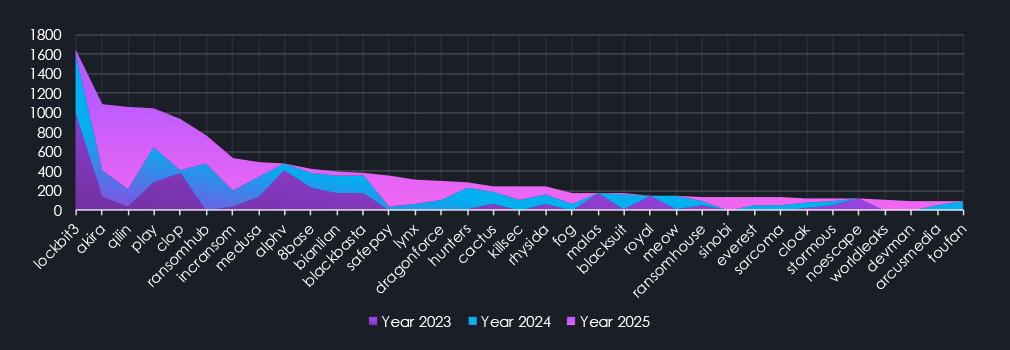
On the last chart above, we can see se which of the top 35 gangs contributed to the victim counts the most, sorted by total count of victims over all three years. 2023 and 2024 clearly show the LockBit3 domination, its fall, and shift towards Akira and ultimately Qilin taking over as the most dominant gang of 2025. Furthermore, emerging groups like Safepay and Lynx, and older groups like IncRansom, gained success, contributing to the new all-time high.
Our DeCYFIR platform collection allows us to dig deeper into leading ransomware trends and visualize the persistent issue of ransomware affiliates. Despite the best efforts, many takedowns and international collaboration of law enforcement agencies, the number of ransomware victims keeps growing. This is due to a network of affiliates operating independently from RaaS operators. When RaaS like LockBit3 is taken down, affiliates simply switch to another RaaS operator, and attacks continue nearly uninterrupted.
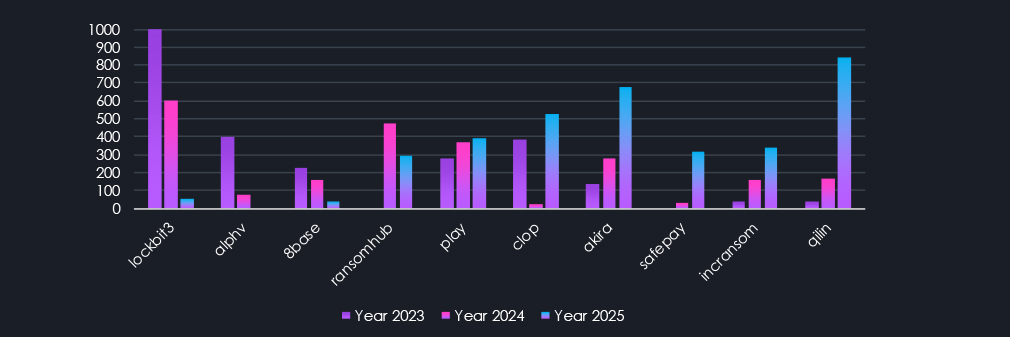
Total counts of victims year over year show on the left RaaS dominating in 2023 and 2024, in the middle RaaS active across the years, and on the right RaaS recording the most victims in 2025.
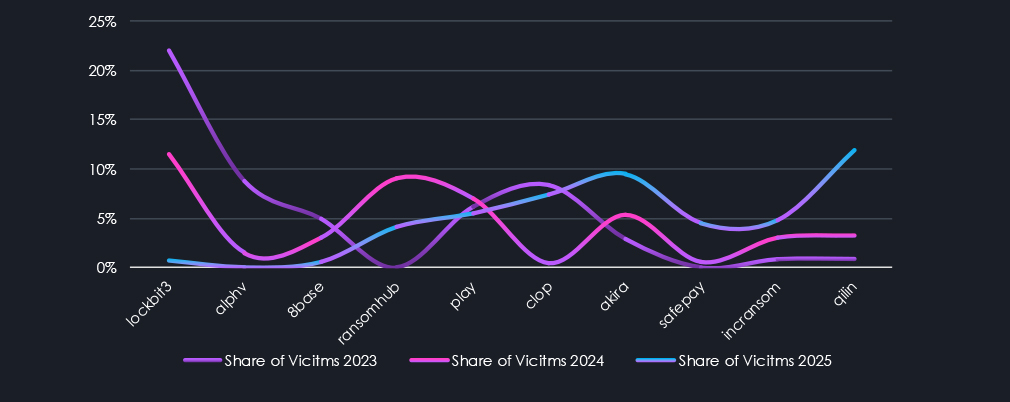
This is similar logic, showing RaaS per share of all victims in the given year. Interestingly, even though Qilin has recorded numbers close to LockBit3 in 2023 (846 and 1003, respectively), it does not come close to LockBit’s overall share. The domination of LockBit3 in 2023 was staggering, with 21.98% of all victims for the year. Qilin’s 11.92% in 2025 is nearly equal to LockBit3 in 2024, with 11.48%, despite LockBit3 having only 70% of the total number of Qilin’s 846 victims.
It just shows how cutting the hydra’s head off only results in more heads growing back. In 2023, we have observed 65 different gangs recording at least 1 victim. In 2024, this number went to 97 (49% increase) and to 124 during 2025. That is 91% up from 2023 and 28% year over year.
As discussed, the number of ransomware gangs grew from 65 in 2023 to 124 in 2025. However, that does not mean all the gangs from 2023 are still active. The endless cat and mouse game with law enforcement forces gangs to break up, regroup, and rebrand constantly.
Our data shows that since December of 2022; there have been 286 different gangs with recorded victims.
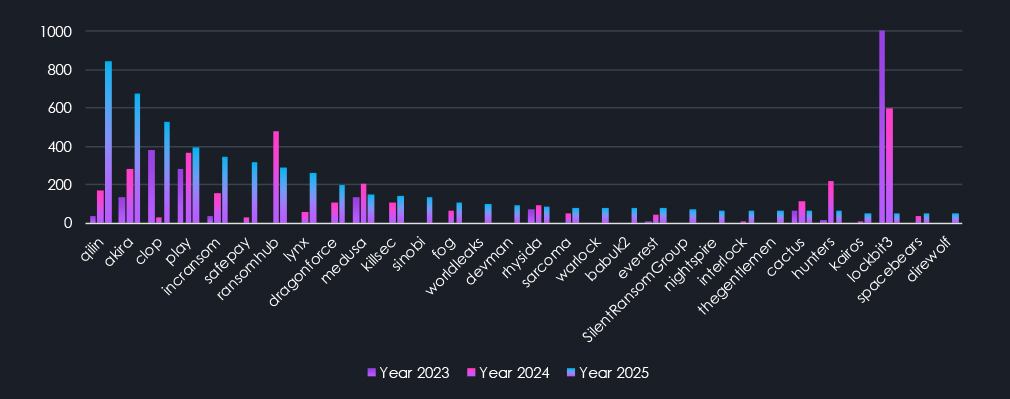
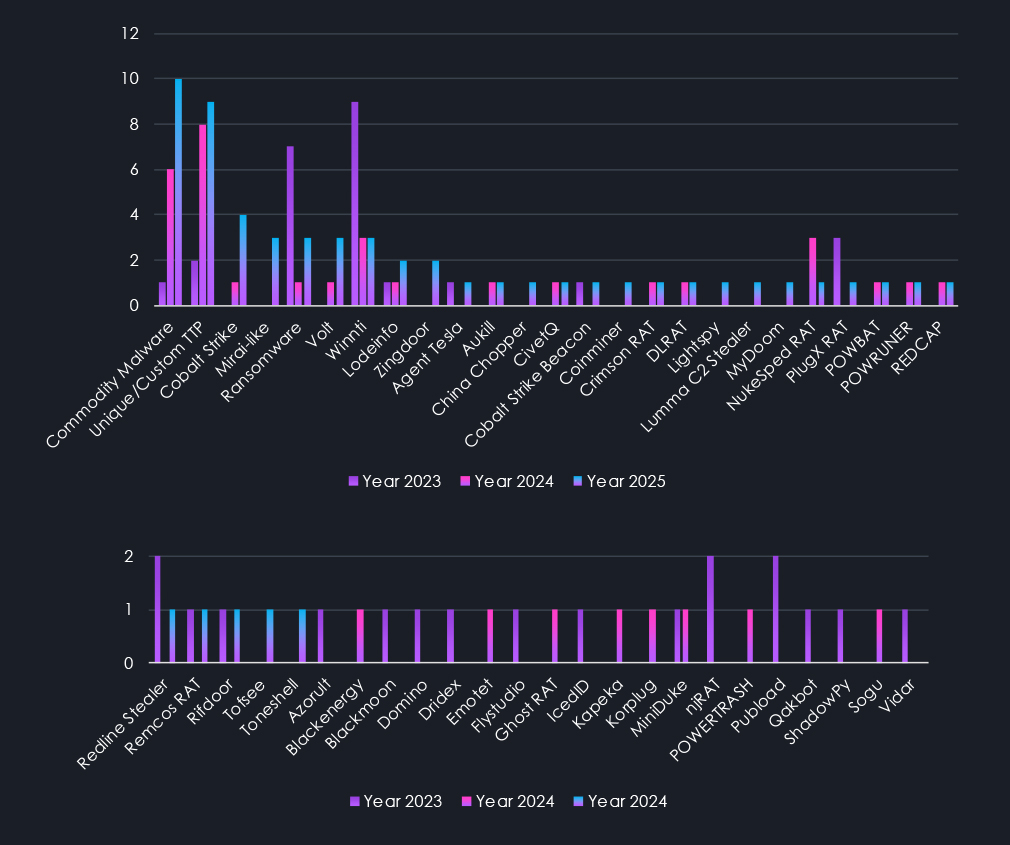
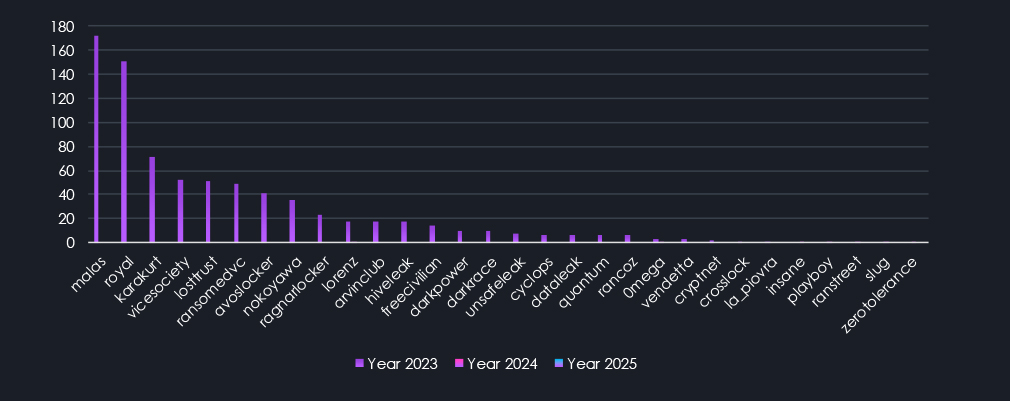
The following chart displays the top 30 ransomware gangs sorted by the number of victims during 2025. Comparison to previous years clearly shows how the names change over time. Many gangs appeared or gained success only during 2025, while others showed sustained activity across years or diminished over time.
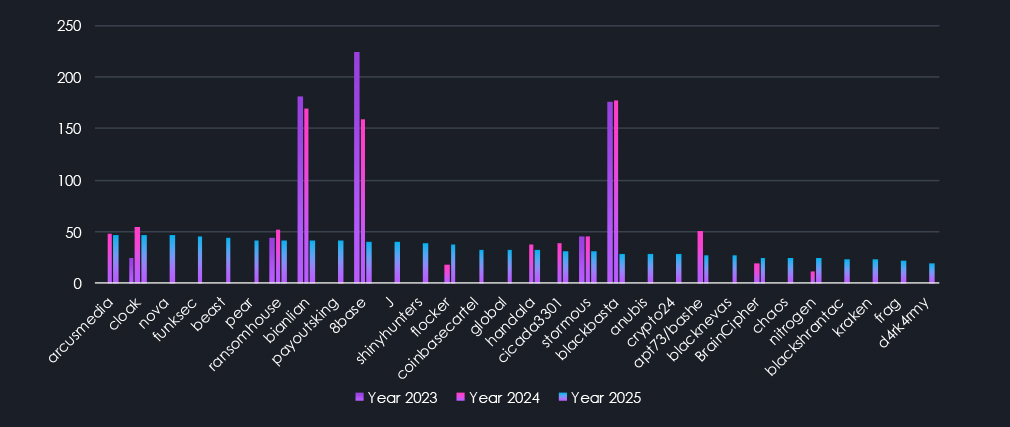
The chart above highlights ransomware gangs ranked 31st to 60th, sorted by victims in 2025. Most dramatic are the declines of Bianlian, 8Base, and Blackbasta. But more interesting is the high number of mid-sized gangs, also present in the first chart. While the top 13 ransomware with 100+ victims are responsible for 60% of all victims, these gangs with victims count between 40 and 100 account for nearly 25% of all victims, and yet usually remain underrepresented in reporting and fly under the radar due to the high fragmentation.
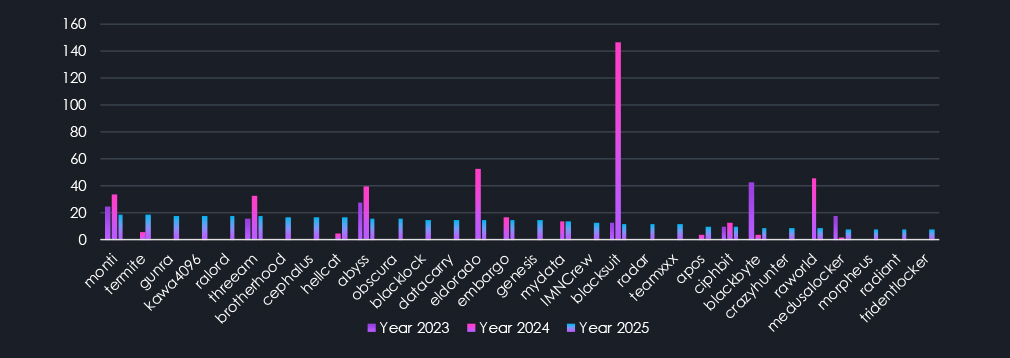
The chart above features ransomware groups ranked 61st to 90th. This segment includes mostly groups active only in 2025. Yet we can still see that some of these smaller groups have been active since 2023.
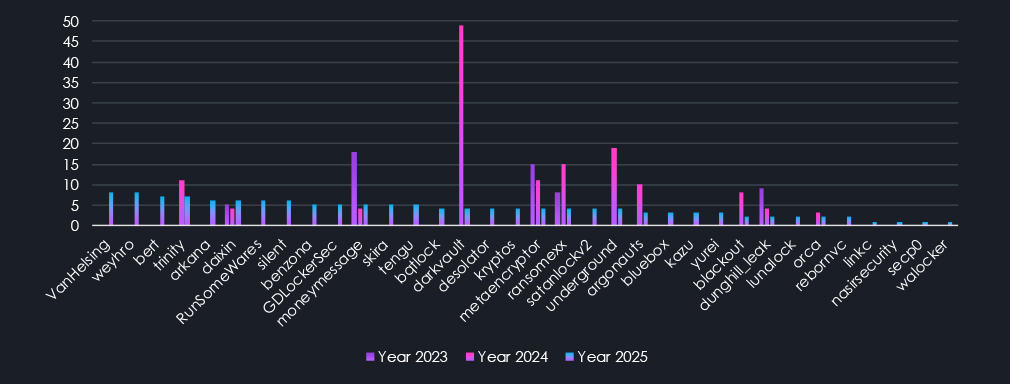
The last chart shows groups ranked 91st to 124th. It also contains a handful of groups that were significantly active in previous years and are nearly completely diminishing during 2025.
Lastly, groups with 39 or fewer are the most frequent, totaling 83 groups and accounting for only 15% of all victims. That still represents over 1000 victims collectively and as such presents a meaningful risk. Yet with such high fragmentation, it becomes very difficult for organizations to keep track.
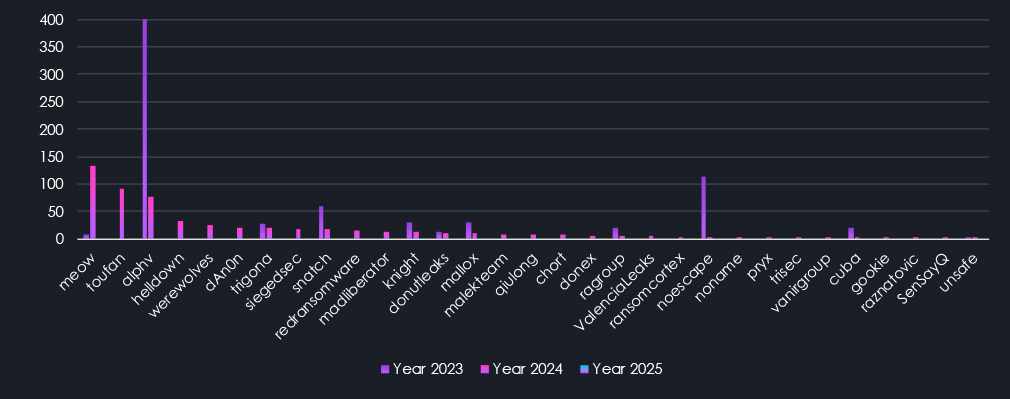
The chart above is now sorted by victims in 2024, as we ran out of gangs active in 2025. Here, the most prominent is the decline of ALPHV, the former top-ranking gang. In total, 37 gangs from 2024 did not survive into 2025.
Finally, the last chart above shows gangs sorted by victims in 2023, with a few having single victims during 2024. In total, we have counted 24 gangs from 2023 that did not survive into 2024 and beyond, some of which were responsible for substantial victim counts.
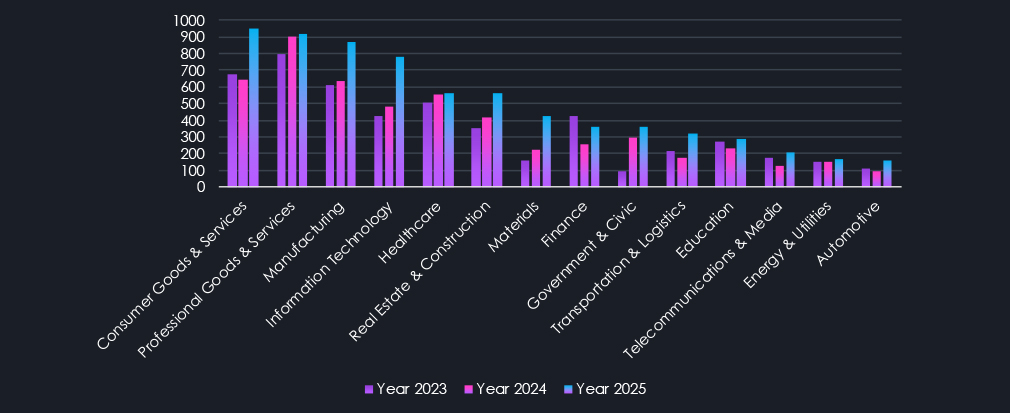
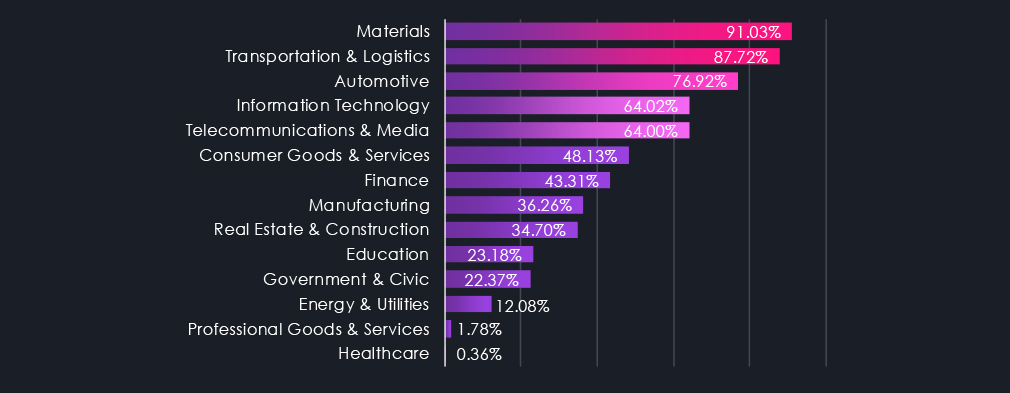
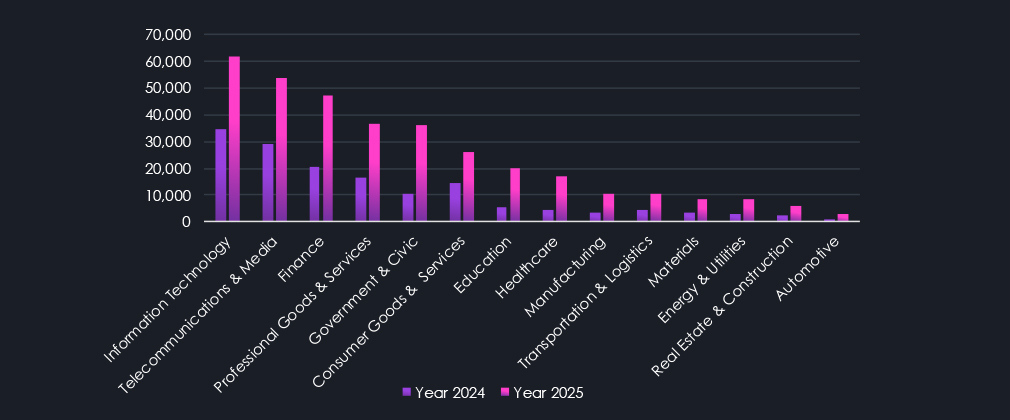
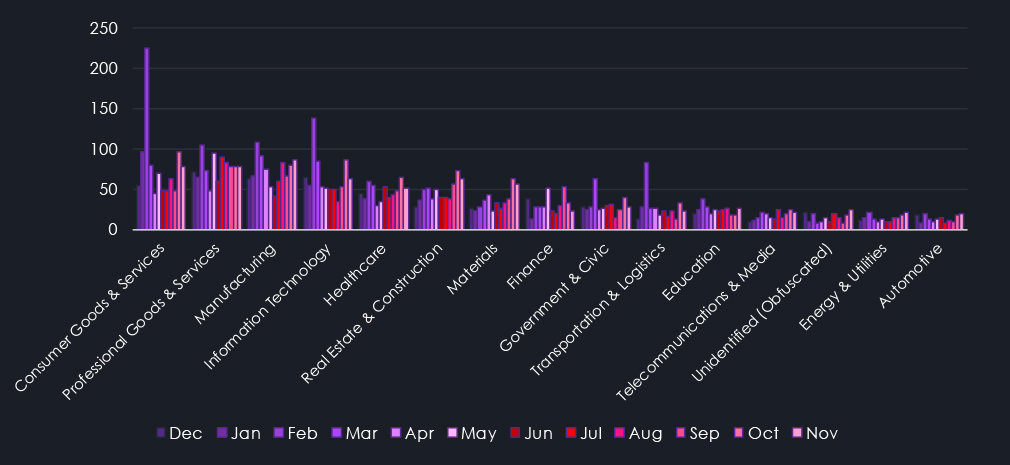
Above are the total counts of victims per industry. Every single one recorded an elevation during 2025. Though Professional Goods & Services, Healthcare, and Energy & Utilities are only small ones. Consumer Goods & Services jumped into first place in 2025 as hits on small and medium retailers grew. Information Technology became a new hot target as gangs realized many companies hold keys to a lot of other networks of their clients. Another high elevation was observed in the Materials industry, as it presents vulnerabilities similar to Manufacturing, and gangs expand their reach.
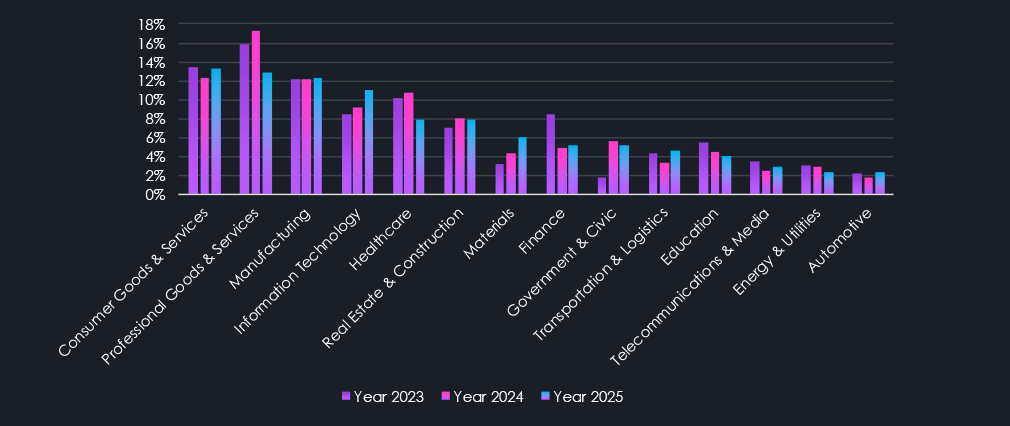
Another interpretation of the same data counts the overall share of all victims per industry. This shows proportional interest and shows targeting changes more accurately. For example, despite a jump in total victims, the manufacturing share of all victims remains nearly unchanged over the year. On the other hand, the previously mentioned elevation in the IT and Materials industries is highly prominent.
Further conversely, Professional Goods & Services and Healthcare show lower proportional targeting as their total victim numbers stayed flat.
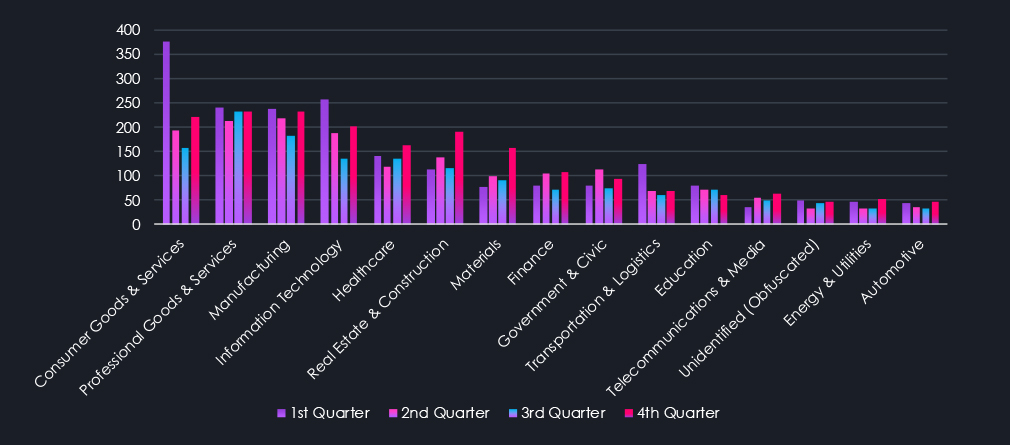
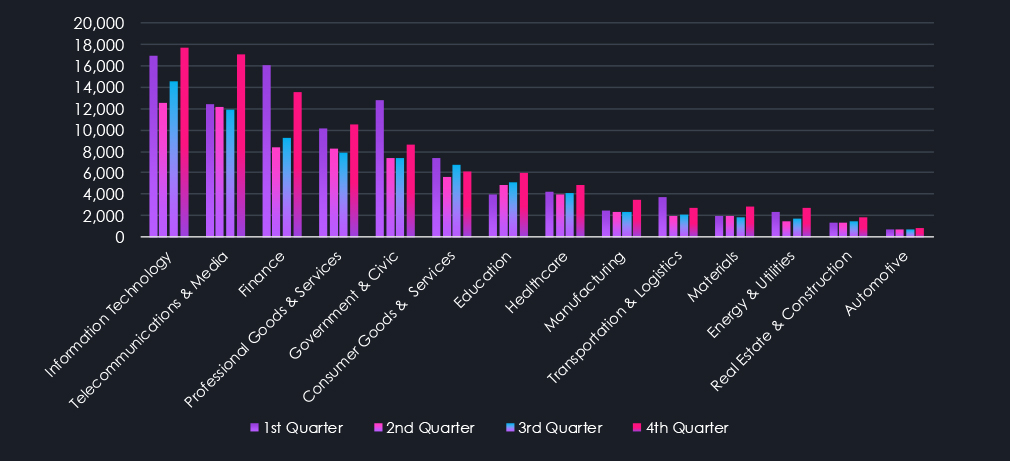
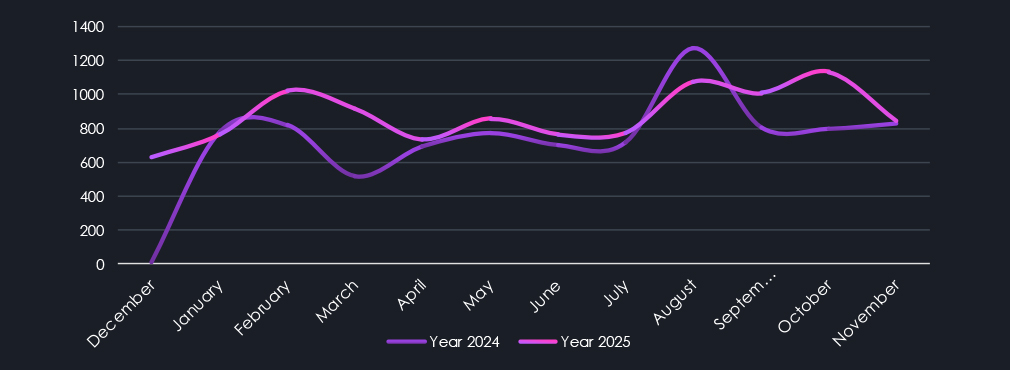
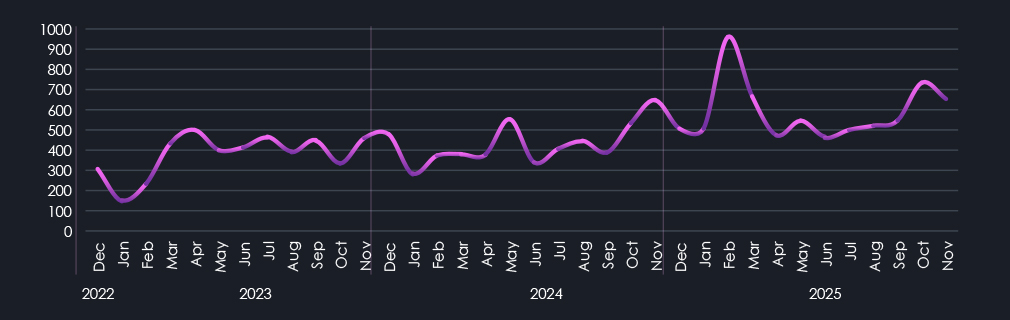
The above and below charts show a detailed breakdown of activity per industry throughout 2025. Quarterly as well as monthly for even greater detail. We can see a significant elevation during February. This is when Clop gang returned with a new set of exploits and disproportionally targeted Consumer Goods & Services, Transportation & Logistics, and IT industries, as well as Government & Civic organizations.
Another major spike occurred during October and November. Clop came back again with a new exploit targeting IT, Manufacturing, and Retailers. However, volume was nowhere near the February rampage. Furthermore, Qilin also recorded a jump in activity targeting Manufacturing, Materials, Real Estate & Construction, Consumer, and Professional Goods & Services most prominently.
The final prominent event was a high number of Asset Management victims by Qilin in South Korea during September, elevating the Finance industry number for the month.
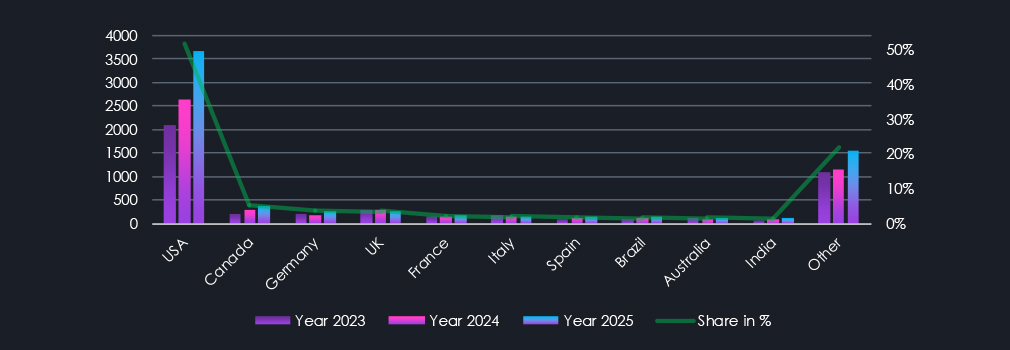
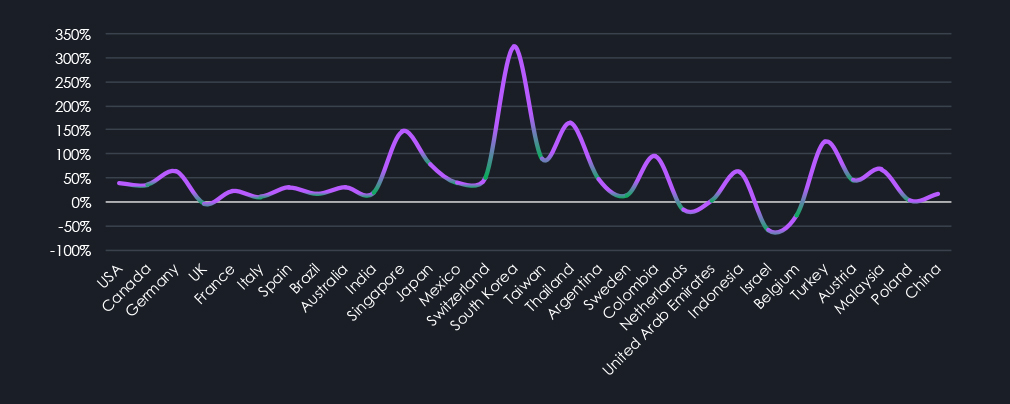
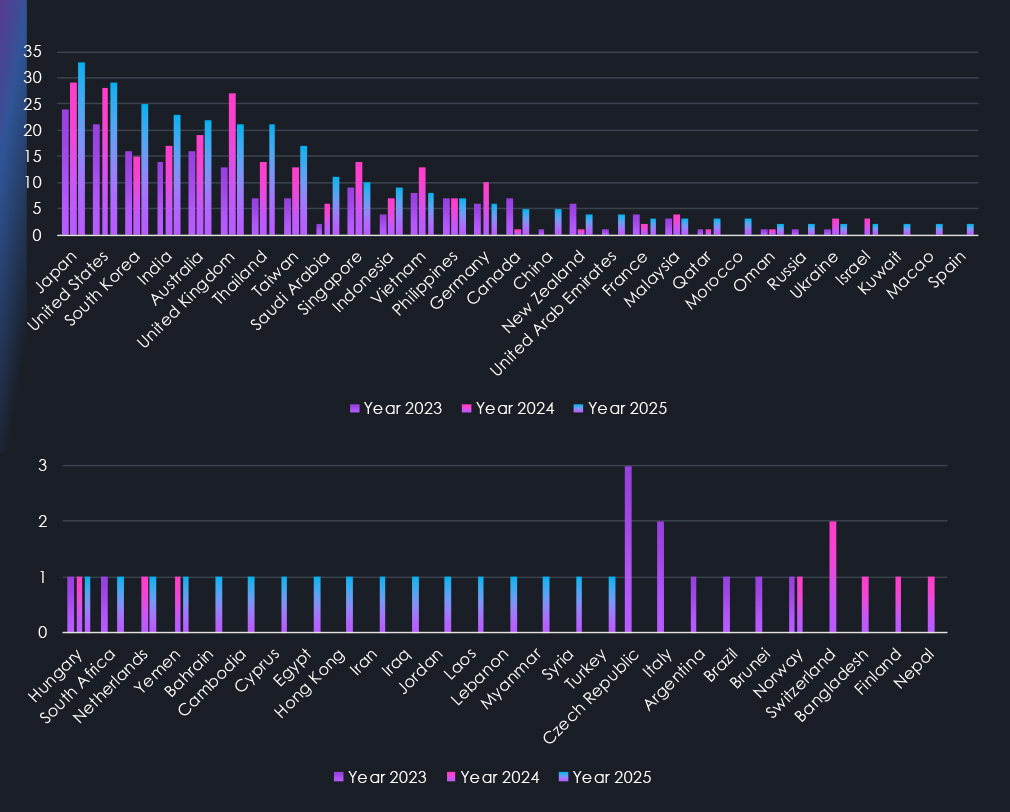
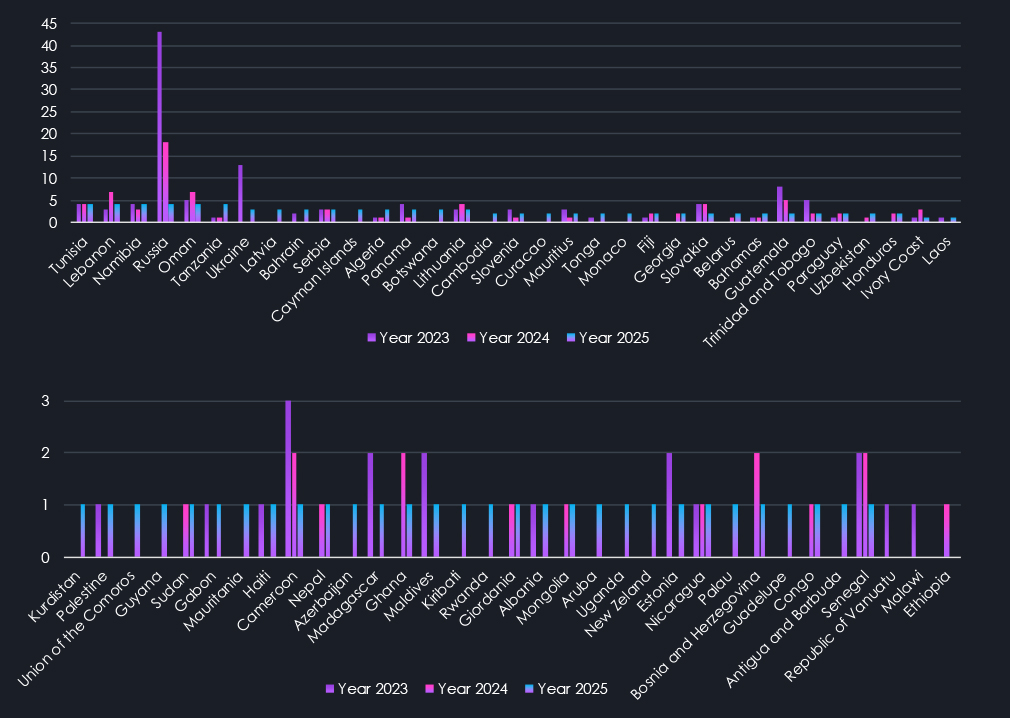
In total, 169 countries recorded ransomware victims since December 2022. Out of which 138 were also during 2025. The United States remains the most frequent victim of ransomware by a significant margin, accounting for 45.7%, 50.6%, and 51.8% of all victims throughout the years. Its dominance completely overshadows other countries in any visualization. Further in the chart above are other Top 10 countries, all recording an elevation in 2025. The remaining 159 countries accounted for 22% of all victims, underlying disproportionate targeting.
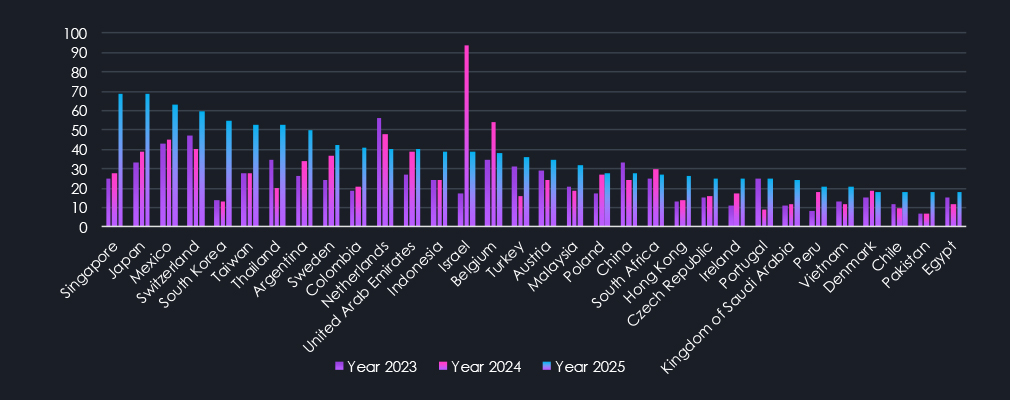
The charts above and below display 11th to 32nd and 33rd to 66th countries, sorted by the number of victims in 2025. Unfortunate runner-up in 11th place is Singapore, which went from 25 and 28 victims to 69 during 2025. Given the small size of the city-state, this is uniquely focused targeting. Most of the largest elevations are in Asian countries and Central & Latin America. Furthermore, a few Middle Eastern and Arab countries also recorded a significant increase in victims.
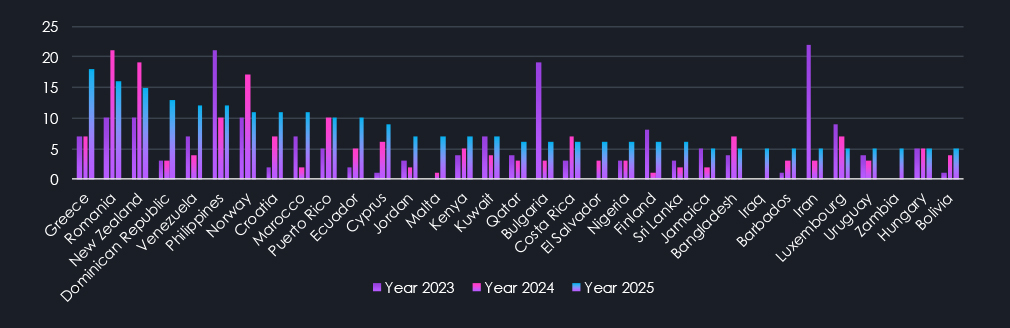
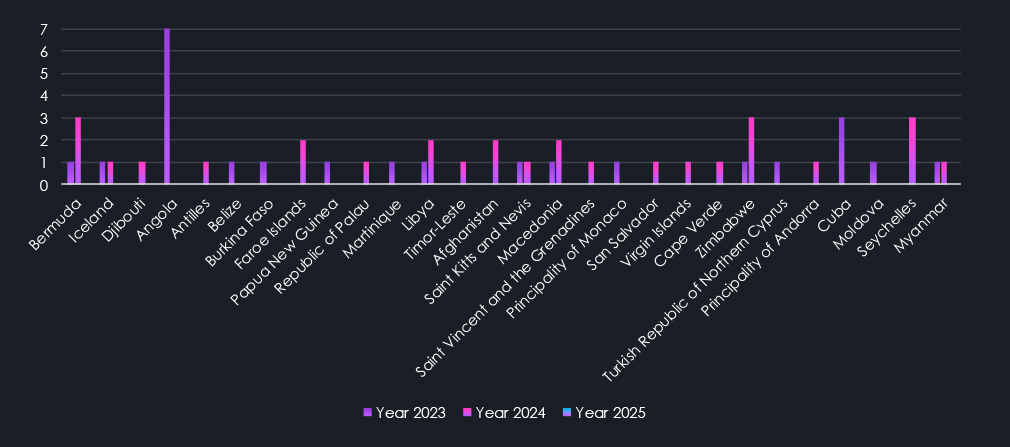
Continuation of data charts for every country with recorded victims since December 2022.
Finally, the last chart shows the countries that did not record any victims in 2025.
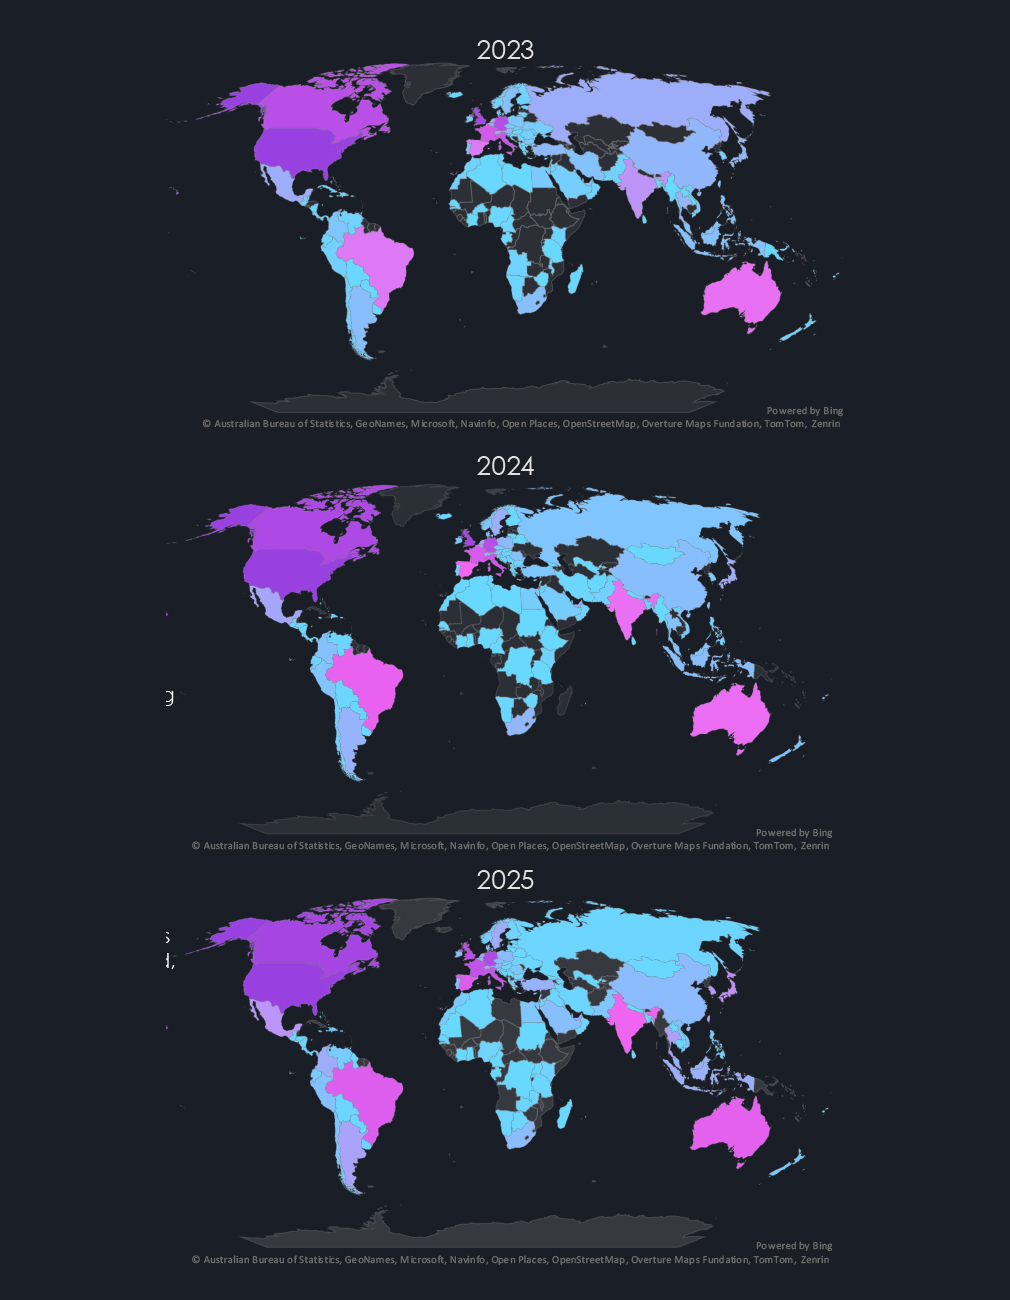
The heatmaps of geographic distribution highlight the global reach of ransomware while visually illustrating the changes from 2023 to 2025.
Most notable are is growing coverage of African continent as well as Central Asia.
Furthermore, we can see a gradual darkening of Latin America, India, and Australia as growing targets of ransomware.
Though less prominent due to scale, the growth in Asian countries, notable in previous charts, is also visible.
Specifically in Southeast Asia, we are observing a years-long trend of local low-level cybercrime traditionally focused on infostealers and data leaks, gradually maturing into ransomware affiliates and occasional attempts to start ransomware gangs.
This is a trend observed across continents, and if unchanged, predicts a near future where Southeast Asian and Latin American cybercrime groups reach scale and volumes of so far dominant Russian and Eastern European syndicates.
Ransomware activity in 2025 shows decisive escalation rather than a temporary surge. DeCYFIR recorded 7,099 verified victims, a 36% increase over 2024 and 55.6% growth compared to 2023. These gains occurred despite sustained law enforcement pressure, confirming that enforcement actions have not reduced overall ransomware impact.
High-profile takedowns consistently produced only short-lived disruptions. The removal of Hive in 2023 and Lockbit3 in early 2024 briefly slowed activity, but affiliates rapidly shifted to alternative RaaS platforms. Clop’s repeated re-emergences in 2023 and 2025, leveraging MOVEit, Cleo, and Oracle vulnerabilities, illustrate that exploit access and affiliate networks matter more than the persistence of individual ransomware brands.
The defining trend of 2025 is fragmentation at scale. Lockbit3 accounted for nearly 22% of all victims in 2023, a level of dominance no longer observed. Qilin emerged as the most active group in 2025, yet represented only 11.92% of victims. Since December 2022, 286 distinct ransomware gangs have recorded victims, with active groups increasing from 65 in 2023 to 124 in 2025. This growth reflects fragmentation, as pressure forces gangs to splinter, rebrand, and proliferate, and new cybercriminals trying their luck.
Mid-tier and smaller groups now play a critical role. While the top 13 gangs accounted for roughly 60% of 2025 victims, groups with 40 to 100 victims contributed nearly 25%, and 83 smaller gangs collectively exceeded 1,000 victims. This long tail remains underrepresented in reporting yet materially increases defender complexity and operational risk.
Industry targeting in 2025 expanded across the board. Consumer Goods & Services, Information Technology, and Materials saw the largest growth, with proportional analysis highlighting a shift toward IT providers and interconnected environments. Manufacturing maintained a stable share, while Healthcare and Professional Goods & Services showed relative deprioritization rather than decline.
Geographically, the United States remained the primary target, exceeding 50% of all victims in 2025. However, growth accelerated across Asia, Latin America, Africa, and Central Asia, with Southeast Asia showing clear maturation from low-level cybercrime into ransomware operations. This mirrors earlier development paths seen in Eastern European ecosystems.
Overall, data from December 2022 through 2025 shows ransomware evolving into a decentralized, resilient, and globally distributed threat. Takedowns remain necessary but insufficient. Without sustained disruption of affiliate ecosystems, exploit supply chains, and monetization infrastructure, ransomware activity will continue to fragment and scale.
Unfortunately, the conditions observed in 2025 should be treated as a baseline, not a peak.