

The CYFIRMA Industry Report delivers original cybersecurity insights and telemetry- driven statistics of global industries, covering one sector each week for a quarter. This report focuses on real estate and utilities, presenting key trends and statistics in an engaging infographic format.
Welcome to CYFIRMA infographic industry report, where we delve into the external threat landscape of the real estate and utilities industry over the past three months. This report provides valuable insights and data-driven statistics, delivering a concise analysis of attack campaigns, phishing telemetry, and ransomware incidents targeting real estate and utilities.
We aim to present an industry-specific overview in a convenient, engaging, and informative format. Leveraging our cutting-edge platform telemetry and the expertise of our analysts, we bring you actionable intelligence to stay ahead in the cybersecurity landscape.
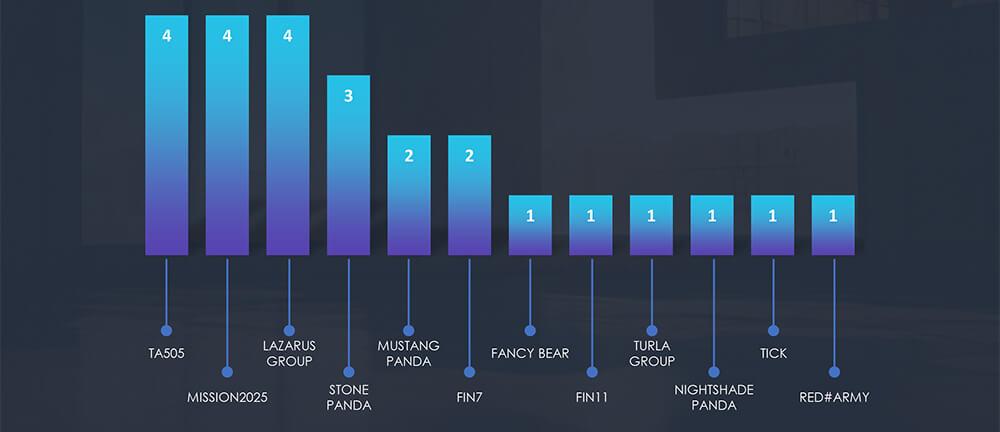
Real estate and utilities organizations featured in 13 out of the 59 observed campaigns, which is a presence in 22% of the campaigns, yet relatively low as compared to other industries with high strategic interests to nation-state threat actors.
Monthly activity shows huge spike in July, this is due to ‘last seen’ date based telemetry and lack of interest from threat actors. To be precise, the July spike is attributed to increased Lazarus Group activity linked to the discovery of MagicRAT and QuiteRAT. There was also a surge in Chinese cyber activity using the Barracuda ESG vulnerability and other TTPs used in the same campaigns, resulting in more detections. Since then, we have not observed new real estate or utilities victims in these campaigns.

Real estate and utilities appear to attract very mixed bag of APT actors. Distribution is about even between financially motivated and nation-state actors.
Europe is again taking the lead as the most attacked region. Our hypothesis is related to Russian linked threat actors aiming at energy utilities in relation to war with Ukraine.
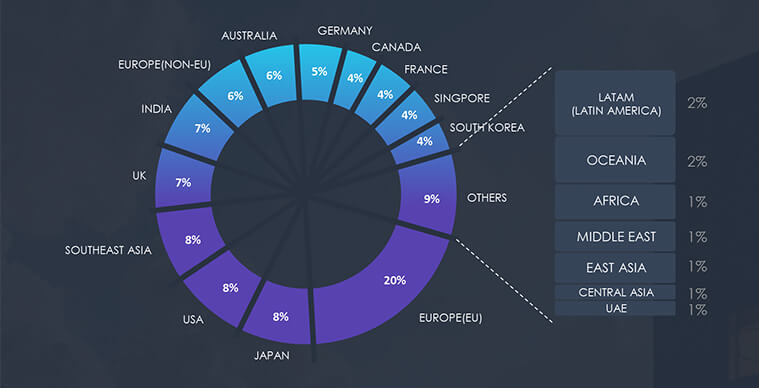
Due to the overlapping nature of monitoring telemetry, further breakdown beyond the top 10 countries is calculated for regions rather than individual countries to maintain clarity.
Web applications continue to be the primary target for cyberattacks across all industries, followed by operating systems. Further we have observed compromised VPN and Application Infrastructure.

For the purpose of this report, we have excluded internet service providers as we cover them in the dedicated Telecommunications industry report. Initially, we were expecting a significant portion of water and energy utility companies used for phishing lures, however, this does not appear to be the case. Further analysis showed these are very localized all the way to a single county in a region within a country. Such fragmentation is not attractive to threat actors, as they want to cast as wide a net as possible.
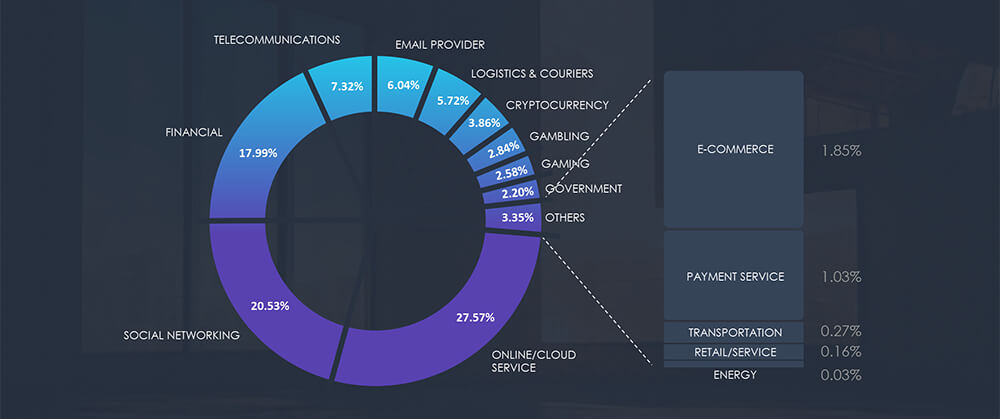
Over the past 3 months, CYFIRMA’s telemetry recorded only 42 phishing attacks out of a total of 206,528 that included utility and no real estate-related campaigns. While we acknowledge there are numerous spear-phishing attacks, our telemetry focuses on wider phishing campaigns.
As per the chart below, our telemetry shows Energy sector, which includes utilities, share 0.03%
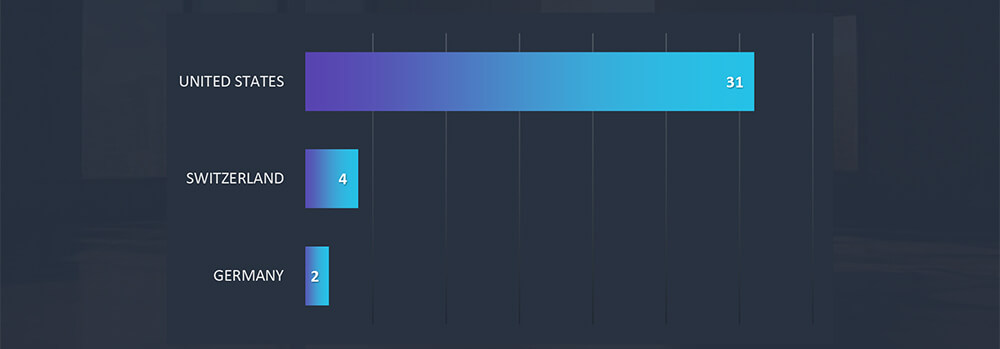
Only 4 brands were observed to be used as phishing lure in wider campaigns. PKN Orlen and Polska Grupa Energetyczna are Polish energy utility companies. Enel Energia is Italian and Swiss Office of Energy is a government body for regulation of energy supply and use.
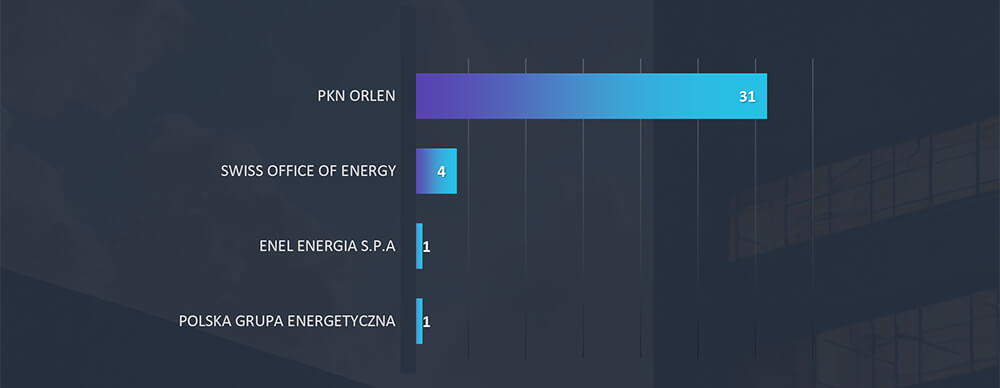
Interestingly, our ASN Origin-based telemetry for geography shows that all PKN Orlen phishing originated from USA. Swiss Office of Energy has Swiss origin and both Italian Enel Energia and Polska Grupa Energetyczna originated from German ASN, suggesting that PKN Orlen campaign is conducted by international threat actors, whereas the rest by local cybercriminals.
In the past 90 days, CYFIRMA has identified 117 verified ransomware victims within the real estate and utilities sectors. This accounts for 7.4% of the overall total of 1,579 ransomware incidents during the same period.
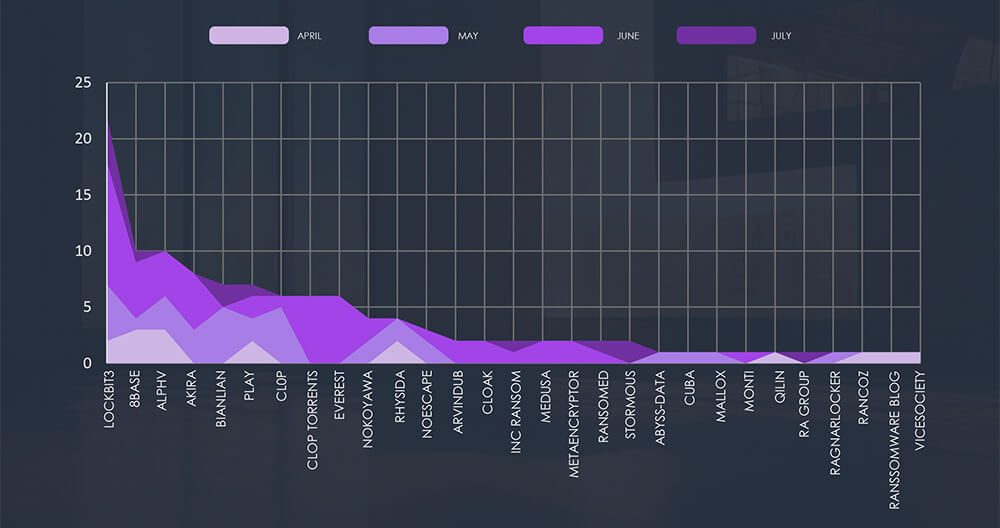
The chart below shows consistently high numbers of attacks with a significant spike in August.

Breaking down the monthly activity by gangs, Lockbit3 with their August rampage is taking the lead. Combined with Cl0p (+Torrents), we can see the reason for the spike in August victims. Following are 8base with ALPHV and Akira, which were all report consistent numbers.
The subsequent chart underscores the dominance of major ransomware gangs, with the top 5 accounting for 59% of all victims. Simultaneously, the chart illustrates how the collective activity of smaller groups contributes to a substantial number of victims.
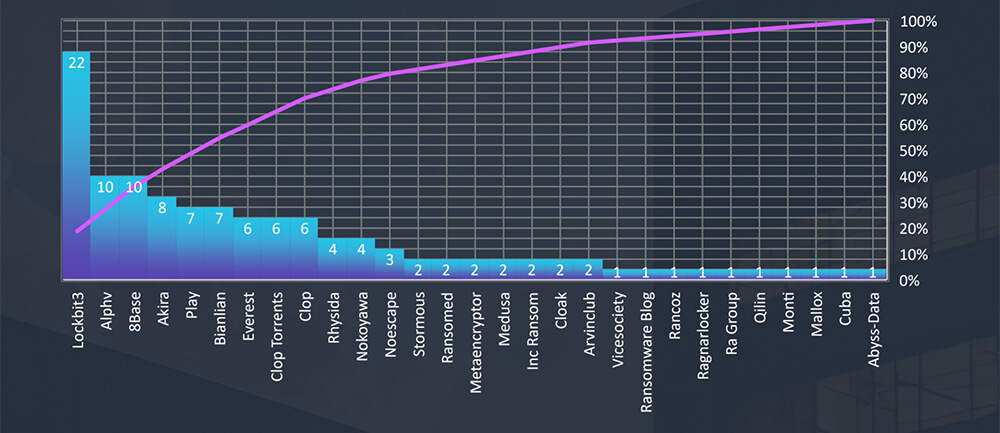
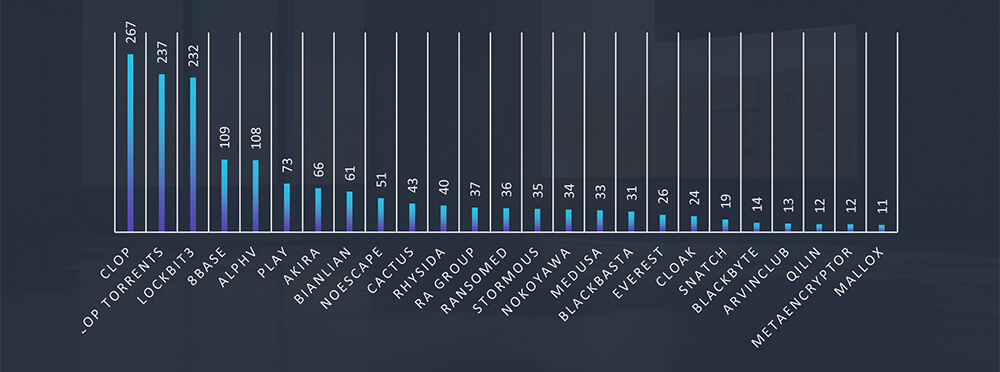
From 45 gangs active in the past 90 days, 29 recorded verified real estate and utilities industry victims. Comparing data gang activity across industries we can see Cl0p appears to show low interest in this industry.
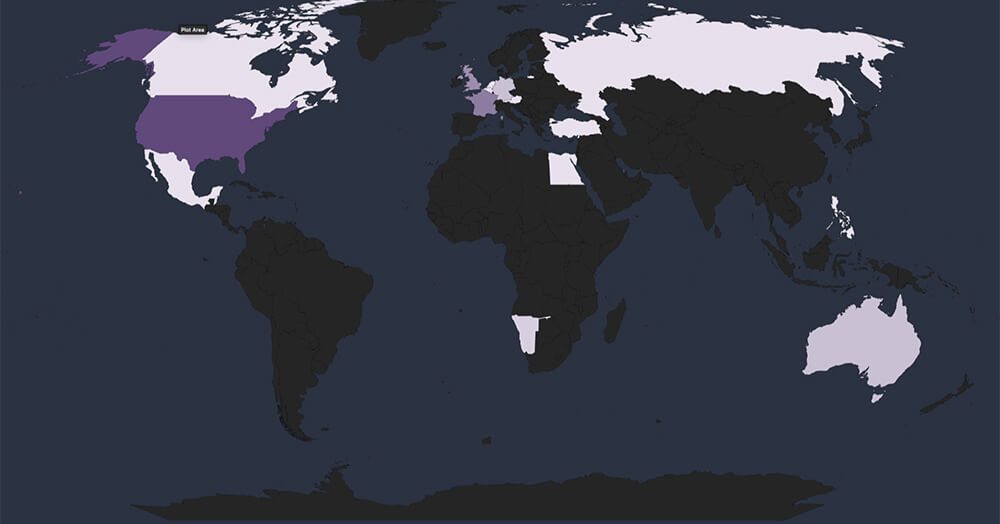
Global Spread – Out of the 112 victims, the United States emerges as the most affected with 65 victims, followed by France, UK, Australia and Germany.
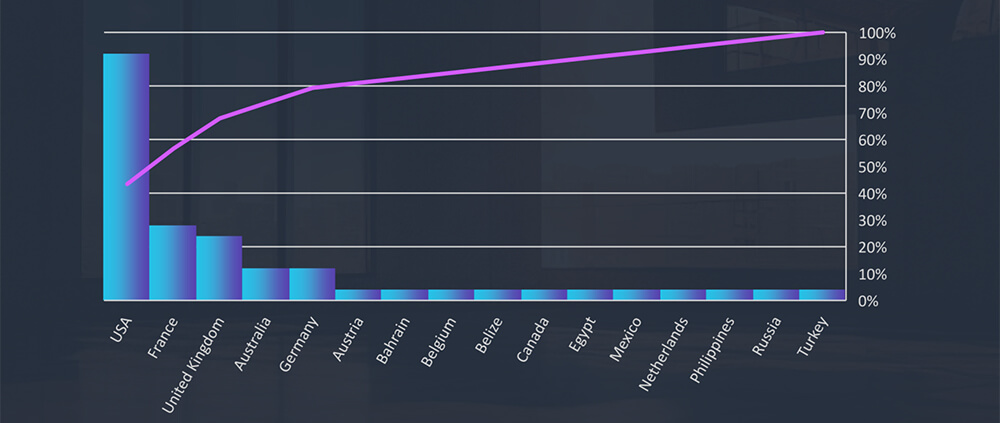
Geographical Vulnerability – The distribution of victims serves as a reminder that no region is exempt from ransomware threats. Cyber attackers have the capability to breach and target vulnerable organizations globally. This trend indicates that many threat actors prioritize exploiting vulnerabilities within organizations, regardless of their geographical locations.
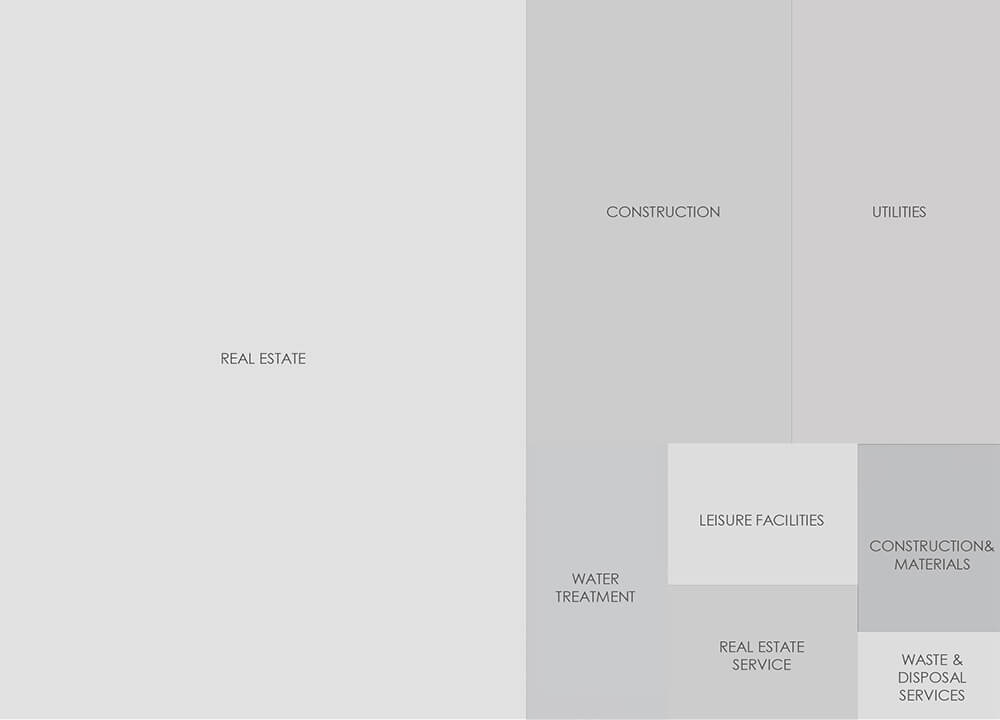
Sectors Distribution: The chart below illustrates the distribution of ransomware incidents over the past 90 days.
The real estate and utilities industry does not appear to be of high interest to nation- state APTs, beyond the overlap of the energy industry and utilities. That is the case, especially in Europe in relation to the ongoing war between Ukraine and Russia.
Real estate does not present an attractive phishing lure for widespread campaigns and somewhat surprisingly neither does utilities. Highly localized fragmentation of these services has proven to be a dealbreaker for such campaigns.
Ransomware victimology shows moderate interest in this industry, compared to other industries. The most active gang is Lockbit3 with a decent margin, followed by Cl0p 8base, ALPHV and Akira, where Cl0p is reporting significantly fewer victims in this industry related to their overall activity. The most affected sectors are real estate developers and construction businesses.