
The CYFIRMA Industry Report delivers original cybersecurity insights and telemetry – driven statistics of global industries, covering one sector each week for a quarter. This report focuses on the energy industry, presenting key trends and statistics in an engaging infographic format.
Welcome to the CYFIRMA infographic industry report, where we delve into the external threat landscape of the energy industry over the past three months. This report provides valuable insights and data-driven statistics, delivering a concise analysis of attack campaigns, phishing telemetry, and ransomware incidents targeting the energy industry.
We aim to present an industry-specific overview in a convenient, engaging, and informative format. Leveraging our cutting-edge platform telemetry and the expertise of our analysts, we bring you actionable intelligence to stay ahead in the cybersecurity landscape.
CYFIRMA provides cyber threat intelligence and external threat landscape management platforms; DeCYFIR and DeTCT, which utilize artificial intelligence and machine learning to ingest and process relevant data, complemented by manual CTI research.
Including that we are only presenting verified data, no extrapolation, simulation or estimates.
For the purpose of these reports, we leverage the following data from our platform. These are data processed by AI and ML automation based on both human research input and automated ingestions.
While this report contains statistics and graphs generated primarily by automation, it undergoes thorough review and enhancement for additional context by CYFIRMA CTI analysts to ensure the highest quality and provide valuable insights.
Energy organizations featured in 12 out of the 31 observed campaigns, which is a presence in 29% of campaigns.
Observed Campaigns per Month

The monthly chart shows a significant drop in active campaigns since the spike in July.
Suspected Threat Actors
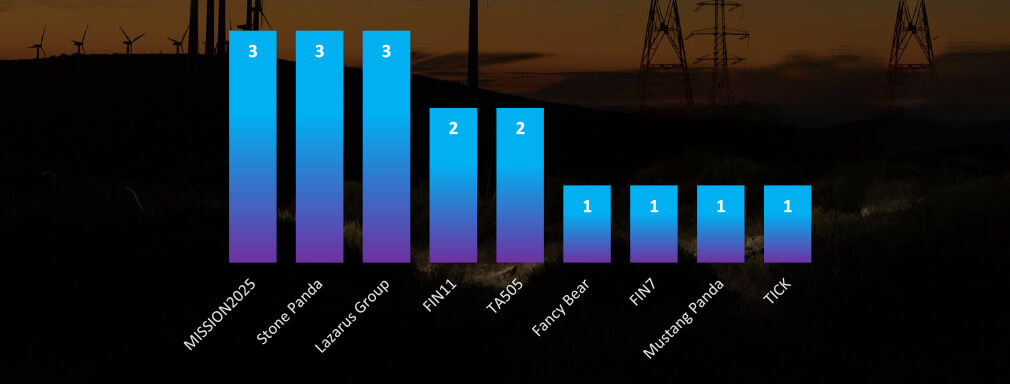
Accounting for overlaps between Mission2025 and Stone Panda, both nation-state and financially motivated threat actors, including Lazarus Group are about evenly represented.
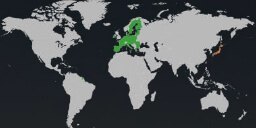
Europe is again taking the lead as the most attacked region. Our hypothesis is related to Russian linked threat actors, aiming at energy utilities in relation to war with Ukraine.
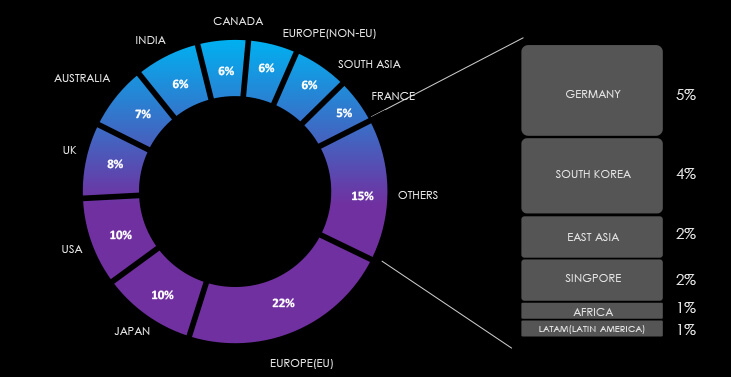
Note: Due to the overlapping nature of monitoring telemetry, further breakdown beyond the top 10 countries is calculated for regions rather than individual countries to maintain clarity.
The EU, is most attacked region by a large margin followed by Japan and the USA.
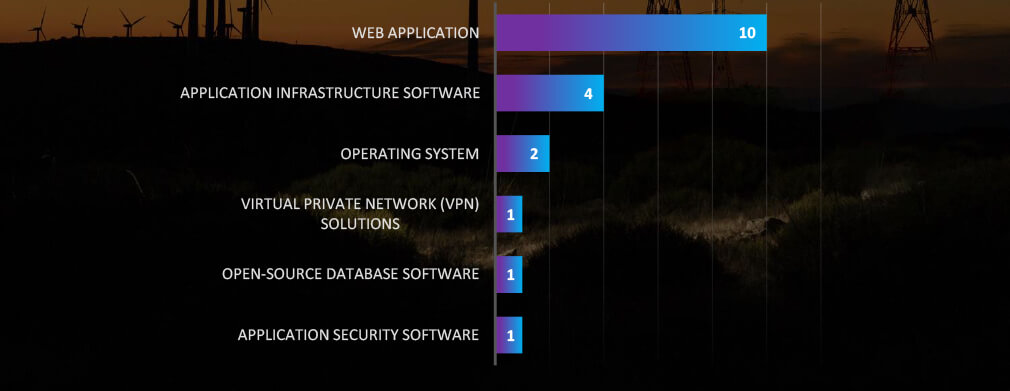
Web applications continue to be the most attacked technology across industries. While application infrastructure is of high interest in energy industry.
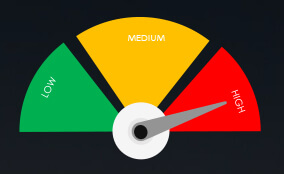
Risk Level Indicator: High (EU and Japan) Moderate for the rest
The monthly activity for July saw a significant increase, primarily fueled by a surge in engagement from the Lazarus Group, which can be directly attributed to the discovery of MagicRAT and QuiteRAT. Simultaneously, there was a rise in cyber activity originating from China, exploiting the Barracuda ESG vulnerability and employing similar Tactics, Techniques, and Procedures (TTPs) in their campaigns. This resulted in a notable uptick in detections. However, following these developments, our findings have not shown a substantial increase in newly detected Advanced Persistent Threat (APT) campaigns.
When it comes to suspected threat actors targeting energy organizations, the landscape is evenly divided between financially motivated groups, such as the well-known Lazarus Group, and entities like FIN11, FIN7, and TA505, alongside nation-state threat actors from China and Russia.
In terms of geographical impact, the European Union remains the most frequently targeted region, closely followed by Japan and the USA. This alignment with the geopolitical situation is evident, as the EU’s energy sector continues to face ongoing cyber-attacks in relation to the Ukraine-Russia conflict, while Japan finds itself in the crosshairs of Chinese APTs.
Web applications remain the top-attacked technology for cyberattacks across various industries, with operating systems following closely in terms of susceptibility. Additionally, we’ve observed application infrastructure in energy sector being targeted more frequently.
Over the past 3 months, CYFIRMA’s telemetry recorded only 39 phishing campaigns out of a total of 200,599 that impersonated the energy industry.
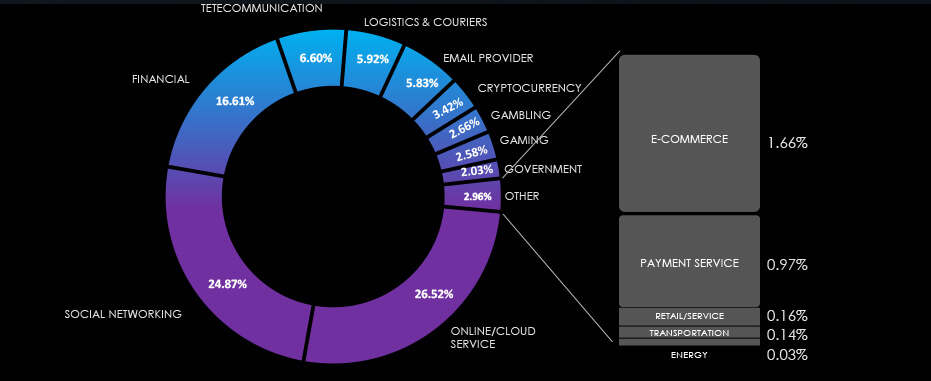
As per the chart below, energy is 0.03% of all observed themes, CYFIRMA telemetry is tracking.
Global Distribution of Phishing Themes per Sector
Impersonated Energy Industry Brands
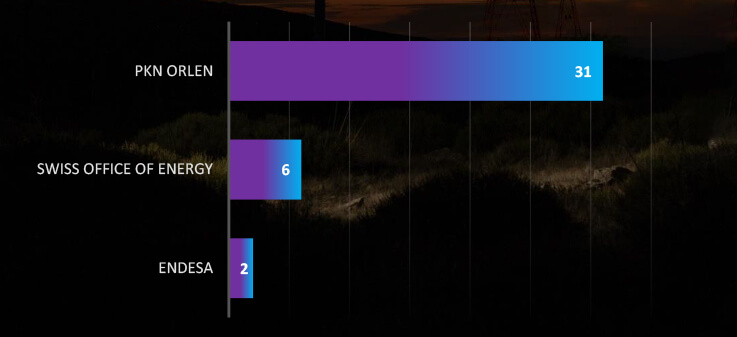
Polish PKN Orlen, Swiss Office of Energy and Spanish Endesa are the only 3 brands observed to be impersonated in phishing campaigns in our telemetry.
Top 20 Themes used against Energy sector
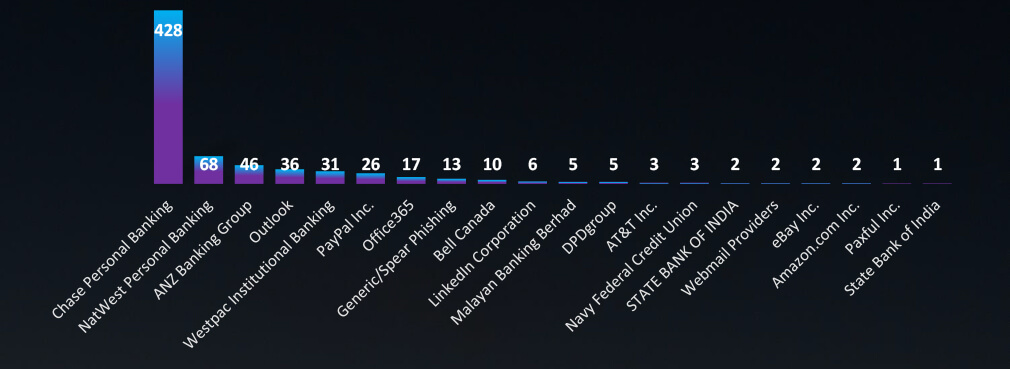
Based on experimental tags, relevant keywords show phishing themes used against energy sector.
Risk Level Indicator: Low
The energy industry has proven to be an unpopular phishing lure with just 0,03% representation. Highly localized fragmentation is a deal breaker for wide ‘spray and pray’ types of campaigns, while more effective lures exist at a national level.
Polish energy giant PKN Orlen is the only energy company with significant campaigns observed. Along with it a handful of campaigns are the Swiss Office of Energy and Spanish Endesa.
To provide some more insights into the energy sector, we had a look at the experimental tags system in our telemetry, which allows for monitoring of the intended recipient industry. It suggests that by a large margin bank impersonation is the most commonly used theme against energy organizations.
In the past 90 days, CYFIRMA has identified 77 verified ransomware victims within the energy industry sectors. This accounts for 4.8% of the overall total of 1,596 ransomware incidents during the same period.
The Monthly Activity Chart

Monthly trends show a significant spike above the average during August and September.
Breakdown of Monthly Activity by Gang
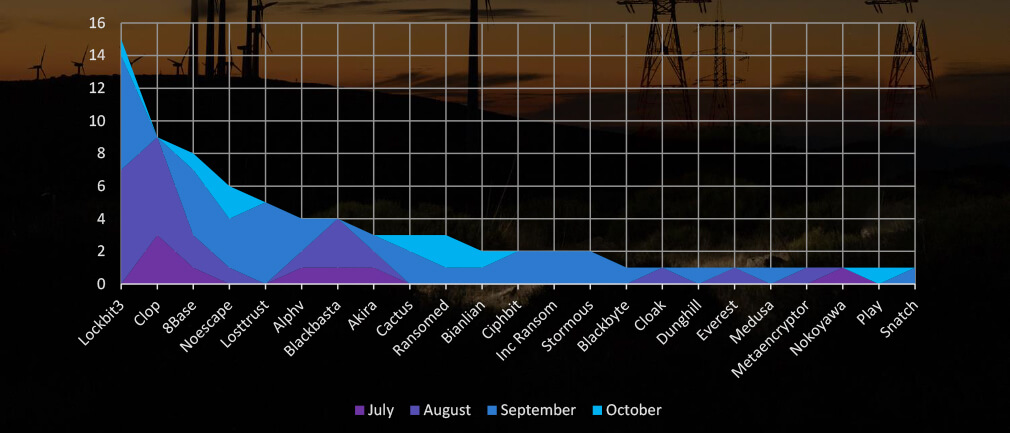
A breakdown of the monthly activity shows the Lockbit3 and Cl0p gang with their summer rampage are behind the August spike. While Noescape with Losttrust and other smaller gangs were highly active in September.
Ransomware Victims in Energy Industry per Group
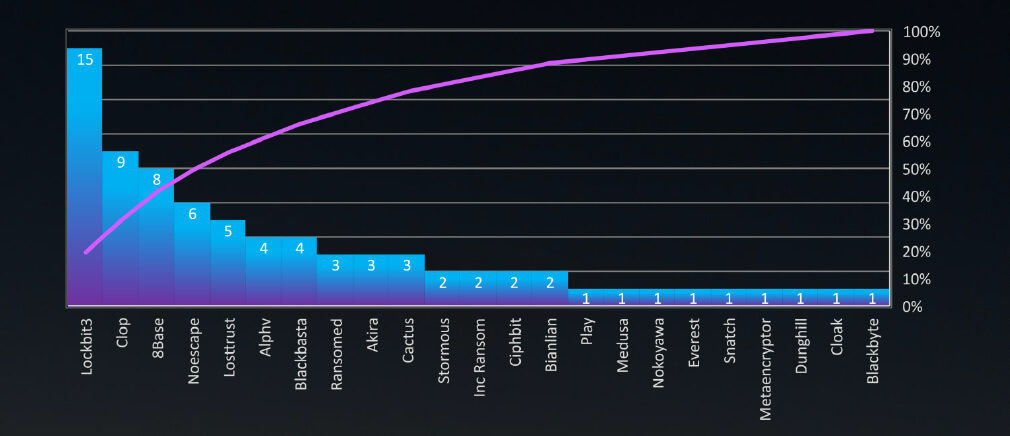
In total 23 groups recorded energy organization victims in the past 90 days. The top 3 are responsible for half of them.
Comparison to All Ransomware Victims by Group (Top 25)
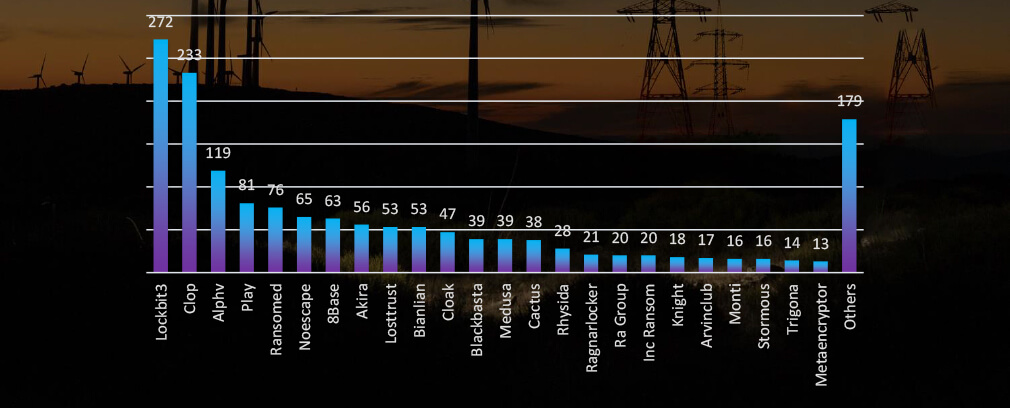
Compared to all recorded victims in the same time period, some groups, such as Play show significantly fewer victims in the energy industry, implying a focus on other industries.
Geographic Distribution Of Victims
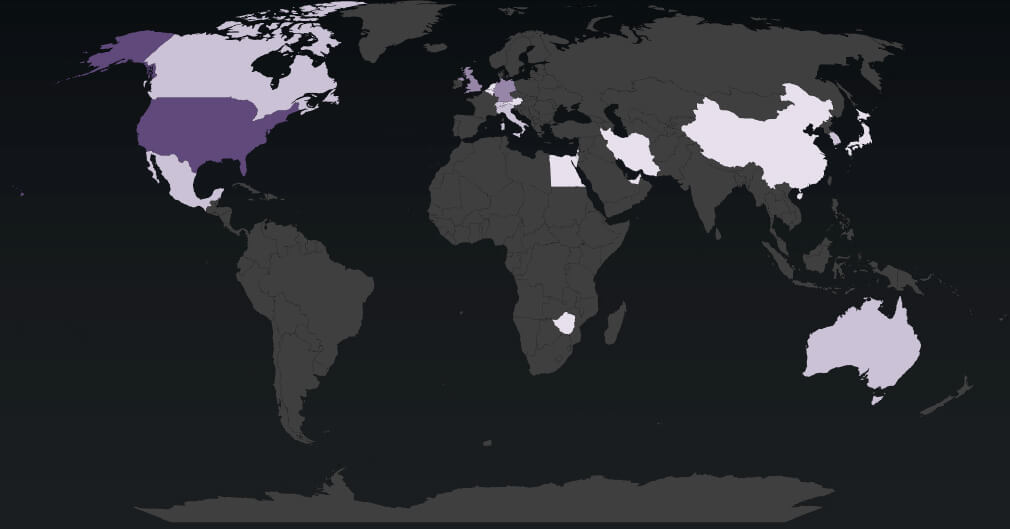
The heatmap of geographic distribution illustrates the global reach of ransomware across continents and in mostly developed economies.
Total Victims per Country
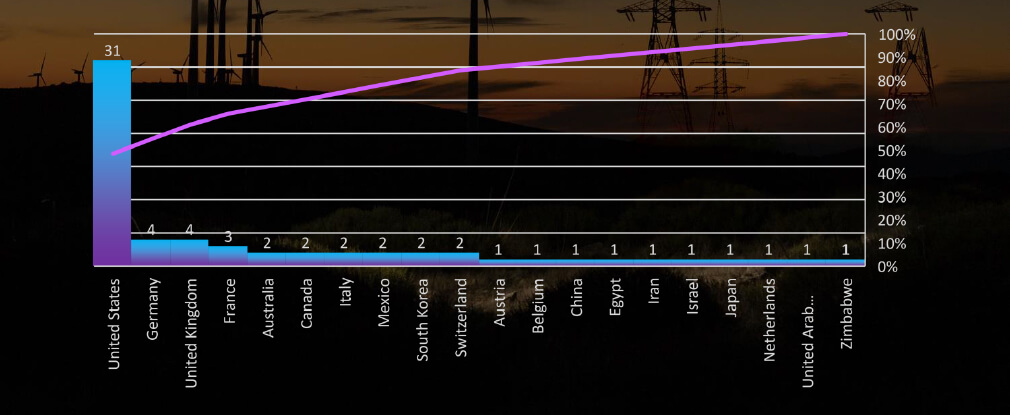
In total 20 countries recorded energy industry ransomware victims with the US alone accounting for ~80% of all.
Sectors Distribution
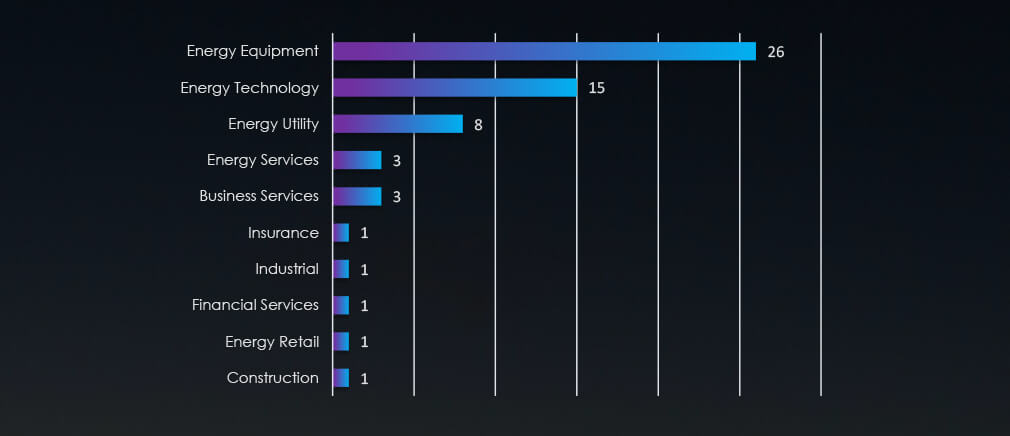
Energy equipment and technology are the most vulnerable sectors within the energy industry.
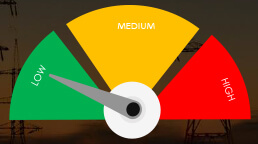
Risk Level Indicator: Moderate

Monthly activity consistently shows a substantial volume of attacks, with a noteworthy surge in August and September. A closer look at the groups behind these attacks highlight the Lockbit3 and Cl0p gangs behind the August rampage. While in September Noescape with Losttrust and other smaller gangs were responsible for heightened number of victims
The data on the total number of victims per group underscores the dominance of major ransomware gangs, with the top three accounting for half of all victims. However, from September we observed many new/rebranded groups with significant numbers of victims.
Of the 55 active gangs in the past 90 days, 23 have targeted the energy industry. Notably, Lockbit3, Noescape and Losttrust have showed high interests in this industry.
Among the 70 victims with identified locations in 20 different countries, the United States ranks as the most affected, with 31 victims, followed by Germany and the UK. The United States remains the most targeted country across various industries, owing to its vast economy and diverse financial landscape. In the energy industry, victims are mostly from developed economies.
For a comprehensive, up-to-date global ransomware tracking report on a monthly basis, please refer to our new monthly “Tracking Ransomware” series here.
The energy industry is a part of a critical infrastructure and is consistently facing higher risks from sophisticated threat actors. Our data suggests energy sector is under attack across continents, however, focused on developed economies. We can highly correlate this with current geopolitical climate
Energy sector external threat landscape involves highly sophisticated groups, including Chinese nation-state actors and prolific Russian ransomware gangs with a notable interest in energy sector from some.