
Education Industry
CATEGORIES RISK MOVERS
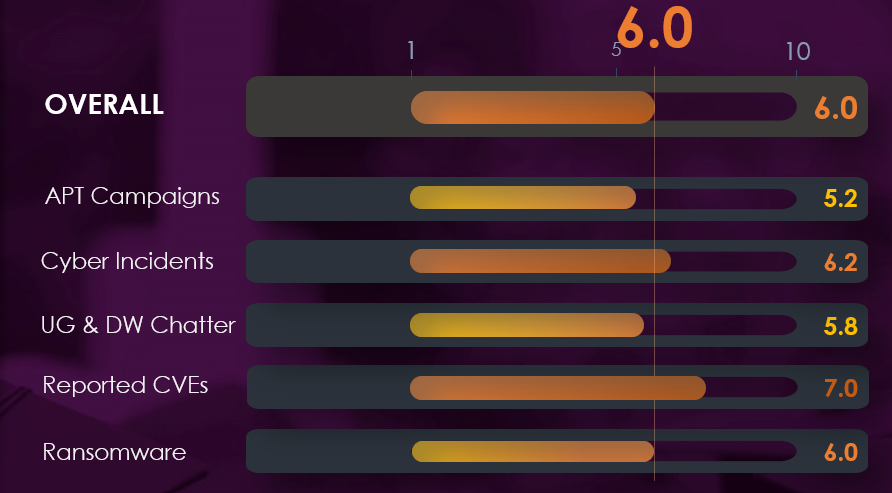
APT Campaigns – 5.2
12 of 114 campaign updates (11%), the lowest presence recorded in this series, rising only from 10 in absolute terms while share fell from 28% against a pool that more than tripled. The actor set is exclusively state-sponsored with no financially motivated presence, unique across sectors. Operating systems ranked above web applications, an inversion pointing to host-level access over perimeter exploitation.
Cyber Incidents – 6.2
Five incidents, 11th of 14, a fall that measures the end of the Instructure and Canvas news cycle rather than reduced exposure. Credential theft appeared in more than half of sector incidents. Three separate state campaigns with named attribution, including nine months of undetected access in South Korea’s diplomat training system and a US indictment over IP theft valued in billions.
Dark Web Chatter – 5.8
2,134 mentions, 7th of 14 at 4.64%, declining across the window while most sectors rose steeply. Claimed hacks are the only growth category, suggesting visibility-seeking rather than monetisation. Identity records for minors carry extended fraud value because they go unmonitored for years, sustaining demand independent of current volume.
Vulnerabilities – 7.0
448 mentions, 8th of 14 at 3.88%, with total volume rising in every period and RCE reaching roughly three-quarters of final-period disclosures. Decentralised IT across faculties leaves asset inventory incomplete, so remediation coverage stays uncertain even when patching is prompt. Exposure is rising while criminal chatter falls.
Ransomware – 6.0
85 victims, up 19.7% Q-on-Q with share slipping to 3.08% and coverage contracting from 34 to 28 countries. Qilin and Thegentlemen led by volume while directing only around 3% of their activity here, and the 8.1% average sector share is the lowest ratio recorded. Universities & Research Institutions accounted for almost half of victims.
EXECUTIVE SUMMARY
The CYFIRMA Industry Report delivers original cybersecurity insights and telemetry-driven statistics of global industries, covering one sector each week for a quarter. This report focuses on the Education Industry, presenting key trends and statistics in an engaging infographic format.
INTRODUCTION
Welcome to the CYFIRMA infographic industry report, where we delve into the external threat landscape of the education industry over the past three months. This report provides valuable insights and data-driven statistics, delivering a concise analysis of attack campaigns, public reports, underground & dark web chatter, vulnerabilities, and ransomware incidents targeting education organizations.
We aim to present an industry-specific overview in a convenient, engaging, and informative format. Leveraging our cutting-edge platform telemetry and the expertise of our analysts, we bring you actionable intelligence to stay ahead in the cybersecurity landscape.
METHODOLOGY
CYFIRMA delivers pre-emptive cybersecurity, cyber threat intelligence, and external threat landscape management through its platforms, DeCYFIR and DeTCT. These platforms have been purpose-built over many years to continuously collect, correlate, and analyse large volumes of external threat data, combining proprietary intelligence automation with deep, hands-on cyber threat research.
For the purpose of this report, the analysis draws on intelligence generated from CYFIRMA’s platforms. The data referenced has been processed through automated correlation and enrichment mechanisms, informed and validated by human-led research and investigative expertise, and sourced from both structured and unstructured external intelligence channels.
OBSERVED ATTACK CAMPAIGNS
REPORTED CYBER INCIDENTS
METHODOLOGY
UNDERGROUND & DARK WEB CHATTER
VULNERABILITIES
RANSOMWARE
While this report contains data collected and processed by our in-house AI and ML, all charts, statistics, and analyses are done by human CYFIRMA CTI analysts to ensure the highest quality and provide accurate insights.
ADVANCED PERSISTENT THREAT ATTACK CAMPAIGNS
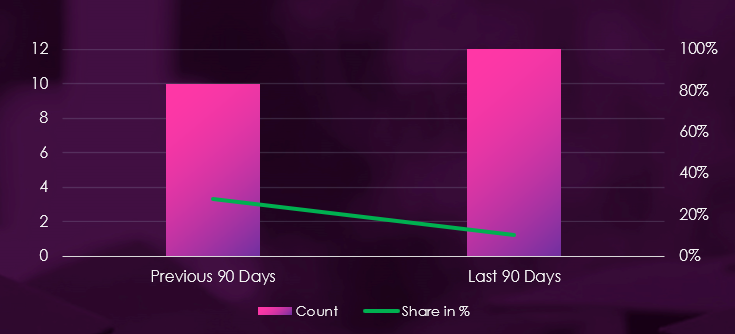
Education organizations featured in 12 out of 114 campaigns, which is a presence in 11% of all activity. This is a higher number than the previous period, when this sector was present in 10 out of 36 campaigns. However, a decline in presence to 28% of the observed activity.
OBSERVED CAMPAIGNS PER MONTH
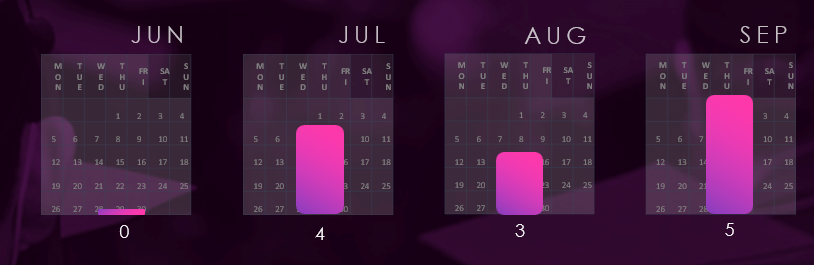
APT activity targeting education has been continuous across the period, with recorded counts of 4, 3, and 5 from July through September.
Campaign activity updates accumulate over time, so campaigns detected earlier continue to generate updates in later months. Monthly figures should be read as a floor for earlier periods rather than a direct measure of when activity began.
SUSPECTED THREAT ACTORS
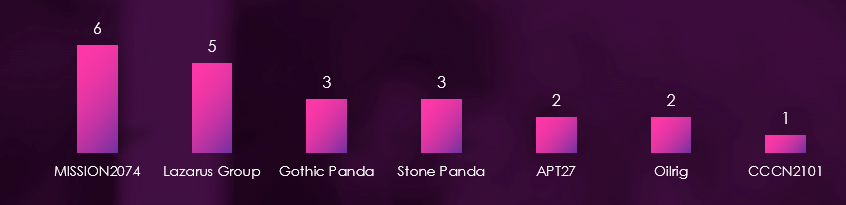
Observed APT campaigns are led by suspected China-linked, state-sponsored actors, with MISSION2074 recording the highest campaign count. Gothic Panda, Stone Panda, and APT27 provide further China-aligned representation.
North Korea-associated Lazarus Group ranks second overall, the only non-Chinese state actor with a significant presence. Iran-linked OilRig also appears, alongside a single Chinese cybercriminal group. The actor set is narrow and exclusively espionage-weighted, with no major financially motivated actors recorded, pointing to intelligence collection against research output and institutional data rather than monetization.
GEOGRAPHICAL DISTRIBUTION
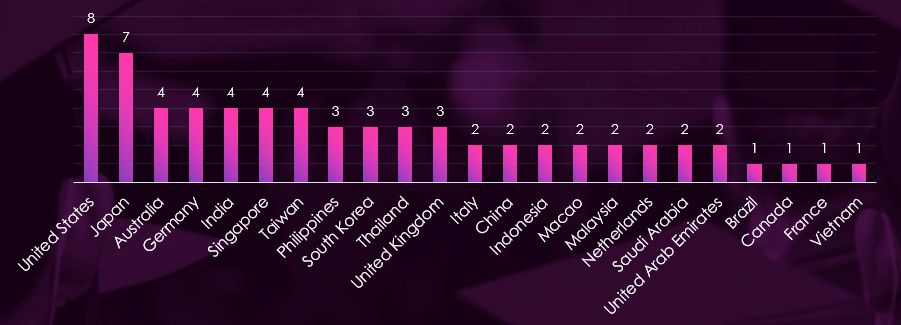
Victim distribution spans 23 countries, with the United States recording the highest victim count, followed by Japan. Australia, Germany, India, Singapore, and Taiwan form an even second tier, each recording identical counts.
European presence is limited, covering Germany, Italy, the Netherlands, France, and the United Kingdom. Southeast Asian representation includes Singapore, the Philippines, Thailand, Indonesia, Malaysia, and Vietnam. Middle Eastern presence is confined to Saudi Arabia and the UAE.
The overall footprint is narrower than in most sectors, concentrated on countries with significant research universities and higher education sectors rather than spread broadly across regions.
TOP ATTACKED TECHNOLOGY
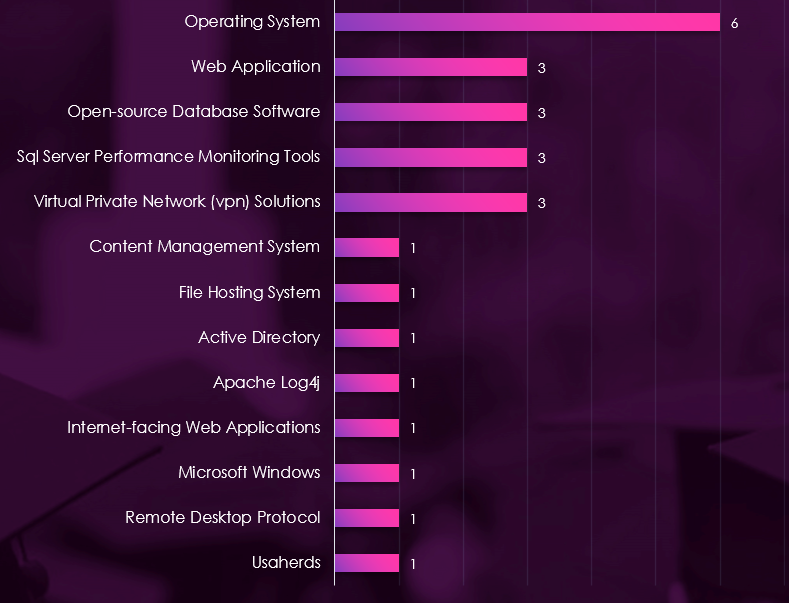
Operating systems account for the highest number of observed attacks, ranking above web applications, an inversion of the pattern seen in most sectors and pointing to host-level compromise as a primary objective.
Open-source database software and SQL server performance monitoring tools both feature across multiple campaigns, indicating targeting of research data stores and the tooling that manages them. VPN solutions also appear across multiple campaigns.
Content management systems, file hosting systems, Active Directory, Apache Log4j, Microsoft Windows, and remote desktop protocol each appear once. The combination of database software, file hosting, and content management points to targeting focused on stored research material and institutional content rather than network infrastructure.
Risk Level Indicator: 5.2 – Elevated
FORWARD ASSESSMENT

Based on observed trajectory across the two reporting periods, the education sector external threat landscape is expected to remain at Elevated through the next 90 days. Campaign presence rose only marginally in absolute terms, from 10 to 12, while the sector’s share fell from 28% to 11% against a campaign pool that more than tripled. This indicates flat targeting against a rapidly expanding threat landscape, with education organizations attracting proportionally less attention than in the previous period.
Flat volume: Campaign presence moved from 10 out of 36 to 12 out of 114 observed campaign activity updates period over period. Monthly counts remained in a narrow 3 to 5 range. 10 to 14 education sector campaigns over the next 90 days is a plausible baseline estimate, with no indication of acceleration.
Concentrated actor profile: MISSION2074 and Lazarus Group account for the majority of observed campaigns. The actor set is narrow and exclusively state-sponsored, with no significant financially motivated presence. This points to sustained but specialized interest in research output and institutional data rather than broad opportunistic targeting.
Research data exposure: Open-source database software and SQL server performance monitoring tools both feature across multiple campaigns, alongside file hosting and content management systems. Institutions with externally accessible research data stores, unpatched database infrastructure, or exposed content platforms face the highest immediate risk. Operating systems ranking above web applications indicates objectives focused on host access rather than perimeter application exploitation alone.
Geographic targeting: The United States and Japan lead in victim count across a comparatively narrow 23-country footprint, concentrated on countries with significant research university sectors. North America and the Indo-Pacific corridor are expected to remain primary target zones.
Risk qualification: The Elevated rating reflects sustained targeting by capable state-sponsored actors against a sector holding valuable research data, tempered by flat volume and a declining share of overall campaign activity. A shift upward would require either renewed volume growth or the entry of financially motivated actors, neither of which is present in the current data.
REPORTED CYBER INCIDENTS
Over the past 90 days, DeCYFIR and DeTCT platforms tracked 699 cyber incidents reported publicly. We could identify the industry for 518 of these incidents.
Education industry was detected in just 5 incident, which equals 0.97% of the incidents where we knew the industry, ranking 11th out of 14 industries.
THREAT BRIEF
Education appeared in five incidents across the quarter, placing it near the bottom of the sector ranking. That is a sharp fall from the preceding quarter, and the fall is the most important thing to understand about this sector right now. From April to late June, education was a frequently reported sector in the dataset, driven by the Instructure and Canvas compromise that ShinyHunters claimed across thousands of schools and universities, forced exam rescheduling at multiple institutions, prompted a congressional investigation, and ended with a paid ransom. That cluster also carried the University of Nottingham breach and the Oracle PeopleSoft zero-day campaign that swept through higher education. None of that continued into this quarter. What the current window shows is not a safer sector, it is the quiet period after a single large platform compromise has finished generating coverage.
Credential theft is the defining technique of the current period, appearing in more than half of the sector’s incidents. This is consistent across very different actor types, from state espionage to opportunistic crime, and it reflects what value universities hold: large populations of loosely governed accounts, federated identity spanning research, administration and student services, and a culture of external collaboration that makes unusual access patterns hard to distinguish from normal work.
Academic research is under sustained state-sponsored targeting. A China-linked group exploited a Roundcube webmail flaw to spy on academic researchers in the United States and Canada. The United States charged individuals connected to Iran’s Mabna Institute over a long-running campaign against government agencies and universities, framed explicitly around intellectual property theft valued in the billions. Attackers were resident inside South Korea’s diplomat training system for nine months before detection. The pattern that unites these is patience rather than disruption: the objective is research output, correspondence and credentials, and the intrusions are designed to persist rather than to extract a payment.
Operational disruption still occurs but is less prominent than in the previous quarter. The University of Texas at San Antonio took systems offline after a cyberattack, and the University of Munich suffered an incident potentially exposing student financial data. Both follow the familiar shape of an institution losing services during term time with limited ability to isolate affected systems quickly.
The supplier remains the sector’s structural weak point. Mathspace disclosed a breach affecting over a million people, an education technology provider rather than a school, which is exactly the pattern that defined the Instructure incident and that research during the period characterised as edtech attackers shifting from schools to their software suppliers. Schools and universities concentrate their student data in a small number of learning platforms, assessment tools and student information systems. A single vendor compromise therefore produces losses across thousands of institutions simultaneously, and the institutions themselves have little visibility and less leverage.
One further item is worth noting for its novelty rather than its scale. Criminals compromised Brazilian government servers, including academic infrastructure, to host phishing sites. Education domains carry inherited trust and good reputation scores, which makes them valuable as infrastructure for attacks aimed at entirely different targets. The institution in that case is not the victim in any conventional sense, it is the delivery platform.
Caveat on the data. Five incidents is a thin base, and public reporting on this sector is uneven. Coverage concentrates on large Western universities and on breaches large enough to trigger notification. School districts, further education colleges and institutions outside North America and Western Europe are rarely named. The quarter-on-quarter fall is real in reporting terms, but it measures the end of one dominant news cycle rather than a change in underlying exposure, and the structural weaknesses that made the Canvas incident possible remain in place.
Risk Level Indicator: 6.2 – Elevated
FORWARD ASSESSMENT
Threat level for the education sector over the next 90 days is assessed as an elevated risk. The low incident count reflects the end of a dominant news cycle rather than a change in underlying exposure. The structural weaknesses that made large-scale platform compromises possible this year remain in place.
The following developments are anticipated based on current trends, actor capabilities, and operational patterns:
Credential Theft as Persistent Baseline. Credential theft is the defining technique across the sector regardless of actor type, from state espionage to opportunistic crime. Universities hold large populations of loosely governed accounts spanning research, administration, and student services, with external collaboration patterns that make unusual access hard to distinguish from normal activity. This structural condition does not change between quarters.
State-Sponsored Academic Espionage. China-linked and Iranian-linked actors both demonstrated active interest in academic research output and institutional credentials during the period. The objective is persistence and collection rather than disruption, meaning intrusions are designed to go undetected. Nine months of undetected access in the South Korean diplomat training case illustrates the dwell times involved. This targeting pattern is structural and will continue.
EdTech Supplier as Primary Attack Surface. The Mathspace breach affecting over a million people confirms that edtech suppliers, not institutions, are where large-scale losses originate. Schools and universities concentrate student data in a small number of learning platforms and assessment tools. A single vendor compromise produces losses across thousands of institutions simultaneously, and the institutions themselves have limited visibility into their suppliers’ security posture.
Education Infrastructure as Delivery Platform. Education domains carry inherited trust and strong reputation scores, making them attractive hosting infrastructure for phishing campaigns aimed at entirely different targets. This risk does not require the institution to be the intended victim and is largely invisible to standard incident reporting.
Operational Disruption During Term Time. Ransomware and cyberattacks against universities during term time produce disproportionate operational impact given limited ability to isolate affected systems quickly. This pattern is consistent and will recur regardless of overall sector volume.
UNDERGROUND & DARK WEB CHATTER ANALYSIS
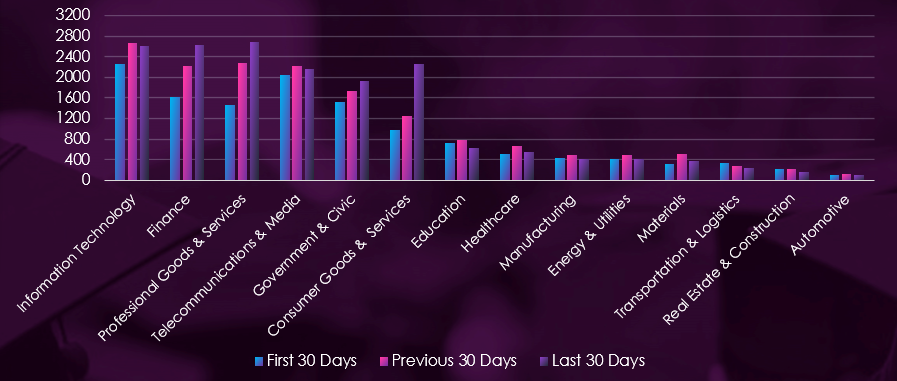
Over the past 90 days, CYFIRMA’s telemetry has identified 2,134 mentions of education organizations out of a total of 46,019 industry-linked mentions. This is from total of 300k+ posts across various underground and dark web channels and forums.
Education organizations landed on 7th place out of 14 industries in last 90 days with share of 4.64% of all detected industry-linked chatter.
Below is a breakdown by 30 days periods of all mentions.
GLOBAL CHATTER CATEGORIES
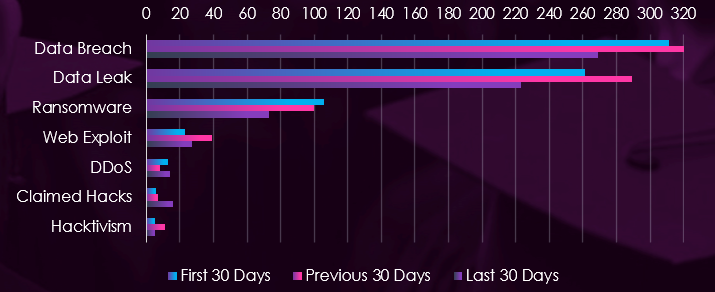
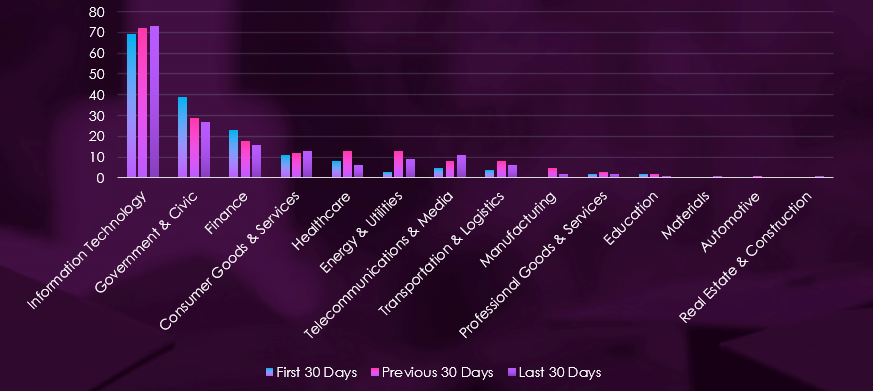
Underground & dark web chatter related to the education sector over the last 90 days is dominated by data breach and data leak discussions, both of which rise slightly before falling below their opening levels in the final period. Ransomware declines steadily across all three periods. Web exploit volumes rise then fall back. DDoS and hacktivism remain low and broadly flat. Claimed hacks are the only category showing sustained growth, rising across the window from a low base. Total sector chatter declines over the period, against steep growth in most other sectors.
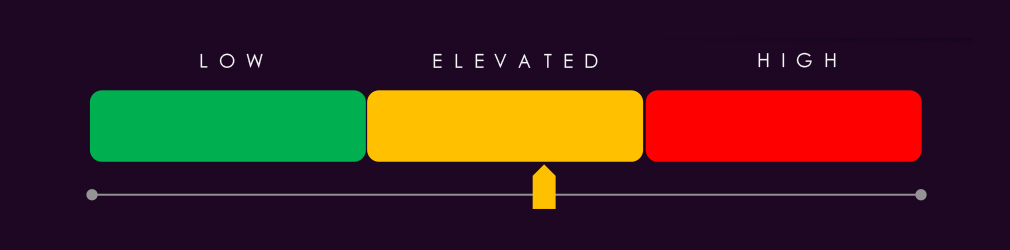
Risk Level Indicator: 5.8 – Elevated
FORWARD ASSESSMENT
Education chatter declines across the window while most sectors in this report rose steeply. Every major category, breach, leak and ransomware, is lower in the final period than the first. The elevated rather than high rating reflects that absence of escalation, qualified by the high intrinsic value of the data this sector holds.
Broad Decline Across Primary Categories: Breach, leak, and ransomware all fall in the final period. Against a report-wide pattern of growth in breach and leak volumes, this sector moves the other way, which is a genuine divergence rather than a lower rate of increase.
Seasonal Effect as a Competing Explanation: The window covers the northern hemisphere summer break, when institutional activity and system usage are reduced. Lower operational tempo plausibly produces both fewer incidents and less discussion of them, making the decline temporary rather than structural. The next reporting period, covering the academic return, will distinguish between the two.
Data Value Independent of Current Volume: Education institutions hold student identity records, financial aid data, health records for minors, and research material with commercial or state interest. Identity records for young people carry extended fraud value because they are unmonitored for years, which sustains demand regardless of short-term chatter volume.
Claimed Hacks as the Sole Growth Category: Rising steadily while everything else declines. The base is low enough that this should not be over-read, but a rise in public intrusion claims against falling breach and leak discussion suggests activity aimed at visibility rather than data monetisation, a pattern associated with less organised actors.
Ransomware Decline Against Structural Exposure: Ransomware falls consistently across all three periods. Education remains structurally exposed through constrained security budgets, decentralised IT across faculties, and hard deadlines around term start and examinations. Declining chatter does not reduce that exposure, and the sector’s tolerance for disruption is lowest at precisely the point this window ends.
Web Exploit, DDoS and Hacktivism: All remain low with no sustained direction. Education has historically attracted student-originated DDoS tied to the academic calendar, and current low volumes coincide with the period when that activity is least likely.
VULNERABILITIES ANALYSIS
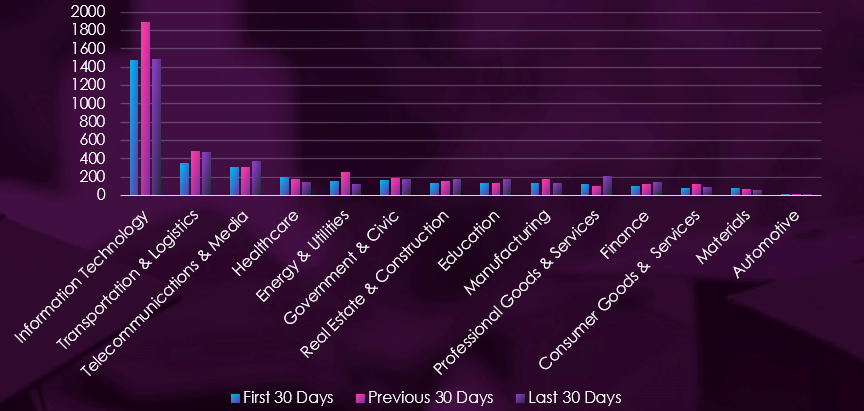
Over the past 90 days, CYFIRMA’s telemetry has identified 448 mentions of education organizations out of a total of 11,537 industry mentions.
Education organizations ranked 8th out of 14 industries in the last 90 days, with a share of 3.88% of all detected industry-linked vulnerabilities.
Below is a breakdown by 30-day periods of all mentions.
VULNERABILITY CATEGORIES
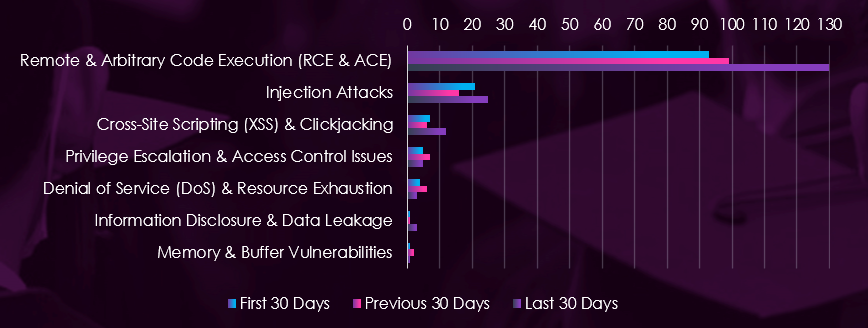
Reported CVEs in the education sector over the last 90 days are dominated by remote and arbitrary code execution, which rises across all three periods and accounts for roughly three quarters of final-period volume. Injection attacks dip mid-period before rising above their opening level. Cross-site scripting nearly doubles in the final period. Privilege escalation, denial of service, information disclosure, and memory and buffer vulnerabilities all remain minimal with no sustained direction. Total sector volume increases in each period.
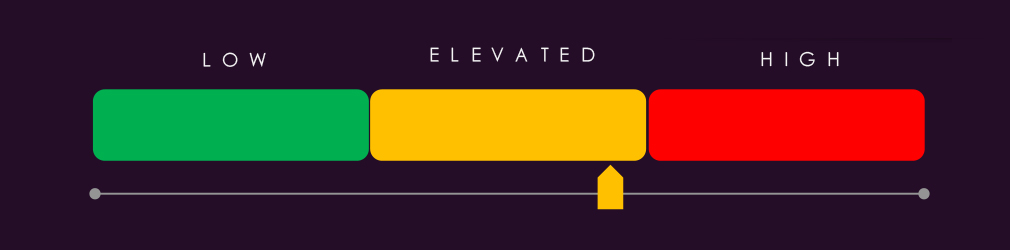
Risk Level Indicator: 7.0 – Elevated
FORWARD ASSESSMENT
Education shows a vulnerability profile concentrated in remote code execution, which rises in every period and accounts for the large majority of volume. Total disclosure count increases across the window. This runs opposite to the sector’s underground chatter, which declined over the same period, indicating exposure is growing while criminal discussion of the sector falls.
Remote & Arbitrary Code Execution: Dominant throughout and rising consistently. Education institutions run large internet-facing estates including learning management systems, student information systems, library and research platforms, remote access gateways and departmental web services. Unauthenticated code execution against this class of system is the primary exposure, and much of it is externally reachable by design to support remote study.
Decentralised Estate as a Structural Constraint: Universities and larger institutions typically operate federated IT, with faculties and departments running systems outside central control. Asset inventory is incomplete in this model, which means a disclosure cannot be reliably mapped to affected systems, and remediation coverage is uncertain even when patching is prompt.
Rising Disclosures Against Falling Chatter: Exposure and criminal interest are moving in opposite directions. The practical implication is that current low chatter volume is not a reliable indicator of reduced risk, and an accumulated pool of unremediated code execution exposure is available if attention returns to the sector.
Injection Attacks and Cross-Site Scripting: Both rose in the final period, injection above its opening level and cross-site scripting nearly doubling. Relevant to student portals, enrolment systems and public-facing institutional sites, where client-side and application-layer flaws support credential capture against accounts that frequently hold access to identity and financial aid data.
Patch Timing Against the Academic Calendar: Remediation capacity in this sector is uneven across the year. Change windows narrow sharply at term start and during examination periods, when system availability requirements are highest. Disclosures arriving immediately before those points carry longer exposure durations than the same disclosures would elsewhere.
Remaining Categories: Privilege escalation, denial of service, information disclosure and memory and buffer vulnerabilities all remain minimal across the window and do not currently shape the sector’s risk profile.
RANSOMWARE VICTIMOLOGY
In the past 90 days, CYFIRMA has identified 85 verified ransomware victims in education organizations. This accounts for 3.08% of all 2,761 ransomware victims during the same period, placing this sector 11th out of 14 industries.
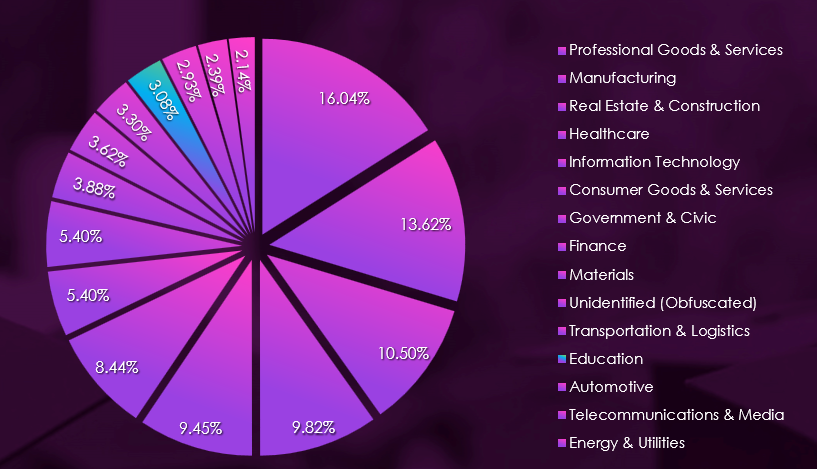
Furthermore, a quarterly comparison shows that the number of victims in education organizations has grown. It went up from 71 to 85 victims, a significant 19.7% increase. The overall interest, represented by share, however, dropped mildly from 3.14% to 3.08% of all victims.
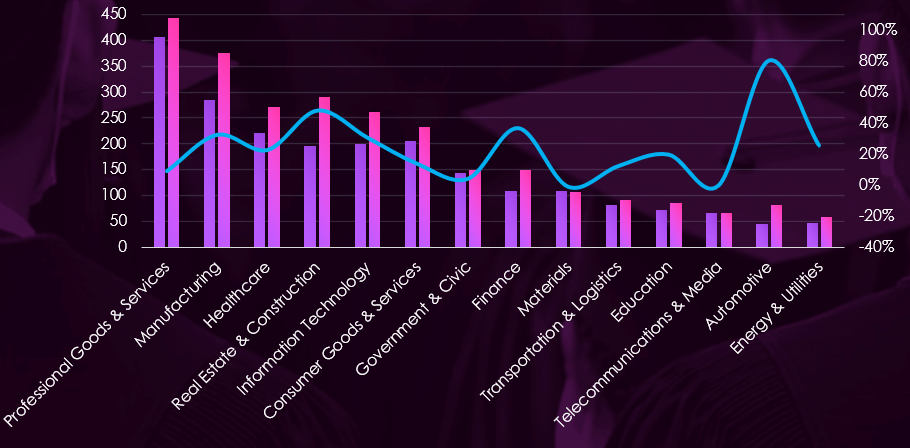
INDUSTRY MONTHLY ACTIVITY CHART
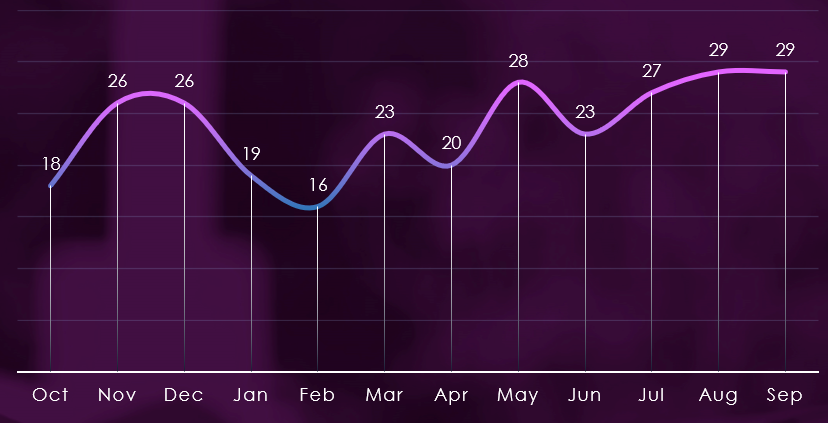
Monthly activity recorded a major dip during early 2026, then slightly grew across months until July, August, and September, when activity plateaued.
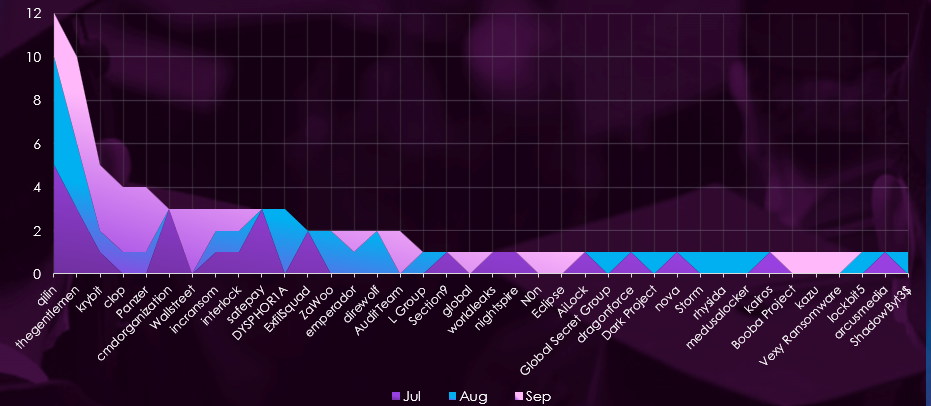
No single group dominated the period. Qilin and Thegentlemen led with 12 and 10 victims, respectively, spread evenly across all three months rather than concentrated in any one. Krybit built steadily from one victim in July to three in September.
Cl0p, Panzer, and Wallstreet concentrated their activity in September, while Cmdorganization, Safepay, and ExfilSquad appeared only in July. Roughly half the active gangs recorded a single victim across the entire period. This distribution is consistent with opportunistic targeting by a wide, rotating set of actors rather than deliberate campaigns against the sector.
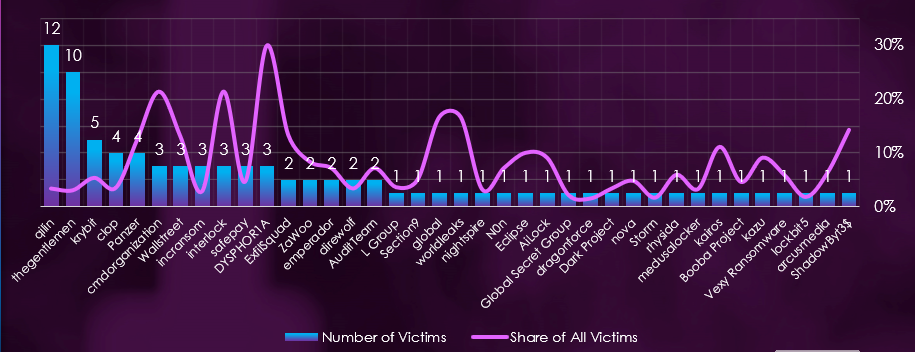
Out of the 99 gangs, 38 recorded victims in the education industry in the last 90 days, representing a 38% participation rate.
Qilin and Thegentlemen had the highest numbers of victims, but both recorded very low shares of their overall activity in this sector, at 3.3% and 3.0%, respectively. Neither treats education as a priority target.
DYSPHOR1A recorded 30.0% of its victims in this sector, the highest share in the active set, followed by Cmdorganization and Interlock at 21.4% each. All are low-volume groups.
On average, gangs active in this industry recorded an 8.1% share of their victims from this industry. That is about 1 in 12 victims.
VICTIMS PER INDUSTRY SECTOR
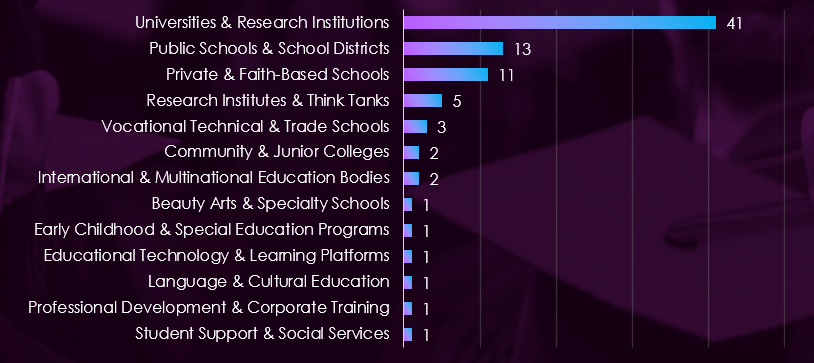
Universities & Research Institutions accounted for almost half of all sector victims, far ahead of any other subsector. Large institutions combine sprawling, federated networks with weak central security control and hold research data, intellectual property, and student records that carry extortion value beyond operational disruption alone.
Public Schools & School Districts and Private & Faith-Based Schools followed at a considerable distance. The remaining subsectors recorded single-digit counts, with most at one or two victims.
GEOGRAPHIC DISTRIBUTION OF VICTIMS
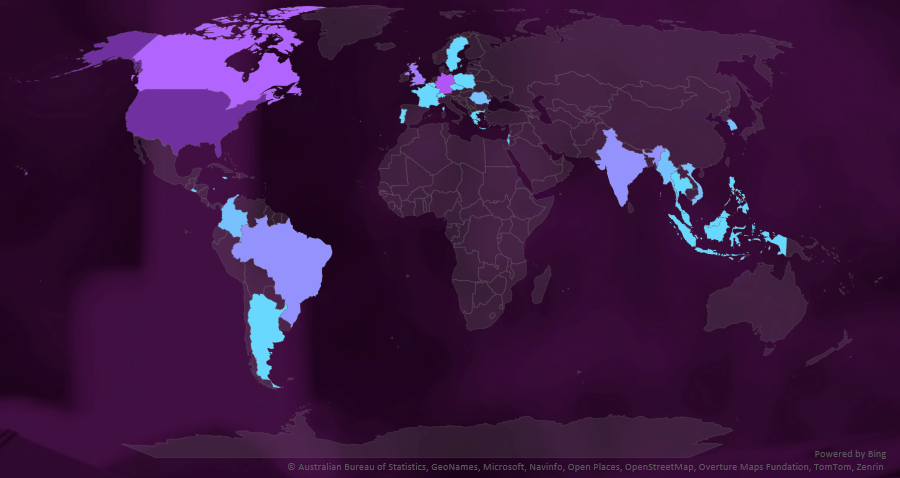
The geographic distribution heatmap underscores the widespread impact of ransomware, highlighting the countries where victims in this industry have been recorded.
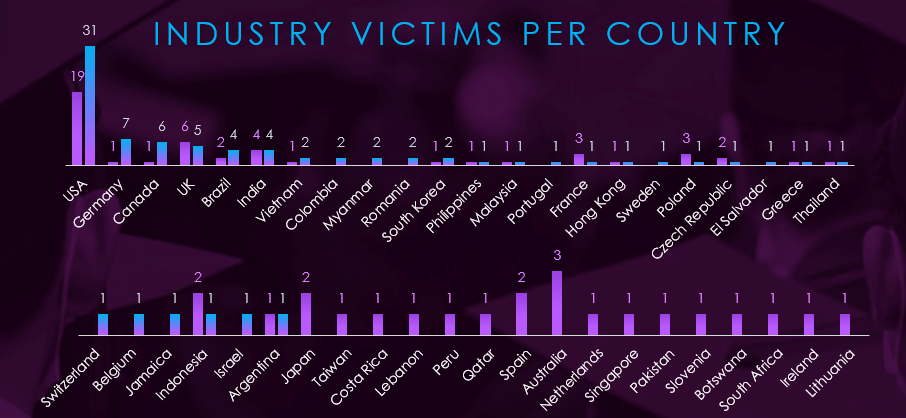
Education victimology shows the USA as the most targeted, accounting for 37% of all victims.
Remaining activity is distributed among 27 countries for 53 victims.
Germany and Canada recorded the highest elevations in the last 90 days, rising by 6 and 5 victims, respectively, followed by Brazil, Colombia, Myanmar, and Romania.
Australia, France, Poland, Japan, and Spain saw the largest declines, all dropping out of the dataset entirely.
In the last 90 days, 28 countries recorded education victims, 6 fewer than the 34 countries in the previous period.
Risk Level Indicator: 6.0– Elevated
FORWARD ASSESSMENT
The Education sector threat landscape is expected to remain elevated through the next 90 days. Victim volume grew 19.7% quarter-on-quarter from 71 to 85, though sector share fell slightly from 3.14% to 3.08% as the overall victim pool grew faster. The sector ranks 11th of 14 industries. The rating reflects consistent but low-intensity targeting rather than an escalating threat.
Volume outlook: Monthly activity has climbed gradually since the February low of 16, plateauing at 27 to 29 victims across July, August, and September. The plateau is the most notable feature, indicating a new baseline rather than a continuing climb. A range of 85 to 95 victims over the next 90 days is the most plausible outcome.
Actor behaviour: 38 of 99 active gangs recorded education victims, a 38% participation rate that is low relative to commercial sectors. No group dominates. Qilin and Thegentlemen lead by volume while directing only around 3% of their activity here, and roughly half the active gangs recorded a single victim. This distribution points to opportunistic selection driven by ease of access rather than deliberate sector focus, and is likely to persist.
Specialist targeting risk: The average sector share across active gangs is 8.1%, roughly one in 12 victims, the lowest ratio observed across recent sector reporting. DYSPHOR1A at 30.0%, Cmdorganization at 21.4%, and Interlock at 21.4% are the only groups showing meaningful proportional focus, and all operate at low volume. No high-volume specialist is currently active against this sector.
Geographic targeting: Country coverage contracted from 34 to 28 even as total volume rose, indicating concentration rather than spread. US victims rose from 19 to 31, taking share to 37%. Germany and Canada recorded the sharpest elevations. Australia, France, Poland, Japan, and Spain all dropped out entirely, and the narrowing of the affected footprint is expected to continue if current actor behaviour holds.
Subsector risk: Universities & Research Institutions represent the dominant exposure point at roughly half of all sector victims. Decentralised IT governance across faculties and research groups makes consistent control enforcement difficult, and research data provides extortion leverage independent of operational disruption. School districts face a different profile, with limited security budgets and acute public pressure when term-time operations are interrupted.
APT Campaigns (Elevated): Education featured in 12 of 114 campaign activity updates (11%), rising only marginally from 10 in absolute terms, while share fell from 28% against a campaign pool that more than tripled. This is flat targeting against a rapidly expanding landscape. MISSION2074 recorded the highest campaign count, with Lazarus Group second, and the actor set is narrow and exclusively state-sponsored, with no significant financially motivated presence. That composition is unique in this series and points to intelligence collection against research output rather than monetisation. Operating systems ranked above web applications, an inversion of the pattern in most sectors indicating host-level compromise as a primary objective, while open-source database software and SQL monitoring tools feature across multiple campaigns alongside file hosting and content management. Victims span 23 countries, the narrowest footprint recorded, concentrated on countries with significant research university sectors.
Reported Cyber Incidents (Elevated): Five incidents placed education near the bottom of the ranking, a sharp fall from the preceding quarter that measures the end of a dominant news cycle rather than reduced exposure. The Instructure and Canvas compromise drove the previous quarter’s volume, and none of it continued into this window. Credential theft is the defining technique of the current period, appearing in more than half of the sector’s incidents across very different actor types. State-sponsored academic espionage is sustained and patient. A China-linked group exploited a Roundcube flaw against researchers in the United States and Canada, the United States charged individuals connected to Iran’s Mabna Institute over intellectual property theft valued in billions, and attackers were resident inside South Korea’s diplomat training system for nine months before detection. The Mathspace breach affecting over a million people confirms edtech suppliers as the primary large-scale loss point.
Underground & Dark Web Chatter (Elevated): The sector placed 7th of 14 at 4.64% of industry-linked chatter with 2,134 mentions, and declined across the window while most sectors rose steeply. Breach, leak and ransomware are all lower in the final period than the first, a genuine divergence rather than a slower rate of increase. The window covers the northern hemisphere summer break, and reduced institutional activity plausibly produces both fewer incidents and less discussion, though the final period extends into the academic return, which limits how much seasonality explains. Claimed hacks are the only category showing sustained growth, suggesting activity aimed at visibility rather than data monetisation. Education holds student identity records, financial aid data, and health records for minors, and identity records for young people carry extended fraud value because they go unmonitored for years.
Vulnerabilities (Elevated): The sector ranked 8th of 14 at 3.88% of industry-linked disclosures across 448 mentions, with total volume rising in every period. Remote code execution rises consistently and accounts for roughly three-quarters of final-period volume, against large internet-facing estates including learning management systems, student information systems, library and research platforms and remote access gateways, much of it externally reachable by design to support remote study. Decentralised IT is the structural constraint, since faculties and departments run systems outside central control, leaving asset inventory incomplete and remediation coverage uncertain even when patching is prompt. Exposure and criminal interest are moving in opposite directions, so current low chatter volume is not a reliable indicator of reduced risk, and an accumulated pool of unremediated code execution exposure is available if attention returns.
Ransomware (Elevated): 85 victims, up 19.7% from 71, ranking 11th of 14, with share falling slightly from 3.14% to 3.08% as the overall pool grew faster. Monthly activity climbed gradually from the February low and plateaued across July, August, and September, indicating a new baseline rather than a continuing climb. No group dominates. Qilin and Thegentlemen led by volume while directing only around 3% of their activity here, and roughly half the active gangs recorded a single victim, pointing to opportunistic selection driven by ease of access rather than deliberate sector focus. The 8.1% average sector share across active gangs is the lowest ratio observed across recent reporting. Universities & Research Institutions accounted for almost half of all victims. Country coverage contracted from 34 to 28 even as volume rose.
