
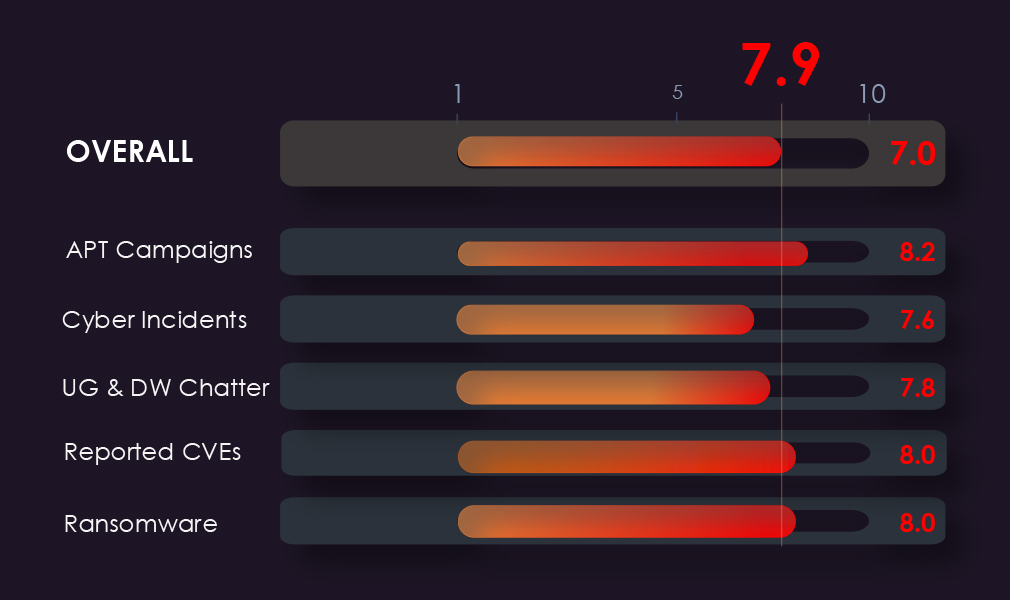
APT Campaigns – 8.2
46 of 88 campaigns (52%), more than tripling in absolute terms from 14. Broadest actor set recorded in any sector, spanning six state campaigns plus three cybercriminal clusters. Lazarus Group matching the leading China-linked actors is the strongest DPRK presence this period. Remote access and network persistence targeting throughout.
Cyber Incidents – 7.6
201 incidents, 1st of 14 by a wide margin. Supply chain compromise appeared 35 times and was the only technique sustained across all three periods, with no dominant actor indicating broad adoption. Credential infrastructure hit from four distinct angles simultaneously. Russia accounted for 10 of 22 attributed incidents.
Dark Web Chatter – 7.8
2,706 mentions, 1st of 14 at 14.26%. Breach and leak chatter rose across all three periods with leak volume more than doubling, against a declining sector-wide backdrop. Claim-based and disruption categories retreated as data categories climbed, pointing to quiet acquisition.
Vulnerabilities – 8.0
1,183 mentions, 1st of 14 at 38.30%, with disclosure volume more than doubling and every major category rising. RCE tripled with no plateau against internet-facing infrastructure. These are the vulnerabilities every other sector inherits without control over the affected components.
Ransomware – 8.0
236 victims, up 12.4% Q-on-Q with share rising and July hitting a period high of 90. 59% gang participation among the highest observed, and a 20.1% average sector share across active gangs is the highest cross-sector ratio in recent reporting. Direwolf entered in August with 18 victims and a 42.9% focus.
The CYFIRMA Industry Report delivers original cybersecurity insights and telemetry-driven statistics of global industries, covering one sector each week for a quarter. This report focuses on the information technology sector, presenting key trends and statistics in an engaging infographic format.
Welcome to the CYFIRMA infographic industry report, where we delve into the external threat landscape of the information technology industry over the past three months. This report provides valuable insights and data-driven statistics, delivering a concise analysis of attack campaigns, public reports, underground & dark web chatter, vulnerabilities, and ransomware incidents targeting information technology organizations.
We aim to present an industry-specific overview in a convenient, engaging, and informative format. Leveraging our cutting-edge platform telemetry and the expertise of our analysts, we bring you actionable intelligence to stay ahead in the cybersecurity landscape.
CYFIRMA delivers pre-emptive cybersecurity, cyber threat intelligence, and external threat landscape management through its platforms, DeCYFIR and DeTCT. These platforms have been purpose-built over many years to continuously collect, correlate, and analyse large volumes of external threat data, combining proprietary intelligence automation with deep, hands-on cyber threat research.
For the purpose of this report, the analysis draws on intelligence generated from CYFIRMA’s platforms. The data referenced has been processed through automated correlation and enrichment mechanisms, informed and validated by human-led research and investigative expertise, and sourced from both structured and unstructured external intelligence channels.
While this report contains data collected and processed by our in-house AI and ML, all charts, statistics, and analyses are done by human CYFIRMA CTI analysts to ensure the highest quality and provide accurate insights.
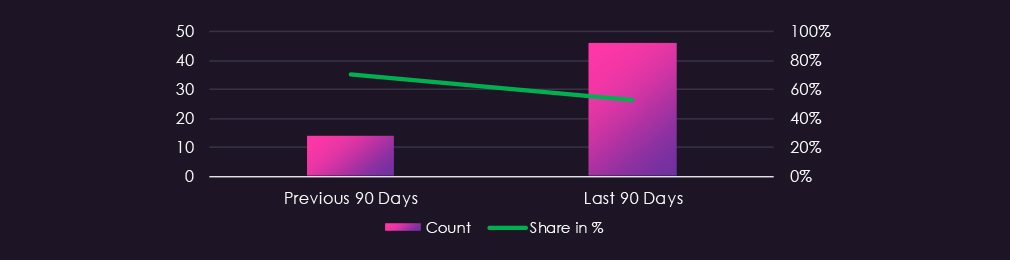
Information technology organizations featured in 46 out of the 88 campaign updates, which is a presence in 52% of all campaigns, a significant jump from the previous period where IT organizations were present in 14 out of 20 campaigns. However, a decline from presence in 70% of observed campaigns.
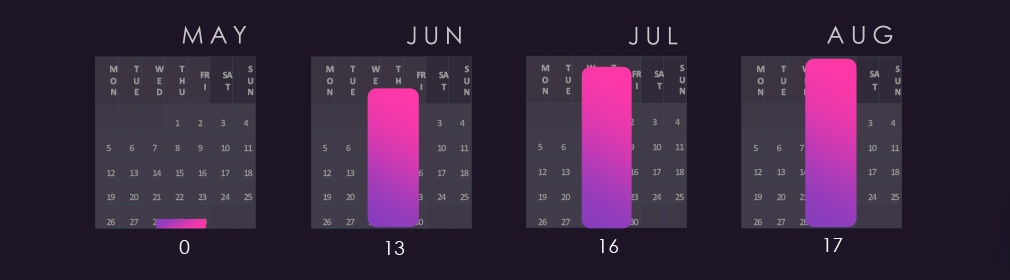
APT activity targeting Information technology has been continuous and increasing. Monthly campaign counts rose consistently across the period, with most campaigns remaining active and updated with new detections as recently as August.
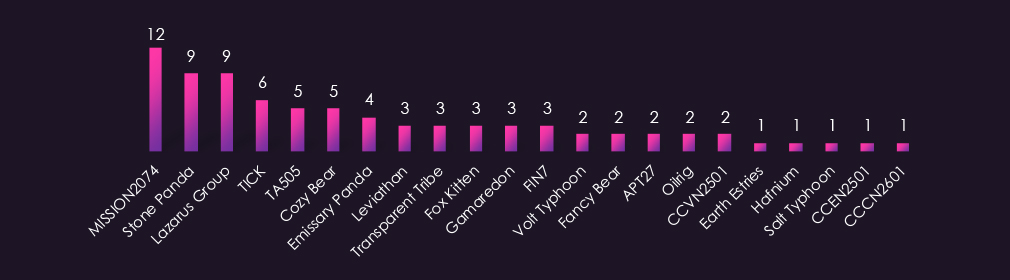
Observed APT campaigns are dominated by suspected China-linked, state-sponsored actors, with MISSION2074 recording the highest campaign count, followed by Stone Panda. TICK, Emissary Panda, Leviathan, Volt Typhoon, APT27, Earth Estries, Hafnium, and Salt Typhoon provide additional China-aligned representation.
North Korea-associated Lazarus Group matches Stone Panda in campaign count, the strongest DPRK presence recorded across the reporting period. Russia-linked Cozy Bear, Gamaredon, and Fancy Bear all feature, alongside Iran-linked Fox Kitten and OilRig, and Pakistan-linked Transparent Tribe. Financially motivated actors TA505 and FIN7 appear across multiple campaigns, with Vietnamese-speaking, English-speaking, and Chinese cybercriminal groups also recorded.
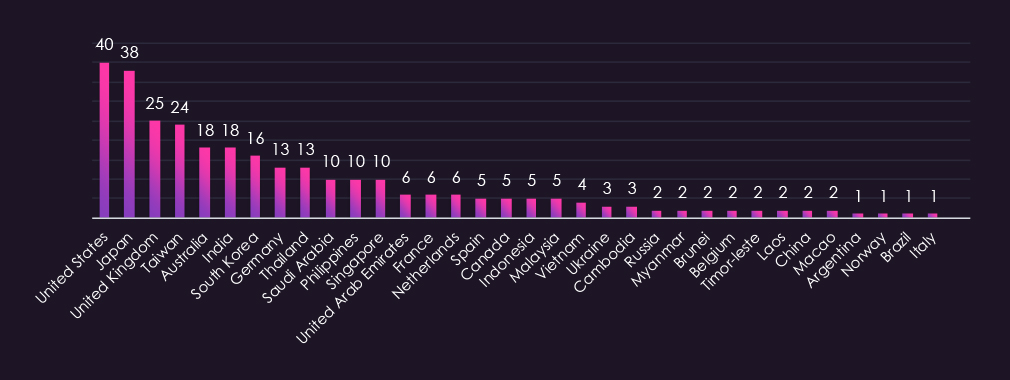
Victim distribution spans 34 countries, with the United States and Japan recording the highest victim counts by a considerable margin, followed by the United Kingdom and Taiwan. Australia, India, and South Korea also feature prominently, reflecting concentrated targeting across major technology markets in North America and the Indo-Pacific.
Germany and Thailand lead the next tier, with Saudi Arabia, the Philippines, and Singapore also recording significant counts. European presence spans France, the Netherlands, Spain, Ukraine, Belgium, Norway, and Italy, consistent with the Russia-linked actors observed this period.
Southeast Asian representation is broad, covering Thailand, the Philippines, Singapore, Indonesia, Malaysia, Vietnam, Cambodia, Myanmar, Brunei, Timor-Leste, and Laos. Remaining victims are spread across the Middle East, Latin America, and East Asia.
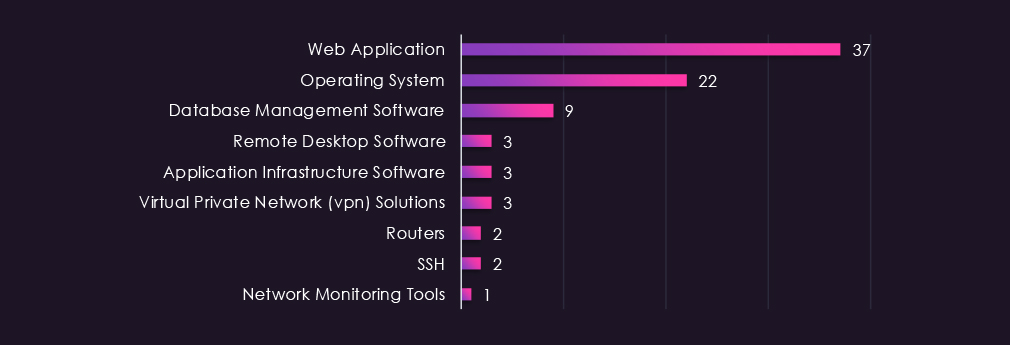
Web applications account for the highest number of observed attacks by a wide margin, followed by operating systems. Database management software features across nine campaigns, pointing to data exfiltration as a consistent objective alongside initial access and host-level compromise.
Remote desktop software, application infrastructure software, and VPN solutions each appear across three campaigns, with routers, SSH, and network monitoring tools also recorded. This combination points to sustained threat actor interest in remote access and network-level persistence within technology sector environments.
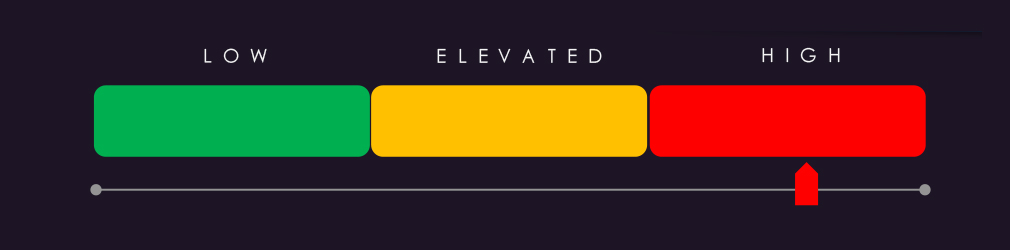
Based on observed trajectory across the two reporting periods, the information technology sector external threat landscape is expected to remain at High through the next 90 days. Campaign presence more than tripled in absolute terms from 14 to 46, and monthly activity rose consistently across June, July, and August, indicating accelerating rather than plateauing targeting.
Sustained volume: Campaign presence grew from 14 out of 20 to 46 out of 88 observed campaigns period over period. Monthly counts increased month over month from 13 to 16 to 17, with campaigns remaining active and receiving new detections as recently as August. 42 to 50 information technology sector campaigns over the next 90 days is a plausible baseline estimate.
Dominant actor continuity: MISSION2074, Stone Panda, and Lazarus Group recorded the highest campaign counts and show no indicators of reduced tempo. The scale of Lazarus Group activity is notable, matching the leading China-linked actors and indicating sustained DPRK interest in technology sector targets alongside the dominant espionage-driven cluster.
Supply chain exposure: Technology sector compromise carries downstream risk beyond the sector itself, given the concentration of software vendors, managed service providers, and infrastructure operators. Web application and database targeting at this volume raises the likelihood of access being leveraged against downstream customer environments.
Geographic targeting: The United States and Japan lead in victim count by a considerable margin, followed by the United Kingdom and Taiwan. North America and the Indo-Pacific corridor are expected to remain primary target zones, with continued exposure across Western Europe and Southeast Asian technology hubs.
Multi-actor threat profile: China-linked, Russia-linked, North Korean, Iranian, Pakistani, and financially motivated actors all feature this period, alongside Vietnamese-speaking, English-speaking, and Chinese cybercriminal groups. Defenders should prioritize TTP-based detection over actor-specific IOC tracking given the breadth of actor representation and the overlap in targeted technologies.
Over the past 90 days, DeCYFIR and DeTCT platforms tracked 687 cyber incidents reported publicly. We could identify the industry for 511 of these incidents (74%).
The information technology industry was detected in 201 incidents, which equals 39% of the incidents where we knew the industry, ranking 1st out of 14 industries.
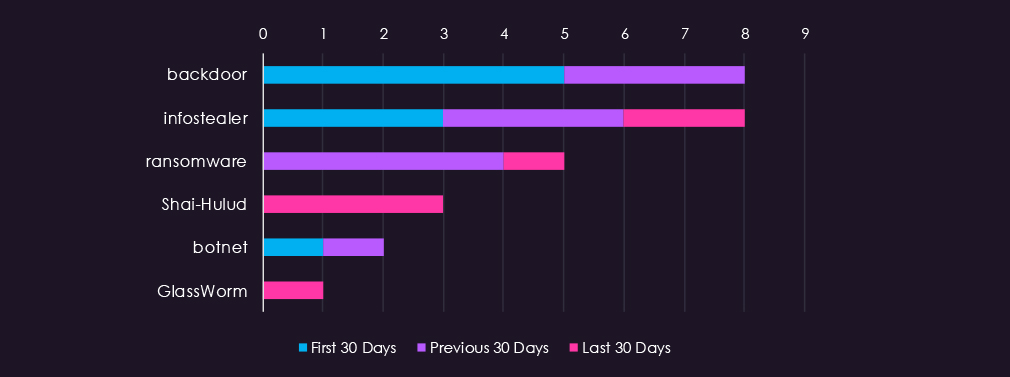
Backdoor and infostealer were the most frequently identified tools, each appearing across multiple periods, with backdoor concentrated in the first and previous 30 days and infostealer distributed more evenly. Ransomware appeared primarily in the previous 30 days. Shai-Hulud appeared three times, entirely in the last 30 days, indicating late-period emergence. Botnet activity was identified in the first and previous 30 days, with no activity in the most recent period. GlassWorm appeared once in the last 30 days.
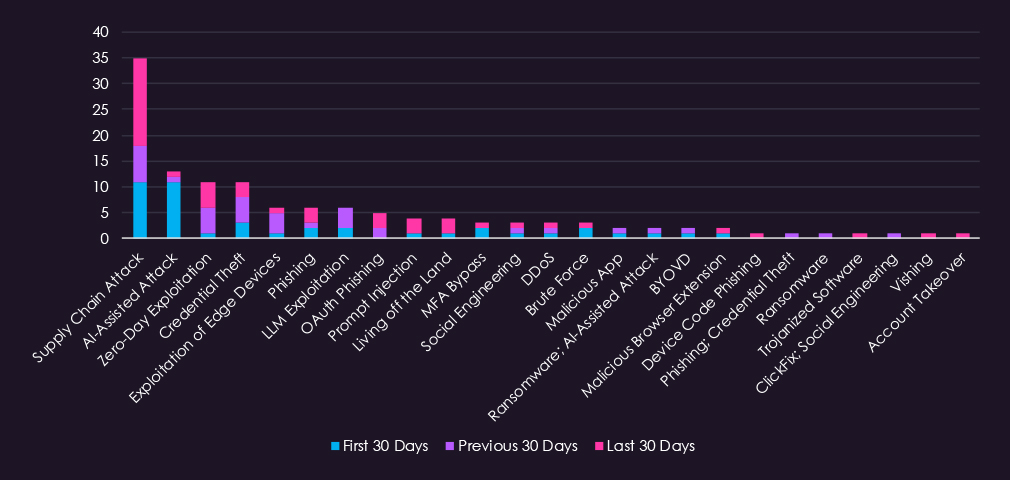
Supply chain attacks dominated the period, appearing consistently across all three windows and accounting for the largest share of identified techniques. AI-assisted attacks were heavily concentrated in the first 30 days, suggesting an early-period campaign that did not sustain into later windows. Zero-day exploitation and credential theft each appeared consistently across all three periods, indicating persistent use throughout the reporting window. LLM exploitation appeared primarily in the previous 30 days, while OAuth phishing and prompt injection were concentrated in the last 30 days, suggesting growing adoption of AI-targeting and identity-based techniques. Living off the land, MFA bypass, and exploitation of edge devices each appeared sporadically. The overall pattern reflects a technically diverse attack landscape with supply chain compromise as the dominant vector and AI-assisted techniques emerging as a secondary trend.
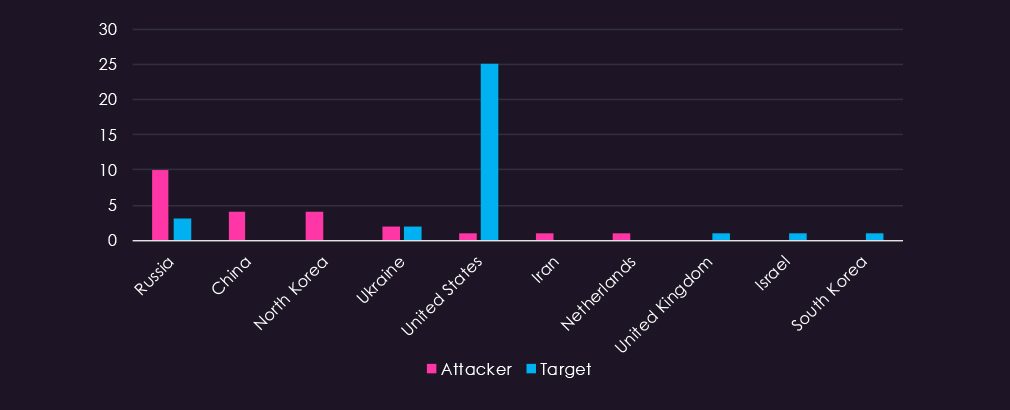
Russia was the most frequently reported attacking country, appearing in 10 incidents, followed by China and North Korea with 4 each. Ukraine, the United States, Iran, and the Netherlands each appeared once or twice as attacking entities. Victim reporting was substantially more complete, with the United States accounting for 25 of the identified targets by a significant margin. Ukraine appeared as both attacker and victim. The United Kingdom, Israel, and South Korea each recorded isolated cases as targets.
Supply chain compromise is the defining structural risk this quarter. With 35 incidents across all three periods, it is the only technique maintaining volume throughout the 90-day window. The pattern reflects deliberate targeting of software distribution pipelines, development toolchains, and third-party integrations rather than direct endpoint compromise. No single actor or campaign dominates the supply chain picture, suggesting broad adoption of the technique across multiple threat groups rather than a concentrated campaign.
AI-assisted attacks produced the quarter’s most striking volume spike. Thirteen incidents clustered heavily in the first 30 days, then collapsed to one per period. This is not a sustained capability deployment. It reads more as a burst of experimentation or a coordinated campaign that ran its course, followed by quiet absorption of those techniques into existing toolkits. LLM exploitation and prompt injection together add a further ten incidents, concentrated in the previous and last 30 days respectively, confirming that AI-targeting techniques are rotating rather than receding.
Credential infrastructure is under sustained pressure from multiple angles. OAuth phishing, device code phishing, MFA bypass, and credential theft collectively account for 18 incidents spread across all three periods. These are not variations of the same attack; they target different points in the authentication chain. The distribution across periods indicates this is baseline tradecraft for IT-sector attackers, not a campaign.
Backdoor and infostealer deployments confirm post-access objectives are intelligence collection and persistence rather than immediate disruption. Backdoor appearing primarily in the first and previous 30 days, followed by Shai-Hulud emerging in the last 30 days, suggests actor rotation or tooling refresh mid-quarter. Ransomware was identified five times but did not dominate, consistent with the broader pattern of IT-sector targeting prioritizing access and data over operational disruption.
Russia accounts for 10 of 22 attributed attacking incidents, the clearest concentration in the dataset. China and North Korea follow at 4 each. Together these three account for all but 4 of the attributed attacking incidents, indicating that state-linked actors, whether directly or through affiliated groups, drive the majority of publicly reported IT-sector targeting. The United States, with 25 victim identifications, is the overwhelmingly primary target.
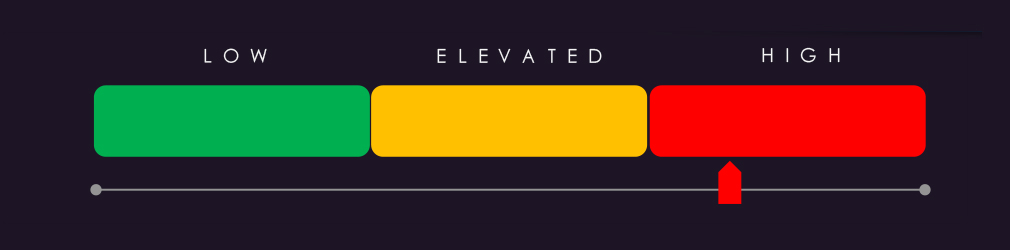
Threat level for the information technology sector over the next 90 days is assessed as high risk. As the most publicly reported sector by nature, some volume inflation is expected; the underlying technique diversity and actor concentration nonetheless support a high-risk assessment.
The following developments are anticipated based on current trends, actor capabilities, and operational patterns:
Supply Chain Compromise as Persistent Baseline. Supply chain attacks maintained volume across all three periods with no sign of reduction. The absence of a single dominant actor or campaign suggests broad adoption across multiple threat groups. This technique is likely to remain the primary structural risk for IT organizations given its effectiveness against both direct targets and downstream customers.
AI-Assisted Attack Rotation. The sharp first-period spike in AI-assisted attacks followed by rapid decline does not indicate this threat has passed. It indicates early campaign completion and absorption of these techniques into standard toolkits. LLM exploitation and prompt injection emerging in later periods confirm AI-targeting techniques are evolving rather than receding, with OAuth phishing and prompt injection likely to increase in the next period.
Credential Infrastructure Under Sustained Pressure. OAuth phishing, MFA bypass, device code phishing, and credential theft collectively maintained presence across all three periods. These target different points in the authentication chain simultaneously, indicating coordinated pressure on identity infrastructure rather than opportunistic single-vector attacks.
State-Linked Actor Concentration. Russia, China, and North Korea together account for the substantial majority of attributed attacking incidents. Russian activity in particular, at 10 attributed incidents, reflects sustained targeting rather than isolated campaigns. Given current geopolitical conditions, this concentration is unlikely to decrease.
Tooling Rotation Mid-Quarter. Backdoor activity concentrated in early periods followed by Shai-Hulud emergence in the last 30 days suggests actor tooling refresh or rotation mid-quarter. This pattern indicates active operational security awareness among threat actors targeting this sector, complicating detection based on known indicators.
Over the past 90 days, CYFIRMA’s telemetry has identified 2,706 mentions of information technology organizations out of a total of 18,975 industry-linked mentions. This is from a total of 300k+ posts across various underground and dark web channels and forums.
Information technology organizations placed in 1st place out of 14 industries in the last 90 days with a share of 14.26% of all detected industry-linked chatter.
Below is a breakdown by 30-day periods of all mentions.
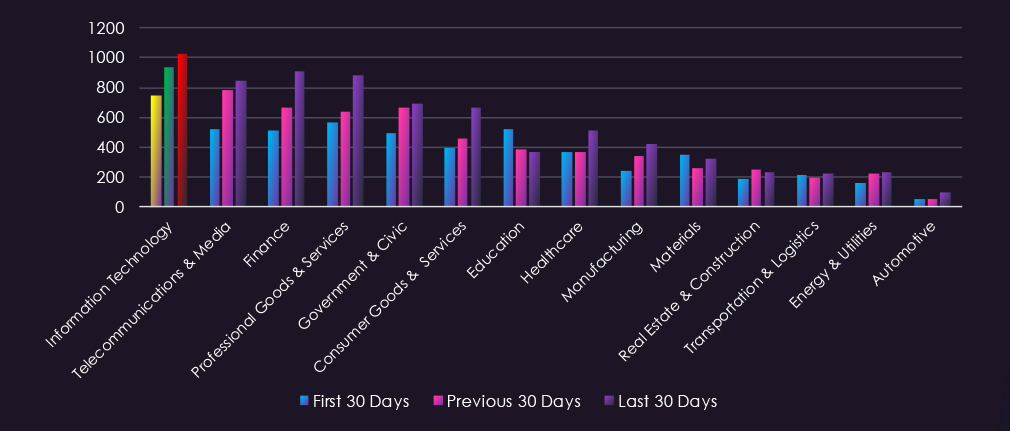
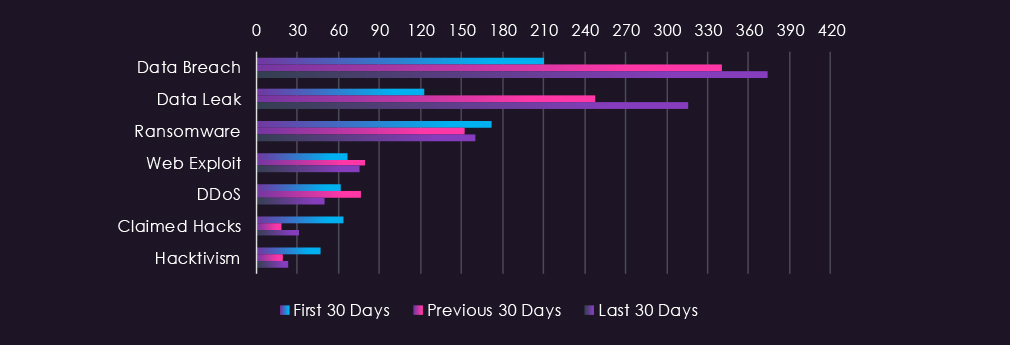
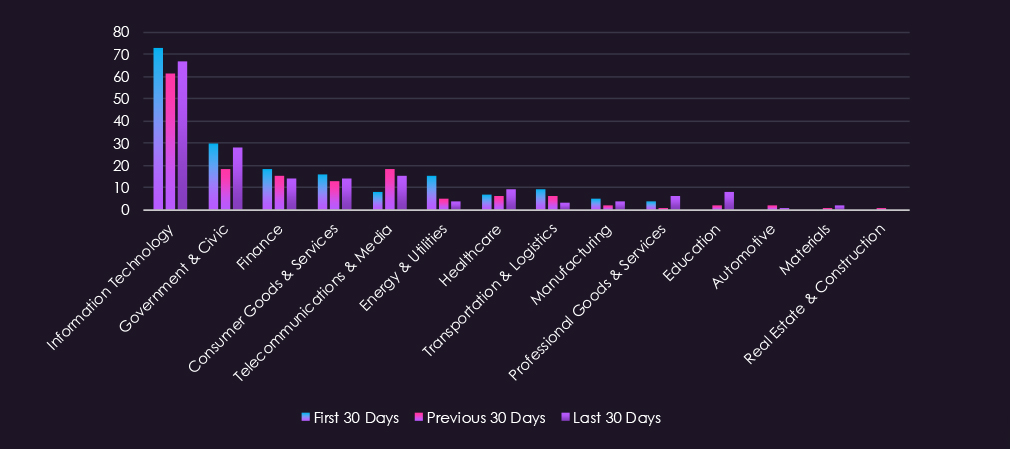
Underground & dark web chatter related to the information technology sector over the last 90 days is dominated by data breach and data leak discussions, both of which rise consistently across all three periods. This runs counter to the declining pattern observed across most other sectors in this report, where breach and leak volumes fell in line with forum disruption and migration dynamics. Ransomware mentions remain broadly stable throughout. Web exploits hold steady at moderate volumes, while DDoS declines in the final period after mid-period elevation. Claimed hacks and hacktivism both drop sharply after the first period and remain at reduced levels.
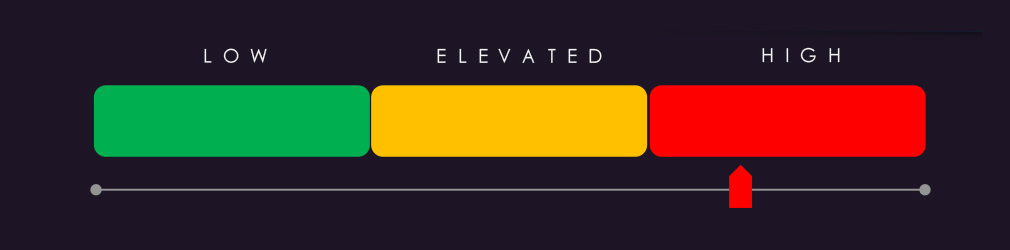
Information technology carries the highest chatter volume of any sector in this report, though this requires qualification. IT products, platforms, and security tooling are the subject matter of underground discussion by default, so mentions accumulate whether the IT organisation is the victim, the vector, or simply the technology being discussed in an attack elsewhere. The directional signal is more credible than the headline number: breach and leak chatter rose across all three periods while most other sectors declined during the same forum disruption window.
Data Breach and Data Leak: Both rise across every period, with leak chatter more than doubling. IT organisations hold source code, administrative credentials and customer environment access, all retaining high resale value. A rising trend against a declining sector-wide backdrop is not explained by classification bias alone.
Supply Chain Compromise: The defining structural risk this quarter and the only technique maintaining volume across all three periods, targeting software distribution pipelines and third-party integrations rather than endpoints. No single actor dominates, indicating broad adoption across multiple groups. A compromised vendor converts into multiple downstream victims without any being individually targeted.
Credential Infrastructure: OAuth phishing, device code phishing, MFA bypass, and credential theft spread across all three periods, targeting different points in the authentication chain rather than repeating one method. This is baseline tradecraft, not campaign activity, and identity controls should be treated as continuously contested.
Ransomware: Stable in chatter and identified only a small number of times in incident reporting. Not the dominant vector here. Backdoor and infostealer deployments confirm persistence and collection as the primary post-access objectives rather than disruption.
AI-Targeting Techniques: Concentrated early before collapsing, with LLM exploitation and prompt injection appearing later instead. This is rotation rather than decline, with early experimentation absorbed into existing toolkits.
Attribution: Russia accounts for the largest share of attributed attacking incidents, followed by China and North Korea. State-linked actors drive most publicly reported IT-sector targeting, with the United States the primary victim geography.
Disruption Categories: Web exploit chatter holds steady, while DDoS, claimed hacks and hacktivism all decline. The retreat in claim-based and disruption activity against climbing breach and leak volumes points to a shift toward quiet data acquisition rather than reduced interest.
Over the past 90 days, CYFIRMA’s telemetry has identified 1,183 mentions of information technology organizations out of a total of 3,089 industry mentions. This is from over 10k CVEs reported and updated in the last 90 days.
Information technology organizations ranked 1st out of 14 industries in the last 90 days with a share of 38.30% of all detected industry-linked vulnerabilities.
Below is a breakdown by 30-day periods of all mentions.
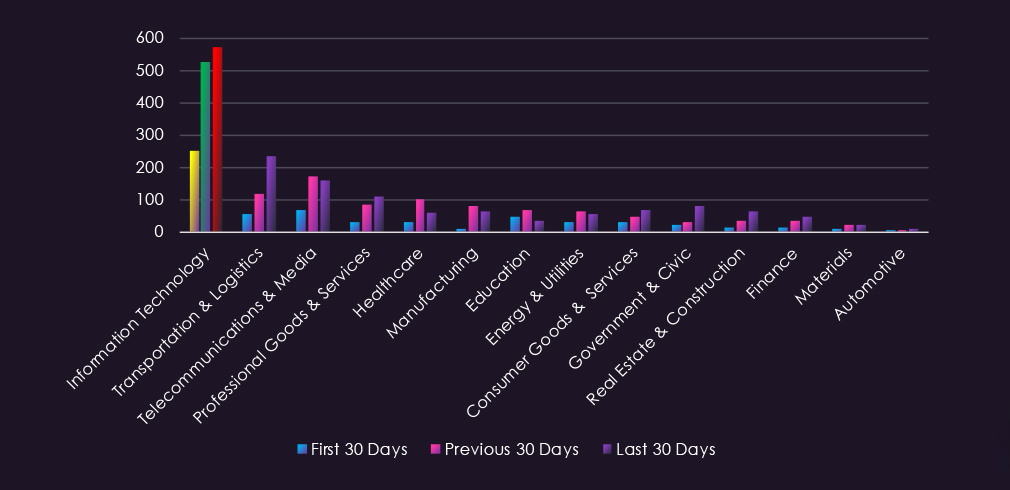
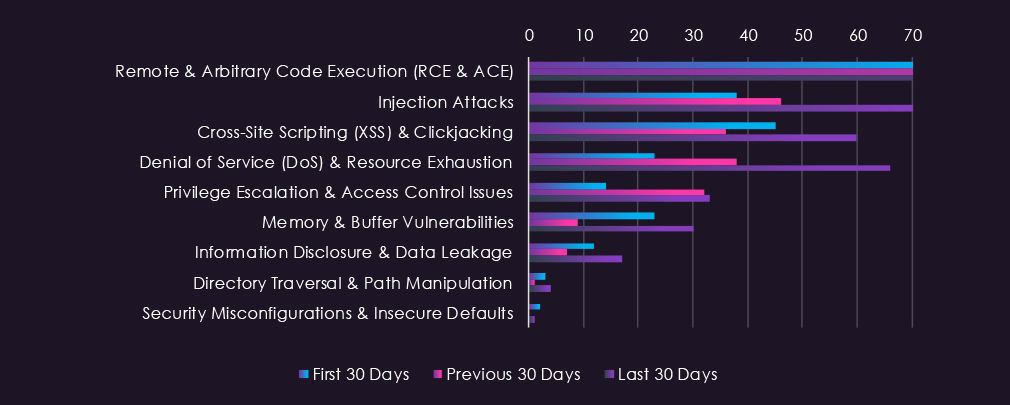
Remote and arbitrary code execution vulnerabilities dominate reported CVEs in the information technology sector over the last 90 days, tripling across the window with sustained escalation in every period. Injection attacks and denial of service both rise substantially, with denial of service nearly tripling from initial levels. Cross-site scripting dips mid-period before rising to its highest level in the final period. Privilege escalation more than doubles after the first period and holds steady, while memory and buffer vulnerabilities fall mid-period before recovering above initial levels. Information disclosure, directory traversal and security misconfigurations remain minimal throughout.
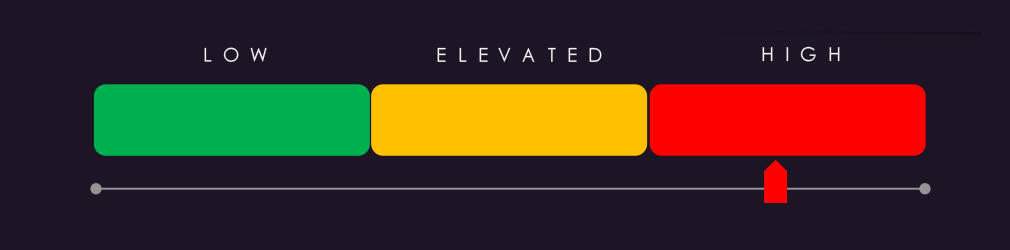
Information technology accounts for the largest share of reported vulnerabilities of any sector, though this figure requires qualification. CVEs are filed against products, and IT companies build the products that every other sector runs. A vulnerability in an operating system, database, or network appliance is classified as an IT-sector vulnerability regardless of which industry operates the affected system, so a substantial part of this share reflects where software originates rather than where exposure lands. The trend is the more reliable signal: disclosure volume more than doubled across the window with every major category rising, and that escalation is the primary driver of the high score.
Remote & Arbitrary Code Execution: The dominant category by a wide margin, tripling across the window with no sign of plateau. Direct compromise potential against operating systems, network infrastructure, developer tooling, and cloud platforms represents the primary CVE-driven risk. Much of this infrastructure is internet-facing by design, which compresses the window between disclosure and exploitation.
Denial of Service: Nearly triples over the window, rising in every period. For IT service providers where availability is contractual, DoS-enabling vulnerabilities carry direct commercial as well as operational consequence.
Injection Attacks and Cross-Site Scripting: Injection more than doubles across the window, while cross-site scripting dips mid-period before reaching its highest level in the final period. Both reflect the density of web-facing applications, APIs and management interfaces in this sector, where client-side and application-layer compromise supports credential theft at scale.
Privilege Escalation: More than doubles after the first period and holds steady. Combined with sustained RCE exposure, this is the lateral movement risk following initial compromise, and it is particularly consequential in environments holding administrative access into customer estates.
Downstream Exposure: The classification caveat cuts both ways. Vulnerabilities filed against IT products are the vulnerabilities every other sector inherits, without visibility into or control over the affected components. Rising disclosure volume here is a leading indicator of exposure across the whole report rather than a risk contained to IT organisations.
Remaining Categories: Memory and buffer vulnerabilities fall mid-period before recovering above initial levels, while information disclosure, directory traversal and security misconfigurations stay minimal throughout and do not currently shape the sector’s risk profile.
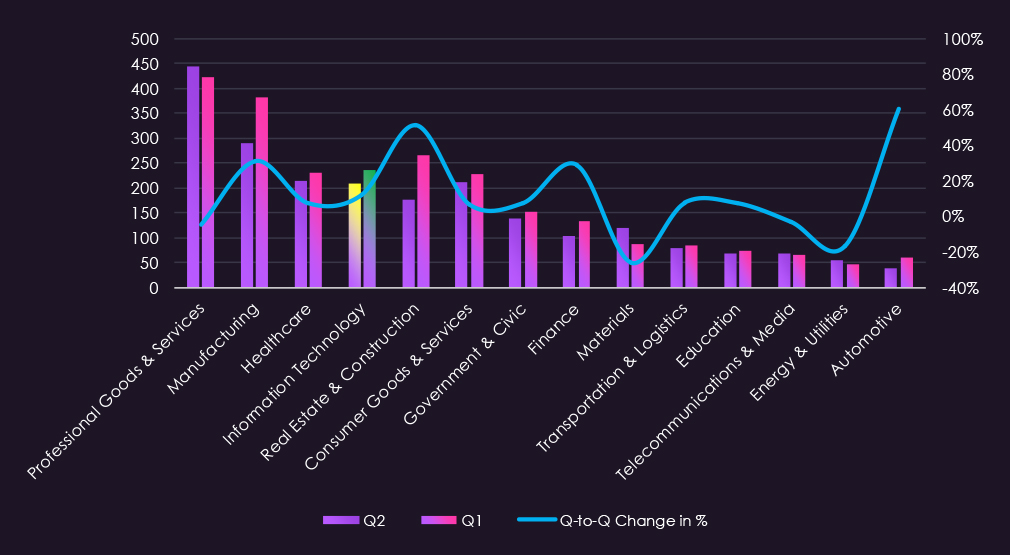
In the past 90 days, CYFIRMA has identified 236 verified ransomware victims in information technology organizations. This accounts for 9.22% of all 2,561 ransomware victims during the same period. Placing this sector 4th out of 14 industries.
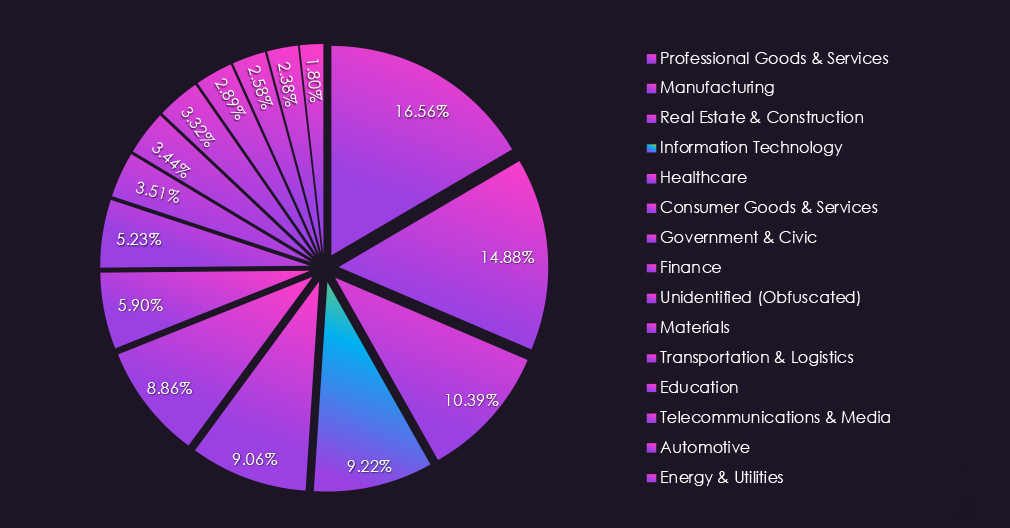
Furthermore, a quarterly comparison shows that the number of victims in information technology organizations has grown. It went from 210 to 236 victims, a 12.4% increase. The overall interest, represented by the share, also went up from 9.13% to 9.22% of all victims.
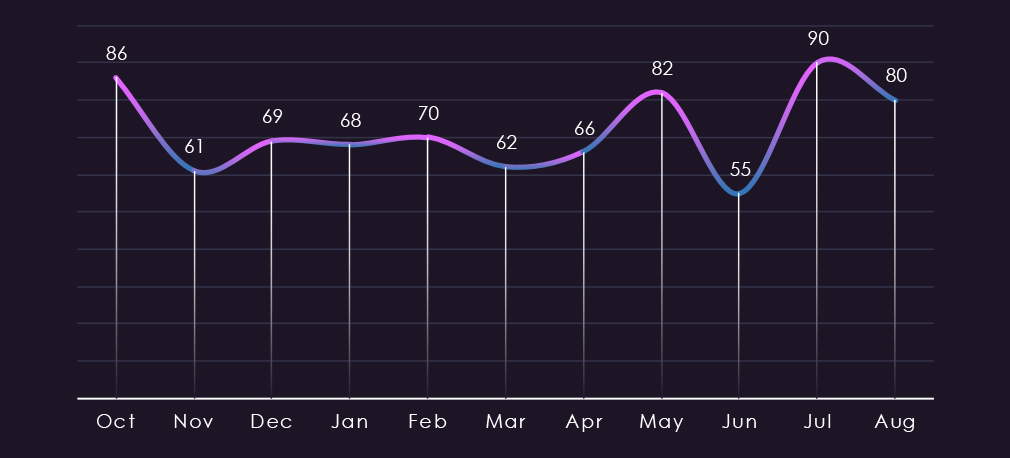
Monthly activity was remarkably stable from November to April. May jumped to 82 victims, then June dropped below average to 55, and July and August rebounded to 90 and 80 victims so far, respectively.
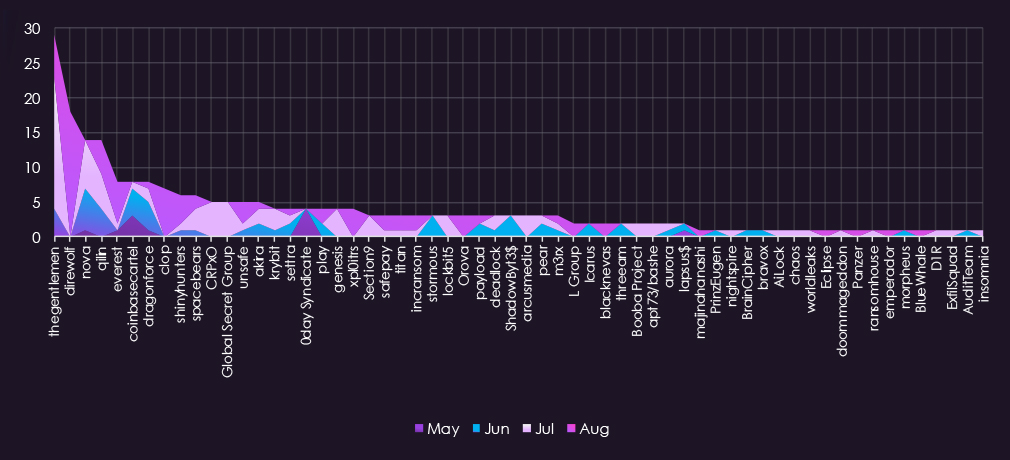
Activity shifted substantially across the period. Thegentlemen dominated July with 19 victims and remained active into August, while Nova and Qilin contributed steadily across all months. Coinbasecartel and 0day Syndicate were early drivers in May before tapering off.
August saw a marked change in the actor set, with Direwolf appearing for the first time and immediately recording 18 victims, alongside Clop with seven and Everest with six. This late-period entry of high-output groups is the clearest driver of August’s elevated volume, and several of these actors have no prior history in the sector.
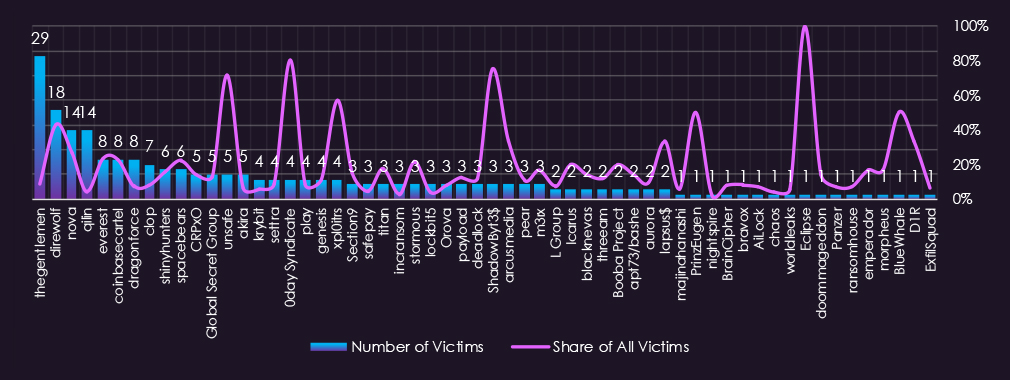
Out of the 99 gangs, 58 recorded victims in the information technology industry in the last 90 days, representing a 59% participation rate.
Thegentlemen and Direwolf had the highest numbers of victims, though they differ sharply in focus. Thegentlemen devoted 8.5% of its overall activity to this sector, while Direwolf recorded 42.9%.
Eclipse (100%), 0day Syndicate (80.0%), ShadowByt3$ (75.0%), and Unsafe (71.4%) stand out as the gangs with the highest shares of information technology victims, though all are low-volume gangs.
On average, gangs active in this industry recorded a 20.1% share of their victims from this industry. That is about 1 in 5 victims.
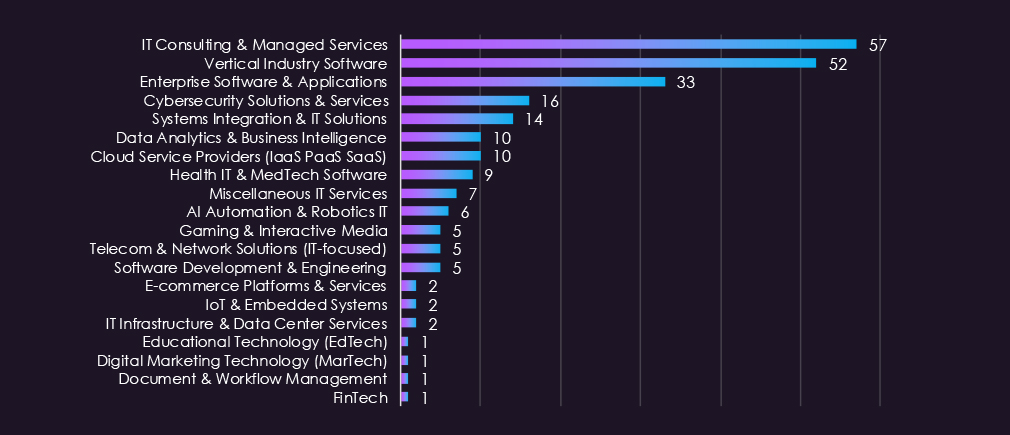
IT Consulting & Managed Services and Vertical Industry Software accounted for the largest share of victims by a wide margin, together representing close to half of all sector victims. Managed service providers are structurally attractive targets given their privileged access across multiple client environments, offering attackers reach well beyond the initial victim.
Enterprise Software & Applications also recorded substantial activity, while Cybersecurity Solutions & Services and Systems Integration formed a consistent mid-tier. Victims were recorded across all 20 tracked subsectors, from cloud providers and data analytics through to EdTech and FinTech, underscoring that no segment of the IT vertical was untouched during the period.
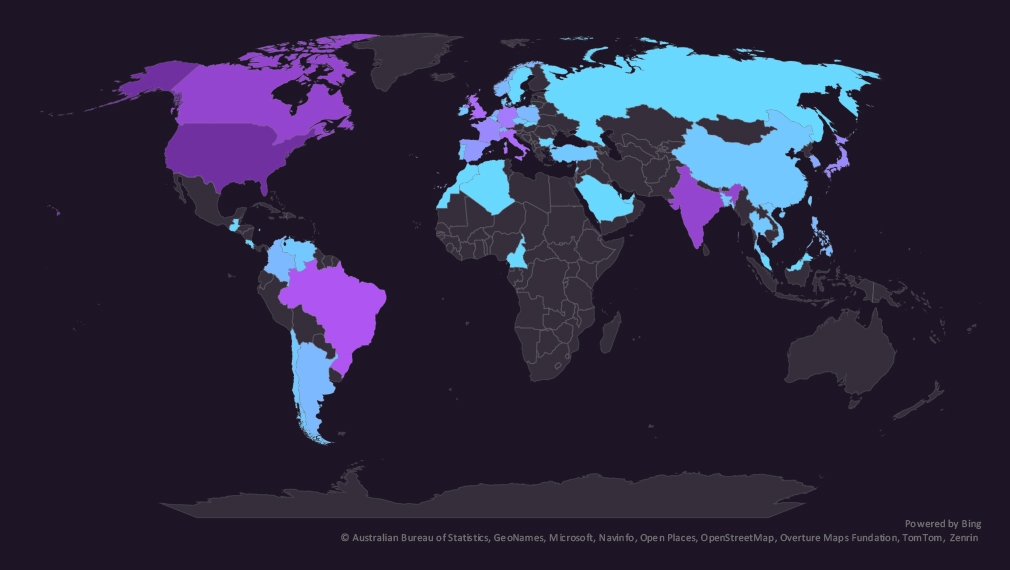
The geographic distribution heatmap underscores the widespread impact of ransomware, highlighting the countries where victims in this industry have been recorded.
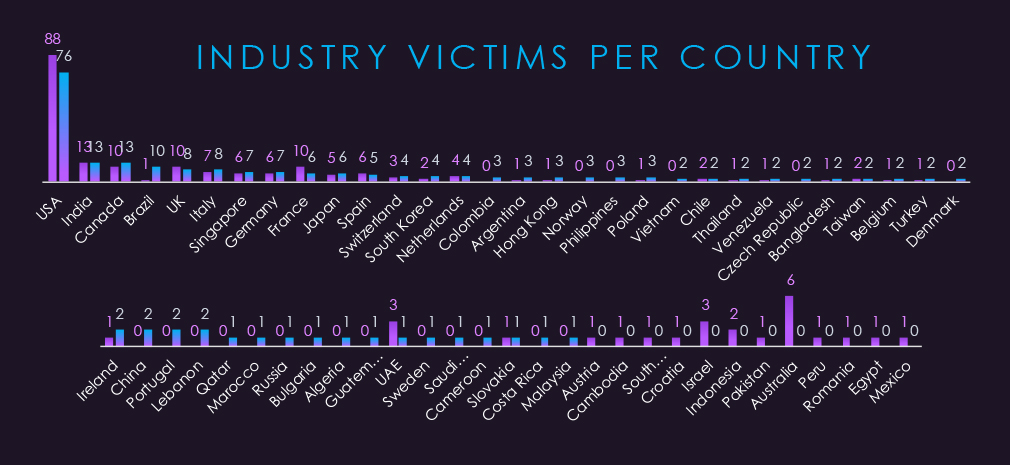
Information technology victimology shows the USA being the most targeted, accounting for 32% of all victims.
Remaining activity is distributed among 46 countries for 160 victims.
Brazil recorded by far the highest elevation in the last 90 days, rising from 1 to 10 victims, followed by Canada, Colombia, Norway, and the Philippines.
The USA, Australia, France, and Israel saw the largest declines.
In the last 90 days, 47 countries recorded information technology victims, 8 more than the 39 countries in the previous period.
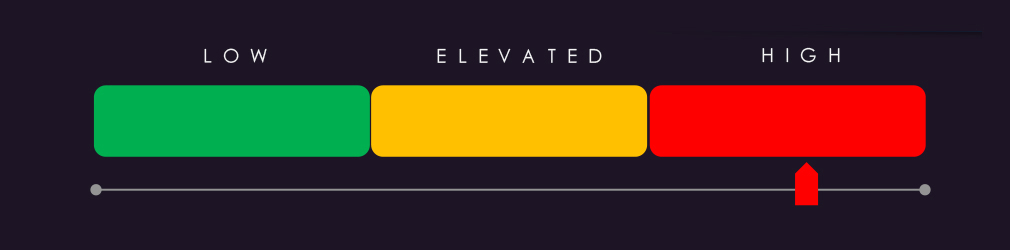
The Information Technology sector threat landscape is expected to remain at high risk through the next 90 days. Victim volume grew 12.4% quarter-on-quarter from 210 to 236; the sector ranks 4th of 14 industries at 9.22% of all ransomware victims, and August is already tracking at 80 victims with the month incomplete. The combination of rising volume, widening geographic reach, and an expanding actor set supports a forward posture of sustained high-tempo targeting.
Volume outlook: Monthly activity has been volatile rather than trending, oscillating between 55 and 90 victims across the period. However, the last three months break upward from that pattern, with July reaching the period high of 90 and August already at 80. A baseline of 250 to 280 victims over the next 90 days is the most plausible outcome, with upside risk if the new August entrants sustain their current tempo.
Actor behaviour: 58 of 99 active gangs recorded information technology victims, a 59% participation rate that is among the highest observed across any sector and indicates IT is a near-universal target across the ransomware ecosystem. Thegentlemen leads by volume with 29 victims. Direwolf is the more significant development, entering the sector in August and immediately recording 18 victims with 42.9% of its total activity directed here, marking it as a deliberate sector specialist rather than an opportunistic actor. Clop and Everest also escalated sharply in August. Further expansion of the active actor set is probable.
Specialist targeting risk: An unusually high number of gangs derive the majority of their victims from this sector, including Eclipse, 0day Syndicate, ShadowByt3$, Unsafe, and xpl0itrs. The average sector share across all active gangs is 20.1%, roughly one in five victims, which is the highest cross-sector ratio observed in recent reporting. This indicates deliberate rather than incidental selection across a broad portion of the actor set.
Geographic targeting: Country coverage expanded from 39 to 47, the widest spread recorded for this sector. Brazil showed the sharpest elevation, rising from a single victim to 10, while Canada, Colombia, Norway, and the Philippines also gained. The USA remains dominant at 33% despite declining in absolute terms, and the redistribution of volume toward Latin America and Southeast Asia is expected to continue.
Subsector risk: IT Consulting & Managed Services and Vertical Industry Software represent the highest-risk subsectors. Managed service providers warrant particular attention given that a single compromise can cascade across an entire client base, making them disproportionately valuable targets relative to their victim count alone.
APT Campaigns (High): Information technology featured in 46 of 88 observed campaigns (52%), more than tripling in absolute terms from 14, with share declining from 70% only because the total campaign pool more than quadrupled. The actor set is the broadest recorded in any sector, spanning Chinese, Russian, North Korean, Iranian, Pakistani, and financially motivated groups alongside Vietnamese, English, and Chinese-speaking cybercriminal clusters. MISSION2074-led campaign counts were followed by Stone Panda, though the more notable finding is Lazarus Group matching Stone Panda outright, the strongest DPRK presence recorded this reporting period. Web applications dominated targeting by a wide margin with database management software across nine campaigns, while remote desktop software, VPN solutions, routers, and SSH point to sustained interest in remote access and network-level persistence. Victim distribution spans 34 countries, led by the United States and Japan.
Reported Cyber Incidents (High): 201 incidents recorded, ranking 1st of 14 by a wide margin. Supply chain compromise is the defining structural risk, appearing 35 times and maintaining volume across all three periods as the only technique to do so, targeting software distribution pipelines and third-party integrations rather than endpoints. No single actor dominates that picture, indicating broad adoption across multiple groups rather than a concentrated campaign. Credential infrastructure came under pressure from four distinct directions simultaneously, with OAuth phishing, device code phishing, MFA bypass, and credential theft accounting for 18 incidents spread evenly across the window. AI-assisted attacks produced the sharpest volume spike at 13 incidents concentrated in the first period before collapsing, with LLM exploitation and prompt injection emerging later, a rotation rather than a retreat. Russia accounted for 10 of 22 attributed attacking incidents, with China and North Korea at four each.
Underground & Dark Web Chatter (High): The sector placed 1st of 14 at 14.26% of all industry-linked chatter with 2,706 mentions, though the headline figure requires qualification since IT products and security tooling are the subject matter of underground discussion by default. Direction is the more credible signal, and breach and leak chatter rose across all three periods, with leak volume more than doubling, running counter to the declining pattern seen across nearly every other sector during the same forum disruption window. IT organisations hold source code, administrative credentials, and customer environment access, all retaining high resale value. Claimed hacks, hacktivism, and DDoS all declined while breach and leak climbed, a divergence consistent with a shift toward quiet data acquisition rather than reduced interest.
Vulnerabilities (High): The sector ranked 1st of 14 at 38.30% of industry-linked disclosures across 1,183 mentions, a share that partly reflects where software originates rather than where exposure lands, since a vulnerability in an operating system or network appliance is classified as IT-sector regardless of who operates the affected system. Trend is the reliable signal, and disclosure volume more than doubled across the window, with every major category rising. RCE tripled with no sign of plateau, against infrastructure that is internet-facing by design. DoS nearly tripled, carrying direct commercial consequence for providers where availability is contractual. Privilege escalation more than doubled and held, representing lateral movement risk in environments holding administrative access into customer estates.
Ransomware (High): 236 victims, up 12.4% from 210, ranking 4th of 14 with share rising to 9.22%. Monthly activity broke upward in the final three months, with July reaching a period high of 90 and August already at 80 with the month incomplete. IT Consulting & Managed Services and Vertical Industry Software together account for close to half of all sector victims, with managed service providers structurally attractive given privileged access across multiple client environments. 58 of 99 active gangs recorded victims, a 59% participation rate among the highest observed anywhere, and the 20.1% average sector share across active gangs is the highest cross-sector ratio in recent reporting. Direwolf entered in August and immediately recorded 18 victims, with 42.9% of its activity directed here. Country coverage expanded from 39 to 47, the widest recorded for this sector.
