
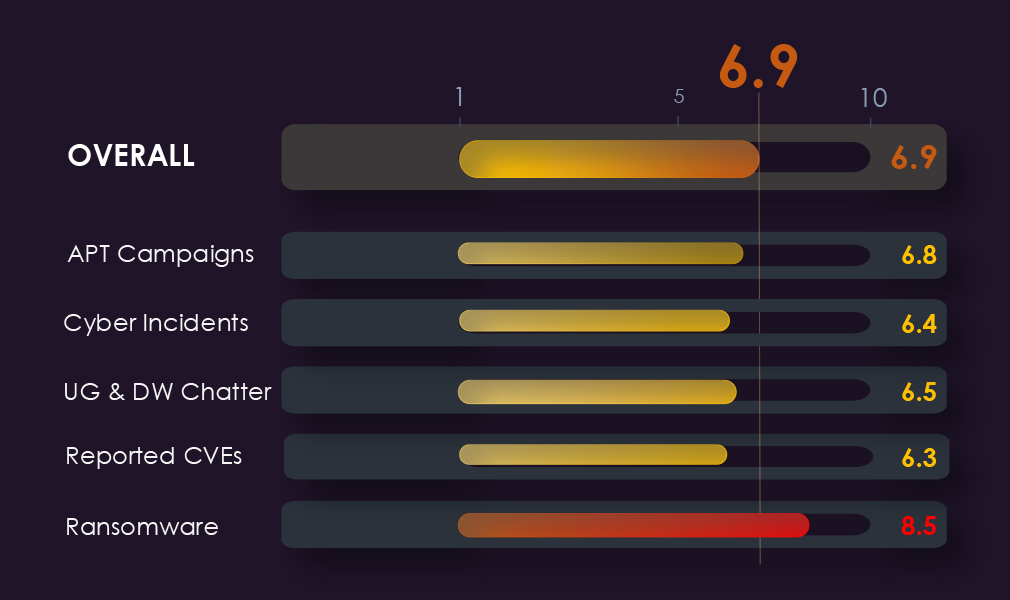
APT Campaigns – 6.8
Healthcare featured in 10 of 33 campaigns (30%), up from 3 of 19 (16%) last period. The most diverse nation-state actor mix across all sectors this period. Lazarus Group leads, Cozy Bear notable. Web portals and access management software targeted, pointing to credential access and patient data objectives.
Cyber Incidents – 6.4
21 incidents, ranking 8th. Ransomware and wiper attacks both concentrated in the final 30 days, signaling escalating severity. Supply chain concentration the defining structural risk. Iran is the primary identified attacking country.
Dark Web Chatter – 6.5
4.69% of all detected chatter, ranking 8th. Breach and leak mentions collapsed in the final period, assessed as forum disruption rather than reduced threat activity. Ransomware the most consistent and sustained category. Web exploit chatter rose against the broader declining trend.
Vulnerabilities – 6.3
207 CVEs, 5.23% of all industry-linked disclosures, ranking 5th. RCE stabilized above initial levels after a mid-period spike. Injection attacks tripled mid-period before declining. DoS carries disproportionate operational risk in this sector even at low volumes.
Ransomware – 8.5
216 victims, up 8.5% Q-on-Q. April spiked to 90 victims, breaking a stable six-month band. 62% of active gangs recorded healthcare victims. US accounts for 53% of all victims. Geographic coverage expanded from 33 to 42 countries.
The CYFIRMA Industry Report delivers original cybersecurity insights and telemetry-driven statistics of global industries, covering one sector each week for a quarter. This report focuses on the healthcare industry, presenting key trends and statistics in an engaging infographic format.
Welcome to the CYFIRMA infographic industry report, where we delve into the external threat landscape of the healthcare industry over the past three months. This report provides valuable insights and data-driven statistics, delivering a concise analysis of attack campaigns, public reports, underground & dark web chatter, vulnerabilities, and ransomware incidents targeting healthcare organizations.
We aim to present an industry-specific overview in a convenient, engaging, and informative format. Leveraging our cutting-edge platform telemetry and the expertise of our analysts, we bring you actionable intelligence to stay ahead in the cybersecurity landscape.
CYFIRMA delivers pre-emptive cybersecurity, cyber threat intelligence, and external threat landscape management through its platforms, DeCYFIR and DeTCT. These platforms have been purpose-built over many years to continuously collect, correlate, and analyse large volumes of external threat data, combining proprietary intelligence automation with deep, hands-on cyber threat research.
For the purpose of this report, the analysis draws on intelligence generated from CYFIRMA’s platforms. The data referenced has been processed through automated correlation and enrichment mechanisms, informed and validated by human-led research and investigative expertise, and sourced from both structured and unstructured external intelligence channels.
While this report contains data collected and processed by our in-house AI and ML, all charts, statistics, and analyses are done by human CYFIRMA CTI analysts to ensure the highest quality and provide accurate insights.
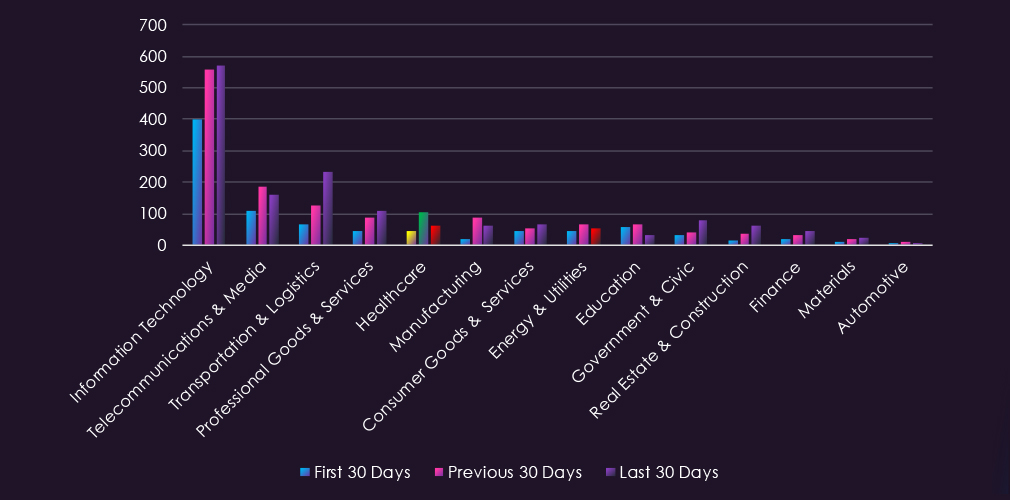
Healthcare organizations did feature in 10 out of the 33 observed campaigns, which is a presence in 30% of all campaigns, an increase from the previous period, where healthcare organizations were present in 3 out of 19 campaigns, an increase in presence in 16% of observed campaigns.

APT activity targeting Healthcare has been sustained. Most of the campaigns remain active and have been updated with new detection as recently as June.
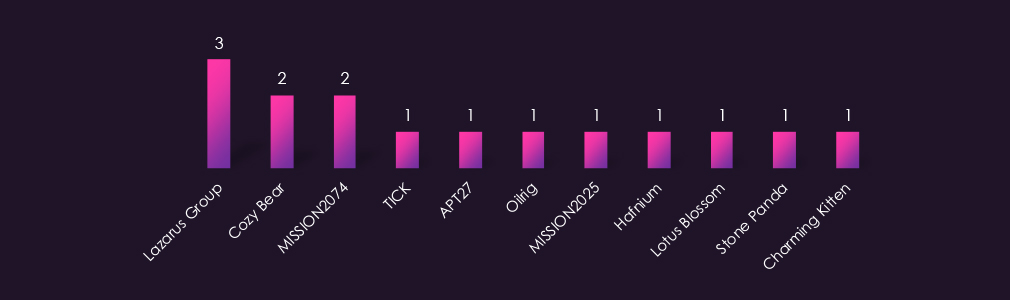
Observed APT campaigns show a diverse nation-state actor mix this period. North Korea-associated Lazarus Group leads with the highest number of observed campaigns, consistent with known DPRK targeting of healthcare organizations for both intelligence collection and financial objectives.
Russia-linked Cozy Bear recorded two campaigns, notable given its known focus on healthcare and pharmaceutical research targets. China-linked actors are well represented through MISSION2074, Hafnium, Lotus Blossom, Stone Panda, APT27, and TICK. Iran-linked OilRig and Charming Kitten both feature alongside MISSION2025.
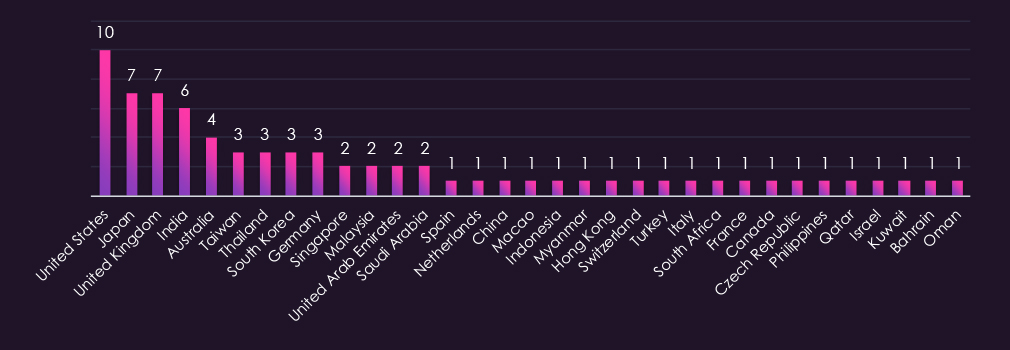
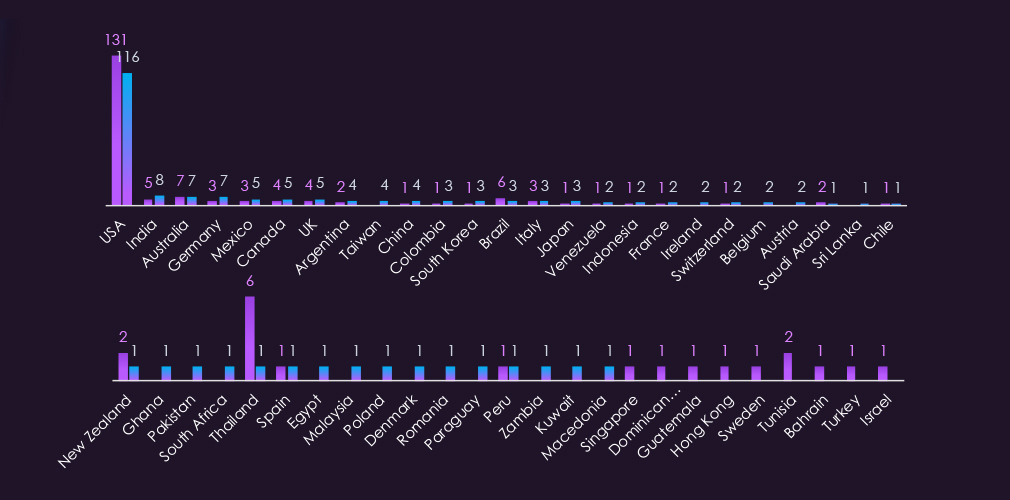
Victim distribution spans 34 countries, with the United States recording the highest victim count by a notable margin. Japan and the United Kingdom follow closely, with India, Australia, Taiwan, Thailand, South Korea, and Germany also featuring across multiple campaigns.
Middle Eastern presence is spread across several countries, with Saudi Arabia and the UAE recording the highest counts in the region, alongside Gulf states including Qatar, Kuwait, Bahrain, and Oman, each recording single instances. Southeast Asian countries, including Thailand, Singapore, Malaysia, and Indonesia, appear regularly across observed campaigns.
Remaining victims are spread across continental Europe, Africa, and isolated cases in East Asia, reflecting broad geographic targeting consistent with the diverse actor profile observed this period.
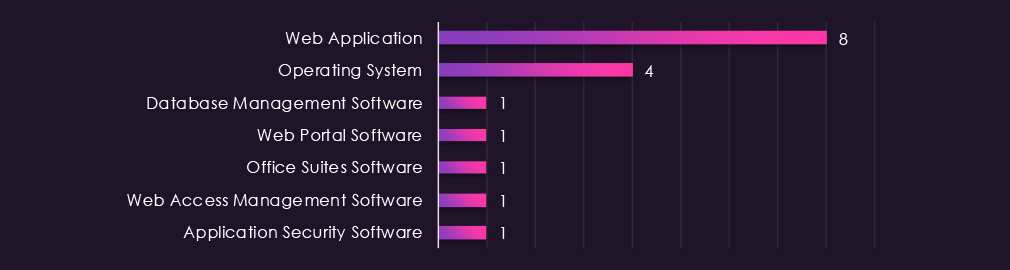
Web applications and operating systems account for the majority of observed attacks this period. Database management software and application security software each recorded single instances, consistent with threat actor interest in accessing patient data and undermining defensive tooling.
The remaining targeted technologies, web portal software, office suites, and web access management software, are particularly relevant in a healthcare context, pointing to threat actor interest in credential access, internal communications, and patient-facing systems alongside core infrastructure.

Based on observed trajectory across the two reporting periods, the healthcare sector external threat landscape is expected to remain at Elevated through the next 90 days. Campaign presence increased significantly from 16% to 30% of all observed campaigns, with activity concentrated in the final month of the reporting period, indicating accelerating rather than plateauing tempo.
Sustained volume: Campaign presence grew from 3 out of 19 to 10 out of 33 observed campaigns period over period. The sharp increase in June activity suggests momentum carrying into the next reporting period. 11 to 14 healthcare sector campaigns over the next 90 days is a plausible baseline estimate.
Dominant actor continuity: Lazarus Group and Cozy Bear both recorded multiple campaigns this period and are associated with long-running, healthcare-focused operations. Both actors show no indicators of reduced tempo, with campaigns updated with new detection as recently as June.
Data access objectives: Web portal software, office suites, and web access management software appearing as targeted technologies points to credential access and patient data collection as primary objectives. Healthcare organizations with exposed web-facing applications and unpatched access management systems face the highest immediate risk.
Geographic targeting: The United States leads in victim count by a notable margin, followed by Japan and the United Kingdom. North America and the Indo-Pacific corridor are expected to remain primary target zones, with Gulf state healthcare infrastructure also facing continued exposure.
Multi-actor threat profile: The healthcare sector attracted the most diverse nation-state actor mix this period, spanning North Korean, Russian, Chinese, and Iranian groups across different threat motivations. Defenders should prioritize TTP-based detection over actor-specific IOC tracking given the overlap in targeted technologies across actor groups.
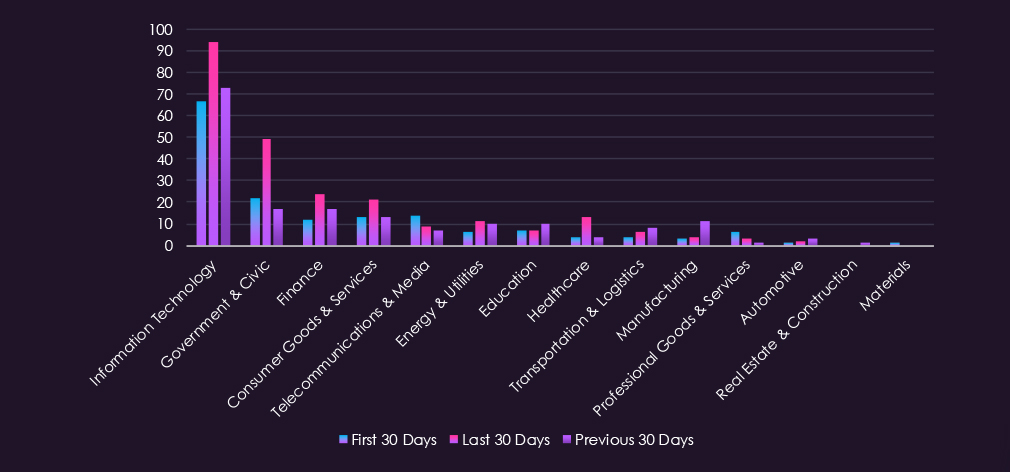
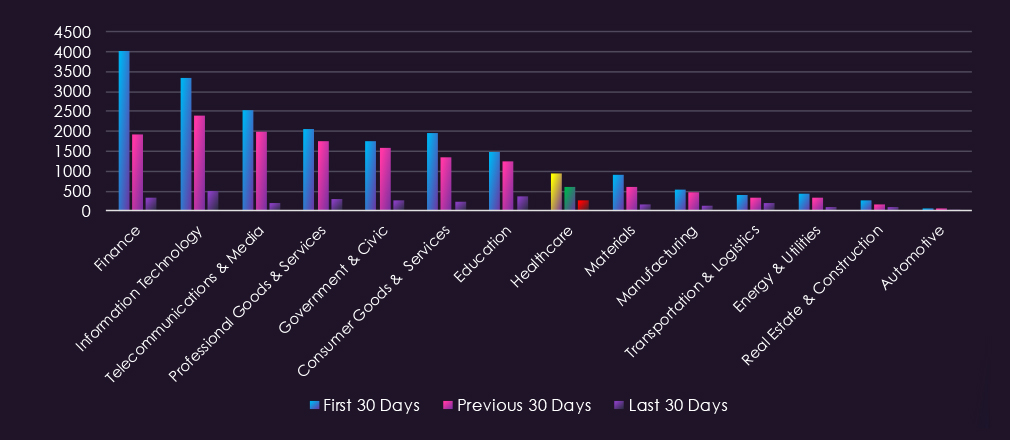
Over the past 90 days, DeCYFIR and DeTCT platforms tracked 780 cyber incidents reported publicly. We could identify the industry for 578 of these incidents (74%).
The healthcare industry was detected in 21 incidents, which equals 3.63% of the incidents where we knew the industry, ranking 8th out of 14 industries.
ShinyHunters dominated the data theft picture, responsible for the sector’s two largest confirmed breaches: DentaQuest (2.6 million records) and a broader Oracle PeopleSoft zero-day campaign in June hitting over 100 organisations, with healthcare systems disproportionately exposed due to legacy ERP deployments. Novo Nordisk separately disclosed a breach of clinical trials data, high-value given the strategic worth of pre-publication pharmaceutical IP.
Ransomware caused direct care disruption on multiple occasions. A ChipSoft attack in April cascaded outages across multiple Dutch hospitals simultaneously, illustrating the multiplier risk of healthcare’s reliance on specialist IT vendors. The Qilin group’s 2023 attack on NHS blood transfusion services in London was still generating disruptions nearly two years on. West Pharmaceutical also disclosed a ransomware incident affecting operations in May.
On the nation-state side, Russia-attributed actors explicitly targeted Ukrainian hospitals and emergency services using newly discovered AgingFly malware. Separately, a Chinese state-linked actor was extradited and charged with espionage against COVID-19 vaccine research, confirming pharmaceutical IP remains a standing Chinese intelligence collection priority.
The quarter’s defining structural risk is supply chain concentration. Clinical IT consolidates around a small number of specialist providers, and a single vendor breach routes to multiple hospitals without those hospitals being individually targeted. That dynamic, more than any single actor or malware family, is likely to define healthcare’s threat landscape in the near term.
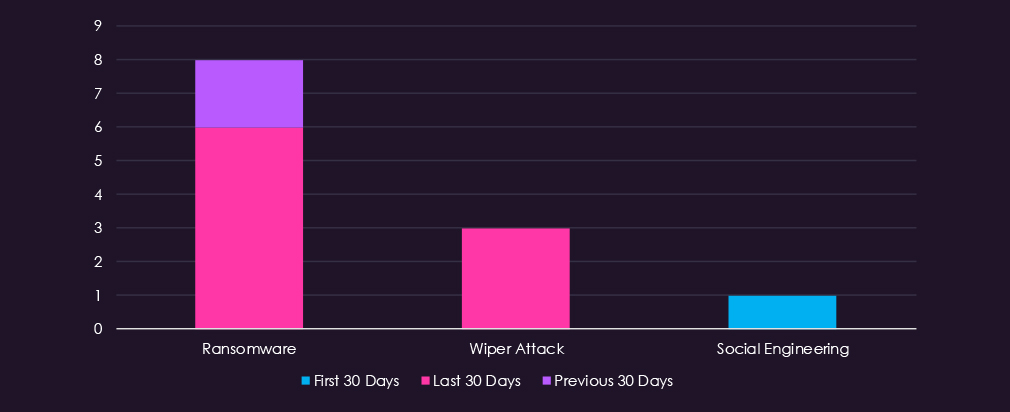
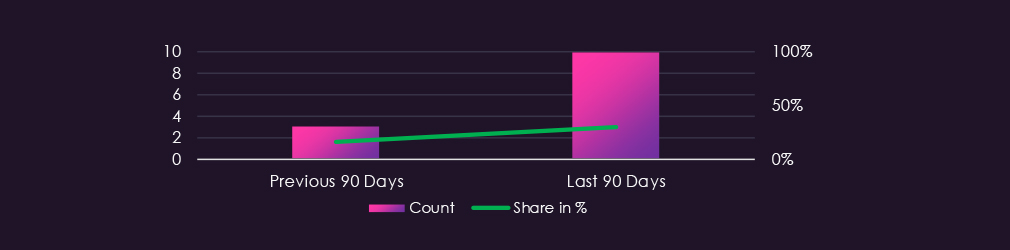
Ransomware dominated observed activity, accounting for the majority of identified techniques and concentrated heavily in the last 30 days. Wiper attacks appeared three times, also concentrated in the last 30 days, suggesting a notable shift toward destructive attack methods in the most recent period. Social engineering appeared once in the first 30 days. The concentration of both ransomware and wiper attacks in the last 30 days is the most significant pattern, indicating an escalation in the severity of attacks against healthcare organizations toward the end of the reporting period.
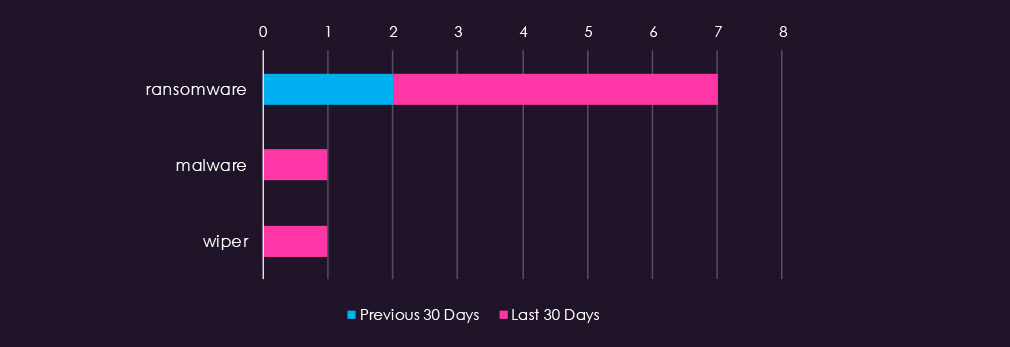
Ransomware was the dominant identified tool, appearing across the previous and last 30 days with no activity in the first 30 days. Generic malware and wiper classifications each appeared once, both in the last 30 days, consistent with the escalating pattern observed in attack techniques. No malware was identified in the first 30 days, reflecting the overall low activity level in that period for this sector.
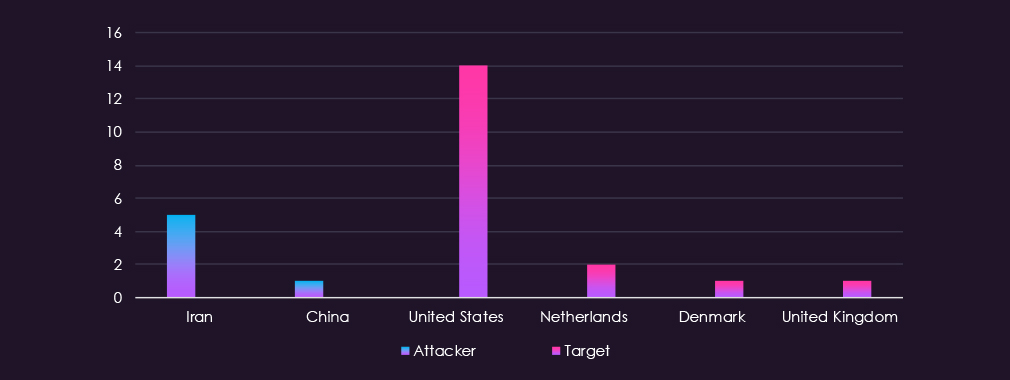
Attacking country attribution was limited but clear, with Iran identified in 5 incidents and China appearing once. Victim attribution was more complete, with the United States accounting for the substantial majority of targets, followed by isolated cases in the Netherlands, Denmark, and the United Kingdom. The concentration of Iranian attacking activity alongside heavy US victim presence is consistent with known state-sponsored targeting of healthcare infrastructure, particularly during periods of geopolitical tension.

The threat level for the healthcare sector over the next 90 days is assessed as elevated risk.
The following developments are anticipated based on current trends, actor capabilities, and operational patterns:
Ransomware and Care Disruption. Ransomware groups demonstrated a willingness to target clinical operations directly, with cascading effects across hospital networks. This pattern is unlikely to decrease given the sector’s low tolerance for operational downtime and consistent payment history.
Supply Chain Concentration Risk. Clinical IT consolidation around a small number of specialist vendors creates systemic exposure. A single vendor breach can route to multiple hospitals simultaneously without individual targeting. This structural vulnerability is likely to be further exploited in the near term.
State-Sponsored Espionage. Iranian and Chinese state-linked actors demonstrated sustained interest in healthcare and pharmaceutical targets. Pharmaceutical IP, clinical trial data, and vaccine research remain standing collection priorities.
Destructive Attack Escalation. The concentration of wiper attacks in the last 30 days alongside ransomware suggests some actors are shifting toward disruption rather than monetization. This remains a developing pattern rather than an established trend at current volumes.
Over the past 90 days, CYFIRMA’s telemetry has identified 1819 mentions of healthcare organizations out of a total of 38,746 industry-linked mentions. This is from a total of 300k+ posts across various underground and dark web channels and forums.
Healthcare organizations placed 8th out of 14 industries in the last 90 days with a share of 4.69% of all detected industry-linked chatter.
Below is a breakdown by 30-day periods of all mentions.
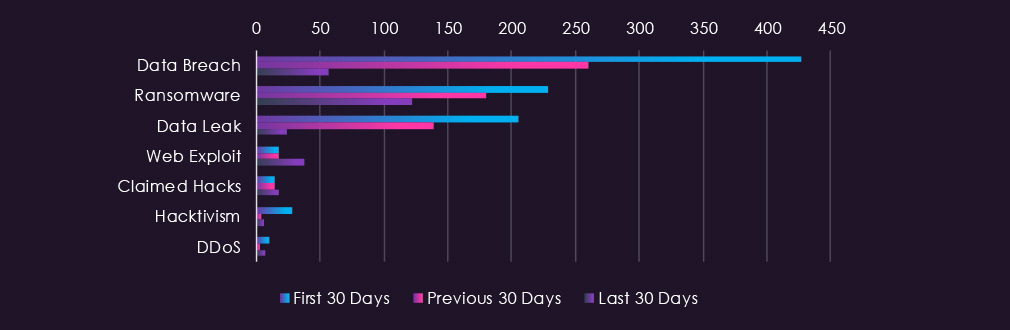
Underground & dark web chatter related to the healthcare sector over the last 90 days shows a dramatic decline in data breach and data leak discussions in the final period, dropping from 427 to 57 and 205 to 24, respectively. This sharp reduction reflects forum disruptions, fragmentation, and scattering of threat actor activity to harder-to-monitor surfaces rather than reduced actual threat activity. Ransomware mentions decline consistently from 229 to 122 but remain the most sustained threat category. Web exploits show a notable increase in the final period after stable mid-period activity. Claimed hacks remain stable across all periods, while hacktivism declines sharply after initial elevation, and DDoS remains at minimal levels with variable fluctuation.

Healthcare sits at elevated risk with sustained ransomware activity remaining the strongest and most reliable risk signal across the 90-day window. Declining breach and leak visibility likely reflects BreachForums disruptions and forum migration rather than reduced threat activity; however, without confirmed visibility into alternative monitoring surfaces, this cannot be substantiated as an elevation.
Data Breach and Data Leak: The dramatic decline in the final period aligns with documented BreachForums disruptions and forum fragmentation. Healthcare data remains among the highest-value commodities in underground markets due to patient record completeness and insurance information, though current visibility is insufficient to confirm sustained elevated activity.
Ransomware: The most reliable indicator in this dataset, given its consistent presence across all periods despite overall chatter decline. Healthcare remains a primary ransomware target due to operational disruption potential and historically higher ransom payment rates. Continued activity in this category is the strongest current risk signal for this sector.
Web Exploit: Notable increase in the final period despite overall chatter decline across other categories. Suggests active and growing probing of healthcare web infrastructure, patient portals, and administrative systems.
Claimed Hacks: Stable with a modest increase in the final period. Consistent presence suggests continued active interest in healthcare access and credentials in underground markets.
Hacktivism and DDoS: Both remain minimal with no current signal of sustained campaign activity against healthcare infrastructure.
Over the past 90 days, CYFIRMA’s telemetry has identified 207 mentions of healthcare organizations out of a total of 3,959 industry mentions. This is from over 10k CVEs reported and updated in last 90 days.
Healthcare organizations ranked 5th out of 14 industries in last 90 days with share of 5.23% of all detected industry-linked vulnerabilities.
Below is a breakdown by 30 days periods of all mentions.
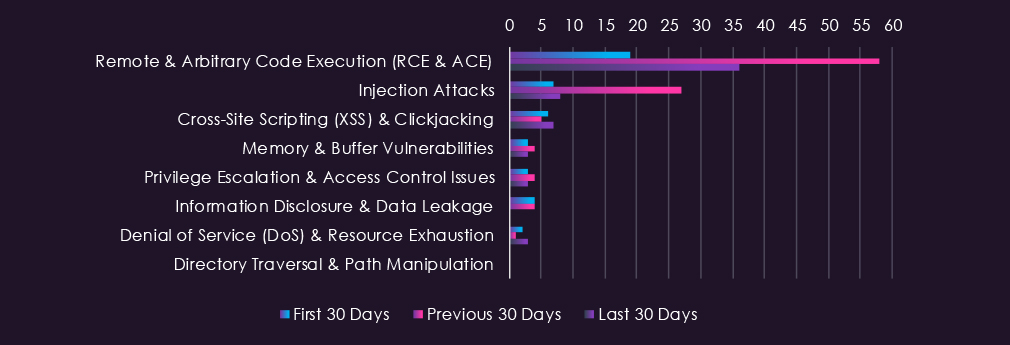
Healthcare sector CVEs show significant mid-period elevation in high-impact vulnerability categories. Remote and arbitrary code execution vulnerabilities spike mid-period before declining, while injection attacks triple mid-period before returning to initial levels. Cross-site scripting, memory, and privilege escalation vulnerabilities remain stable. Denial of service activity is minimal, information disclosure declines to zero in the final period, and directory traversal shows no reported activity.

Healthcare CVE disclosures show significant mid-period elevation across the highest-impact vulnerability categories, with RCE and injection attacks both spiking sharply before partially declining. The final period stabilization rather than continued decline suggests persistent exposure across critical vulnerability types. Combined with the sector’s low tolerance for system disruption and high value of patient data, CVE-driven risk remains elevated.
Remote & Arbitrary Code Execution: Remains the dominant vulnerability category and stabilizes above initial levels following a mid-period spike. Direct compromise potential against electronic medical record systems, patient portals, and medical administration infrastructure represents the primary CVE-driven risk in this sector.
Injection Attacks: Sharp mid-period spike followed by return to initial levels. The magnitude of the mid-period disclosure volume suggests active research and targeting of healthcare application logic, with residual exposure likely remaining despite declining disclosure numbers.
Cross-Site Scripting and Memory Vulnerabilities: Both are stable and consistent across all periods. Represent persistent low-level exposure in healthcare web applications and underlying system components.
Privilege Escalation: Stable and consistent across periods. Relevant in the healthcare context where unauthorized access to patient records and administrative systems carries significant regulatory and operational consequences.
Denial of Service: Minimal but present across all periods. In the healthcare context, even low-volume DoS vulnerability exposure carries disproportionate risk given the potential impact on patient care continuity.
Information Disclosure: Decline to zero in the final period represents a positive signal, though limited disclosure volume throughout suggests this category was never a primary driver of CVE risk in this sector.
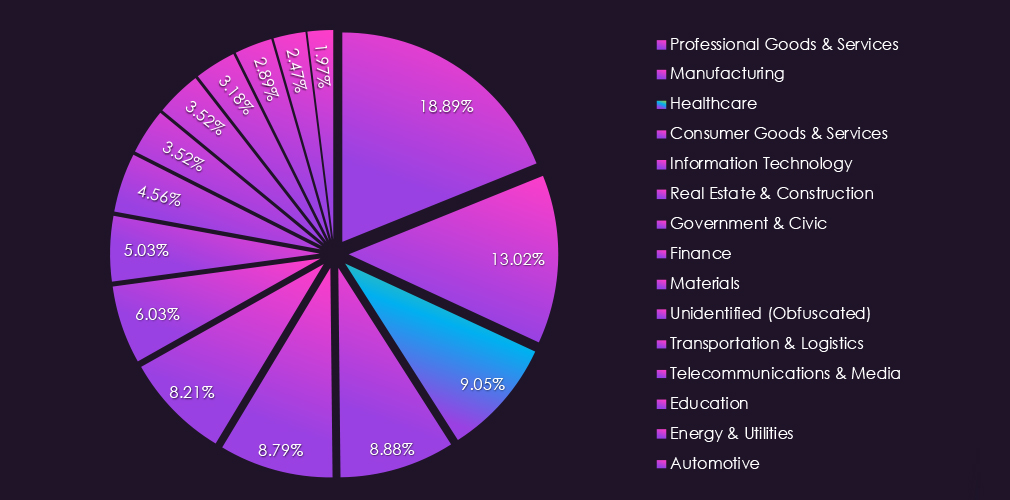
In the past 90 days, CYFIRMA has identified 216 verified ransomware victims in healthcare organizations. This accounts for 9.05% of all 2,388 ransomware victims during the same period. Placing this sector 3rd out of 14 industries.
Furthermore, a quarterly comparison shows that the number of victims in healthcare organizations has mildly increased. It went from 199 to 216 victims, an 8.5% growth. The overall interest, represented by share, also increased from 8.25% to 9.05% of all victims.
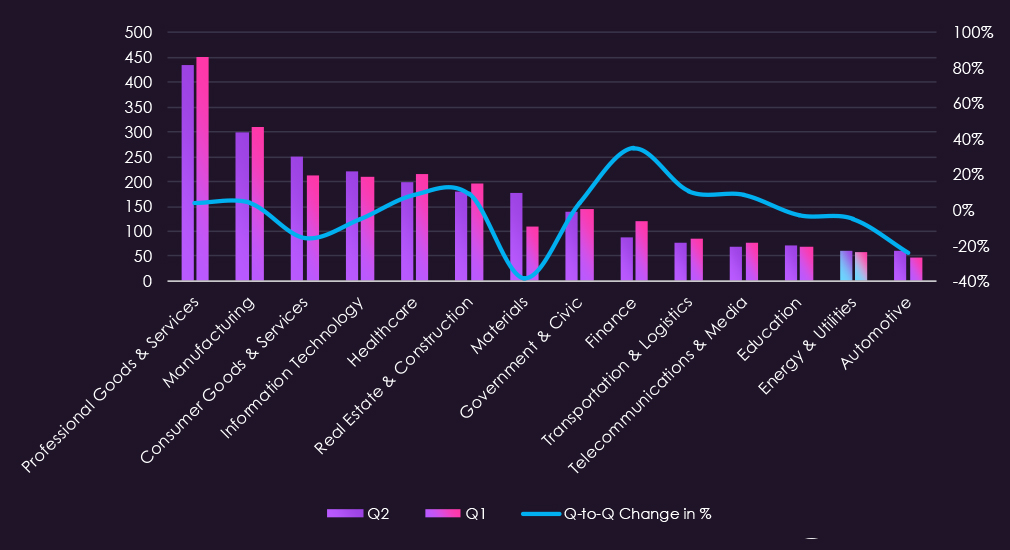
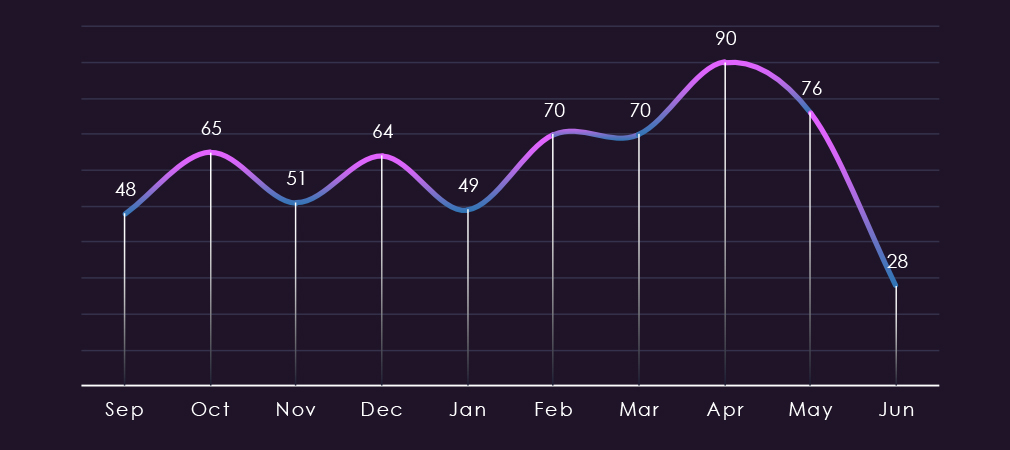
Monthly activity between September 2025 and February 2026 followed a sustained, oscillating pattern between 48 and 65 victims per month. March 2026 broke this pattern, and April followed with a major elevation spike to 90 victims.

A breakdown of monthly activity per gang reveals which gangs were most active each month. For instance, gangs Thegentleman and Qilin were highly active every month.
On the other hand, Cmd organization or fulcrumsec were only active in May.
Lastly, gangs like Dragonforce or Gunra were behind the April spike.
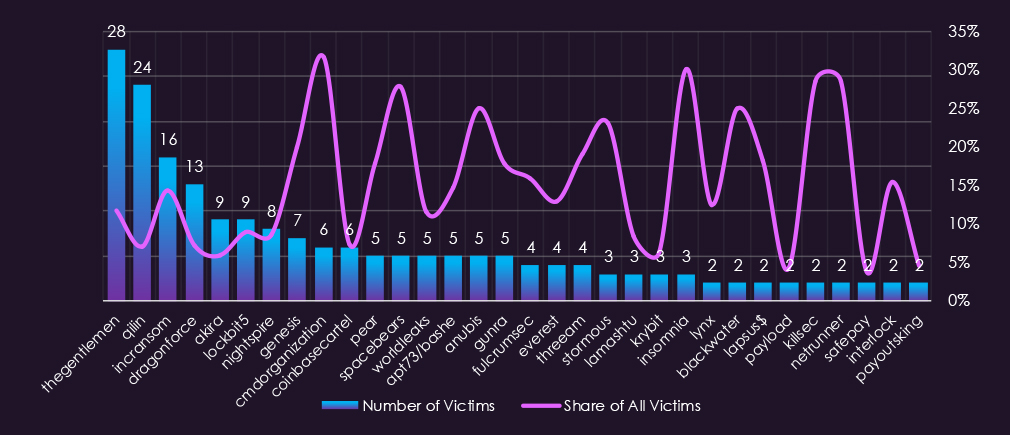
Out of the 81 gangs, 50 recorded victims in healthcare organizations in the last 90 days, representing a disturbing 62% participation. The chart shows only gangs with 2 or more victims.
Thegentlemen had the highest number of victims and a meaningful 11.7% share out of all their 240 victims in this industry.
Genesis, Cmdorganization, Spacebears, and Anubis stand out as gangs with the highest shares of healthcare victims.
Among gangs with more than 5 victims, on average, 13.7% of their victims are from this industry. That is about 1 in 7 victims.
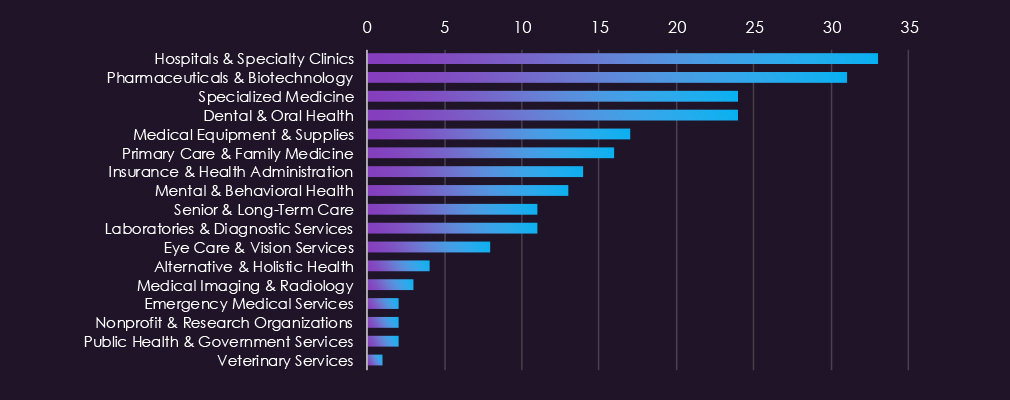
Hospitals & Specialty Clinics, Pharmaceuticals & Biotechnology, and Specialized Medicine led victim counts, with Dental & Oral Health also recording notable activity. The concentration across direct patient care and drug development reflects sustained threat actor interest in environments where operational disruption carries immediate consequences for human health.
Medical Equipment & Supplies, Primary Care, and Insurance & Health Administration recorded moderate activity, while mental health, senior care, and diagnostic services also saw meaningful incidents. Victims were recorded across nearly every subsector, underscoring the breadth of targeting across the healthcare vertical.
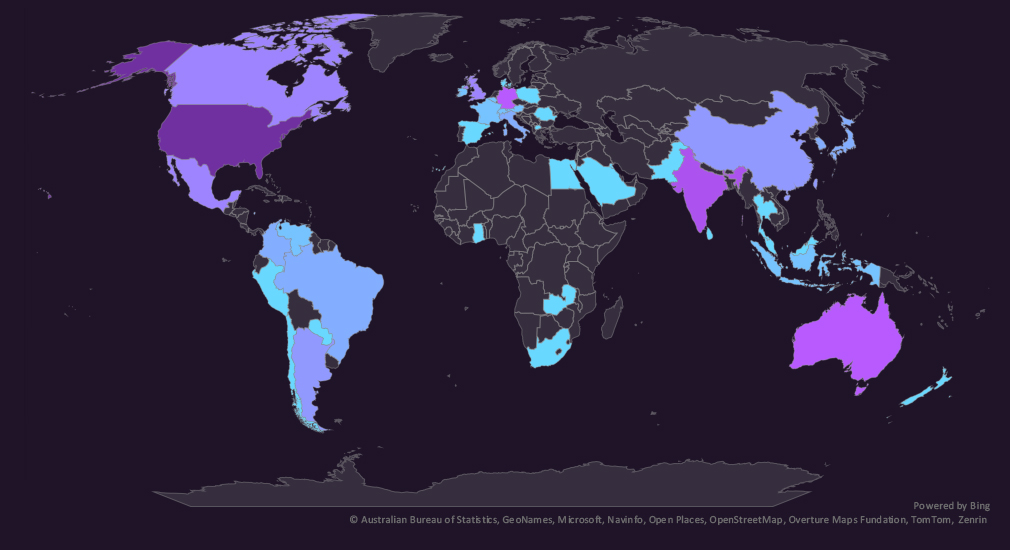
The geographic distribution heatmap underscores the widespread impact of ransomware, highlighting the countries where victims in this industry have been recorded.
Healthcare victimology shows the USA being disproportionately targeted, accounting for 53% of all victims. Remaining activity is highly distributed. 41 countries for 97 victims.
India, Germany, Taiwan, or China recorded the highest elevations in the last 90 days.
Thailand, Brazil, and Tunisia saw the largest declines.
In the last 90 days, 42 countries recorded healthcare victims. 9 more than 33 countries in the previous period.

The Healthcare sector threat landscape is expected to remain at high levels through the next 90 days. The sector recorded an 8.5% increase in victims quarter-on-quarter, and the April spike to 90 victims signals accelerating threat actor interest rather than a stable baseline. The June figure of 28 reflects a partial window and should not be interpreted as a genuine decline.
Volume outlook: Activity between September 2025 and February 2026 oscillated within a consistent band before March broke the pattern and April peaked sharply. A baseline of 220 to 260 victims over the next 90 days is plausible if the elevated tempo established in March and April persists. The sector’s share of all ransomware victims has grown period-on-period, indicating healthcare is attracting proportionally more attention across the active actor set.
Actor behaviour: 50 out of 81 active groups recorded at least one healthcare victim, representing a 62% participation rate that is exceptionally high by cross-sector standards. Thegentlemen and Qilin maintained consistent targeting across all months, indicating deliberate and sustained sector focus rather than opportunistic hits. DragonForce and Gunra were primary drivers of the April spike and are likely to sustain elevated tempo given no indicators of wind-down.
Specialist targeting risk: Genesis, Cmdorganization, Spacebears, and Anubis stand out for the disproportionate share of healthcare victims relative to their overall activity, signalling deliberate sector selection. The average healthcare share across gangs with more than five victims is 13.7%, approximately one in seven, which is among the highest cross-sector ratios observed.
Subsector exposure: Hospitals, pharmaceutical firms, and specialised medicine represent the highest-risk subsectors. These environments combine immediate operational disruption potential with high-value research data and patient records, creating strong leverage for both encryption and exfiltration-based attacks. The breadth of victims across 17 subsectors indicates no meaningful safe harbour within the vertical.
Geographic targeting: The USA accounts for 53% of all healthcare victims, a concentration level that indicates active prioritisation rather than incidental targeting. Geographic coverage expanded from 33 to 42 countries period-on-period, with India, Germany, Taiwan, and China recording the largest elevations. This expansion suggests threat actors are broadening their healthcare targeting beyond English-speaking markets, a trend expected to continue.
APT Campaigns (Elevated): Healthcare featured in 10 out of 33 observed campaigns this period, up from 3 out of 19 previously, a presence increase from 16% to 30%. This period saw the most diverse nation-state actor mix across all sectors, spanning North Korean, Russian, Chinese, and Iranian groups. Lazarus Group leads the campaign count, with Cozy Bear making a notable appearance given its known focus on pharmaceutical and healthcare research. Web portals, office suites, and web access management software feature as targeted technologies, pointing to credential access and patient data collection as primary objectives. Victim distribution spans 34 countries, with the US leading by a notable margin.
Reported Cyber Incidents (Elevated): 21 incidents recorded, ranking 8th across industries. Ransomware dominated identified techniques, concentrated heavily in the final 30 days, alongside a notable emergence of wiper attacks in the same period, suggesting a shift toward destructive methods. ShinyHunters was responsible for the two largest confirmed breaches, including a zero-day Oracle PeopleSoft campaign hitting over 100 organizations, with healthcare disproportionately exposed. Supply chain concentration is the defining structural risk, with clinical IT consolidating around a small number of specialist vendors, meaning a single breach can cascade across multiple hospitals simultaneously. Iran was the most identified attacking country, with the US the primary victim.
Underground & Dark Web Chatter (Elevated): Healthcare ranked 8th at 4.69% of detected chatter. Breach and leak mentions collapsed in the final period, from 427 to 57 and 205 to 24, respectively. This is assessed as reflecting BreachForums’ disruptions and forum fragmentation rather than reduced actual threat activity. Ransomware mentions declined but remained the most sustained and consistent category across all three periods. Web exploit chatter increased in the final period, the only category moving against the broader declining trend.
Vulnerabilities (Elevated): Healthcare ranked 5th at 5.23% of industry-linked disclosures across 207 CVEs. RCE vulnerabilities spiked mid-period and stabilized above initial levels rather than returning to baseline, maintaining persistent elevated exposure. Injection attacks tripled mid-period before declining. In a healthcare context, even low-volume DoS vulnerability disclosures carry disproportionate risk given potential impact on patient care continuity.
Ransomware (High): 216 victims, up 8.5% from 199 prior, with sector share growing from 8.25% to 9.05%. Activity oscillated within a consistent band from September through February before March broke the pattern and April spiked to 90 victims. 50 out of 81 active gangs recorded healthcare victims, a 62% participation rate that is exceptionally high by cross-sector standards. Hospitals, pharmaceuticals, and specialized medicine led sub-sector victim counts. The US accounted for 53% of all victims, with geographic coverage expanding from 33 to 42 countries. India, Germany, Taiwan, and China recorded the largest elevations.