
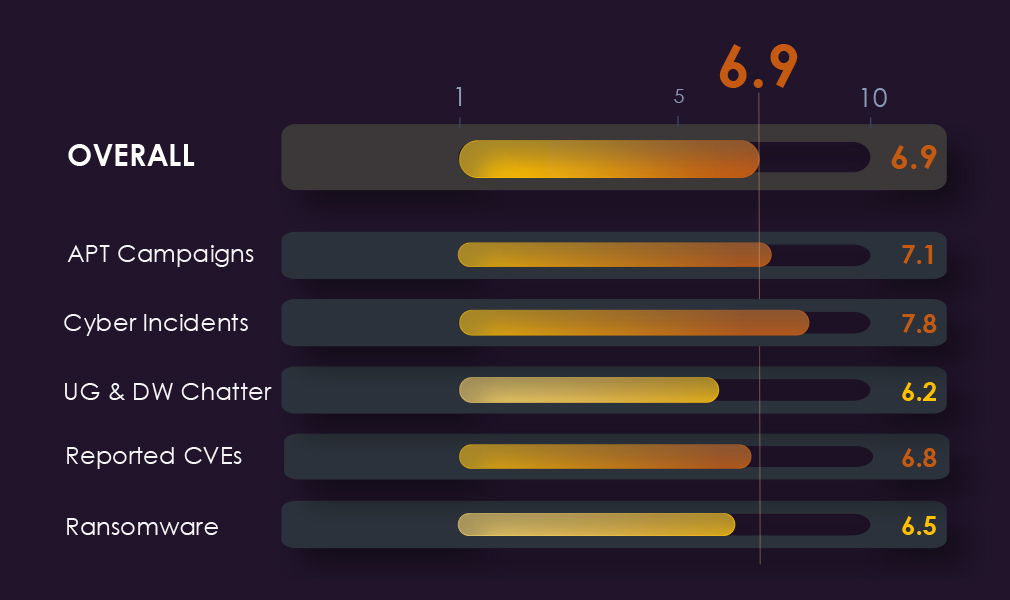
APT Campaigns – 7.1
Energy & utilities featured in 10 of 27 campaigns (37%), up from 6 of 19 (32%) last period. Activity is predominantly state-sponsored and China-concentrated. MISSION2074 leads; Lazarus Group and Charming Kitten also feature. Remote desktop, VPN, and router targeting points to persistent remote access objectives rather than data collection alone. Geographic reach spans 30 victim countries.
Cyber Incidents – 7.8
26 incidents were recorded over 90 days. OT/ICS attacks dominated, with Iranian actor CyberAv3ngers conducting the most consistent campaign, targeting PLCs and fuel tank monitoring systems. Wiper malware was deployed against Venezuelan energy infrastructure. Russia-linked actors targeted energy networks in Poland and Sweden. The first observed AI-assisted attack against energy OT systems was recorded, failing to breach but signaling active development of capabilities.
Dark Web Chatter – 6.2
976 mentions (2.28%) over 90 days. Data breach and leak chatter declined sharply in the final period, most likely driven by forum disruptions and migration to harder-to-monitor surfaces rather than reduced actual threat activity. Ransomware mentions also declined. Ongoing US/Israel vs. Iran conflict adds structural elevation not fully reflected in current chatter volumes.
Vulnerabilities – 6.8
161 CVEs (4.07%) over 90 days. RCE vulnerabilities are the dominant and most consistently elevated category, representing direct risk to OT and SCADA-adjacent systems. Denial of service spiked mid-period, carrying disproportionate operational risk in this sector. Injection vulnerabilities spiked mid-period before partial recovery.
Ransomware – 6.5
60 victims (2.55%), down 9.1% from 66 last quarter. 29 of 80 active gangs recorded energy & utilities victims (36% participation). Everest recorded the highest sector share at 12%. Energy Equipment & Services and Oil, Gas & Consumable Fuels led sub-sector victim counts. Activity spans 30 countries; the USA accounts for 23%, with the rest broadly distributed. April spiked sharply before a significant May decline.
The CYFIRMA Industry Report delivers original cybersecurity insights and telemetry-driven statistics of global industries, covering one sector each week for a quarter. This report focuses on the energy & utilities industry, presenting key trends and statistics in an engaging infographic format.
Welcome to the CYFIRMA infographic industry report, where we delve into the external threat landscape of the energy & utilities industry over the past three months. This report provides valuable insights and data-driven statistics, delivering a concise analysis of attack campaigns, public reports, underground & dark web chatter, vulnerabilities, and ransomware incidents targeting energy & utilities organizations.
We aim to present an industry-specific overview in a convenient, engaging, and informative format. Leveraging our cutting-edge platform telemetry and the expertise of our analysts, we bring you actionable intelligence to stay ahead in the cybersecurity landscape.
CYFIRMA delivers pre-emptive cybersecurity, cyber threat intelligence, and external threat landscape management through its platforms, DeCYFIR and DeTCT. These platforms have been purpose-built over many years to continuously collect, correlate, and analyse large volumes of external threat data, combining proprietary intelligence automation with deep, hands-on cyber threat research.
For the purpose of this report, the analysis draws on intelligence generated from CYFIRMA’s platforms. The data referenced has been processed through automated correlation and enrichment mechanisms, informed and validated by human-led research and investigative expertise, and sourced from both structured and unstructured external intelligence channels.
While this report contains data collected and processed by our in-house AI and ML, all charts, statistics, and analyses are done by human CYFIRMA CTI analysts to ensure the highest quality and provide accurate insights.
Energy & utilities organizations were featured in 10 of the 27 observed campaigns, representing 37% of all campaigns. This is an increase from the previous period, when energy & utilities organizations were present in 6 out of 19 campaigns, up from 32% of observed campaigns.
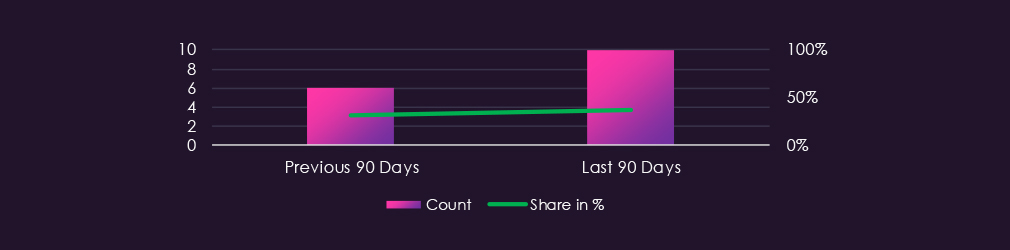

Monthly activity appears sporadic and volatile, with periods of low activity disrupted by more active periods. However, over the past 6 months, we have observed a stable ~35% presence of this industry in APT campaigns, suggesting long-term sustained interest by threat actors.
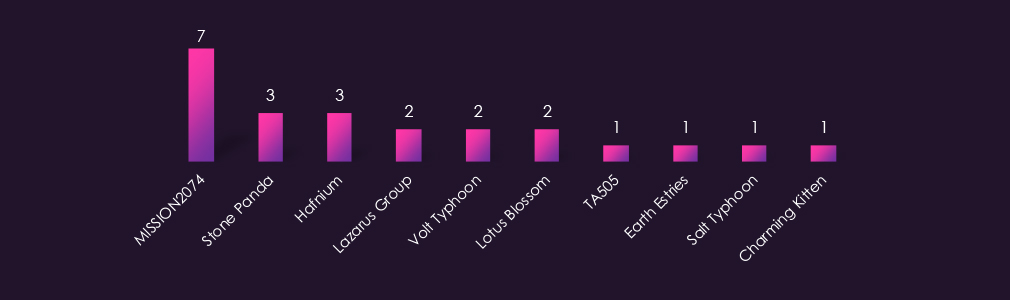
Observed APT campaigns are heavily concentrated around suspected China-linked, state-sponsored actors, with MISSION2074 recording the highest campaign count by a considerable margin across all sectors this period. Stone Panda, Hafnium, Lotus Blossom, Volt Typhoon, Earth Estries, and Salt Typhoon provide additional China-aligned representation, making this one of the most China-concentrated actor profiles observed.
North Korea-associated Lazarus Group appears across two campaigns, consistent with known DPRK interest in energy sector targets. Iran-linked Charming Kitten also features, while no Russia-linked actors are observed this period. Financially motivated actor TA505 appears in a single campaign, reinforcing that activity is primarily driven by strategic intelligence and infrastructure reconnaissance objectives.
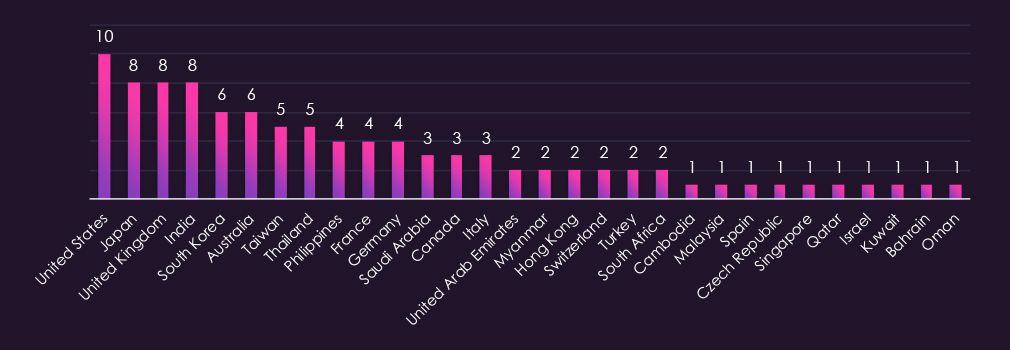
Victim distribution spans 30 countries, with the United States recording the highest victim count by a notable margin, consistent with its concentration of critical energy infrastructure. Japan, the United Kingdom, and India follow closely, with South Korea, Australia, and Taiwan also featuring prominently across observed campaigns.
European presence is stronger than in most other sectors, with France, Germany, and Italy all recording meaningful victim counts, reflecting the region’s significant energy infrastructure exposure. Middle Eastern presence is anchored by Saudi Arabia and the UAE, with Gulf states including Qatar, Kuwait, Bahrain, and Oman also recording victims, consistent with both China-linked and Iran-linked actor targeting patterns.
Southeast Asian countries, including Thailand, the Philippines, and Myanmar, appear regularly, consistent with the geographic focus of several China-linked actors observed during this period. Remaining victims are spread across Africa, Central Asia, and isolated cases in Latin America.
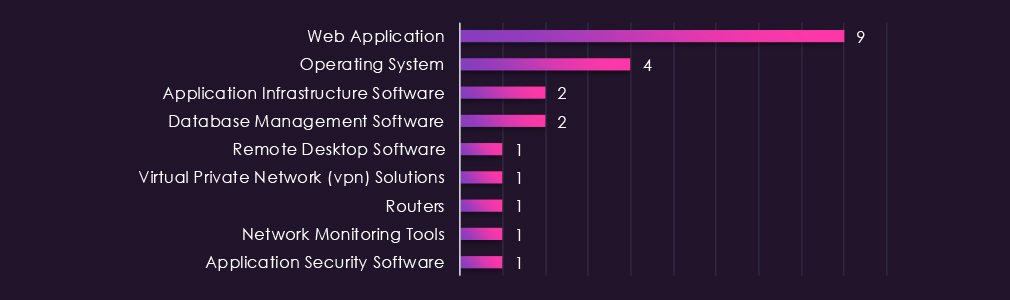
Web applications and operating systems account for the majority of observed attacks, consistent with patterns seen across other sectors this period. Application infrastructure and database management software each recorded multiple instances, suggesting both operational disruption and data collection as likely objectives in several campaigns.
The remaining targeted technologies, remote desktop software, VPN solutions, routers, network monitoring tools, and application security software each recorded a single instance. The presence of remote desktop software alongside VPNs and routers is particularly notable in an energy sector context, consistent with threat actor interest in gaining persistent remote access to operational infrastructure.

Based on observed trajectory across the two reporting periods, the energy and utilities sector external threat landscape is expected to remain at Elevated or higher through the next 90 days. Campaign presence increased from 32% to 37% of all observed campaigns, with MISSION2074 maintaining dominant activity and the broader China-linked actor cluster showing no indicators of reduced tempo.
Sustained volume: Campaign presence grew from 6 out of 19 to 10 out of 27 observed campaigns period over period. The upward trajectory indicates an environment of increasing rather than plateauing activity. 11 to 15 energy and utilities sector campaigns over the next 90 days is a plausible baseline estimate.
Dominant actor continuity: MISSION2074 recorded the highest campaign count by a considerable margin across all sectors this period. Combined with consistent Stone Panda, Hafnium, and Volt Typhoon activity, the China-linked actor cluster is expected to maintain or increase operational tempo, with no indicators of wind-down.
Infrastructure access objectives: The presence of remote desktop software, VPN solutions, and routers as targeted technologies points to persistent remote access objectives rather than purely data collection. Energy sector organizations with exposed remote access interfaces and unpatched network infrastructure face the highest immediate risk.
Geographic targeting: The United States leads in victim count this period, followed by Japan, the United Kingdom, and India. The Indo-Pacific corridor and North America are expected to remain primary target zones, with European energy infrastructure also facing elevated exposure given that France, Germany, and Italy all recording meaningful victim counts.
Actor profile breadth: North Korea-associated Lazarus Group and Iran-linked Charming Kitten both feature alongside the dominant China-linked cluster, indicating multi-actor targeting across different threat motivations. Defenders should prioritize TTP-based detection over actor-specific IOC tracking given the overlap in targeted technologies across actor groups.
Over the past 90 days, DeCYFIR and DeTCT platforms tracked 788 cyber incidents reported publicly. We could identify the industry for 586 of these incidents (74%).
The energy & utilities industry was detected in 26 incidents, which equals 4.44% of the incidents where we knew the industry, ranking 6th out of 14 industries.
The energy and utilities sector faced sustained and diverse cyber activity across the 90-day period. Iranian state-linked actor CyberAv3ngers maintained the most consistent presence, conducting repeated OT/ICS attacks against US critical infrastructure, targeting programmable logic controllers and fuel tank monitoring systems. Activity persisted across multiple periods, indicating an ongoing campaign rather than isolated incidents.
Venezuela’s energy sector was hit with destructive wiper attacks using Lotus malware, causing significant disruption. Russia-linked actors targeted energy infrastructure in Poland and Sweden, with the Swedish case attributed to pro-Russian hacktivists attempting to breach a thermal power plant. China-linked FamousSparrow was identified as targeting an energy firm in Azerbaijan, consistent with broader state-sponsored interest in energy sector intelligence.
Ransomware activity was also present, with Cl0p compromising a UK water company and a separate ransomware attack hitting a North Dakota water treatment plant. Both cases highlight continued targeting of water and utilities infrastructure by financially motivated actors alongside state-sponsored threats.
The period also saw an AI-assisted attack targeting Mexican energy infrastructure, which failed to breach OT systems, and Iranian APT activity targeting UAE energy and government entities.
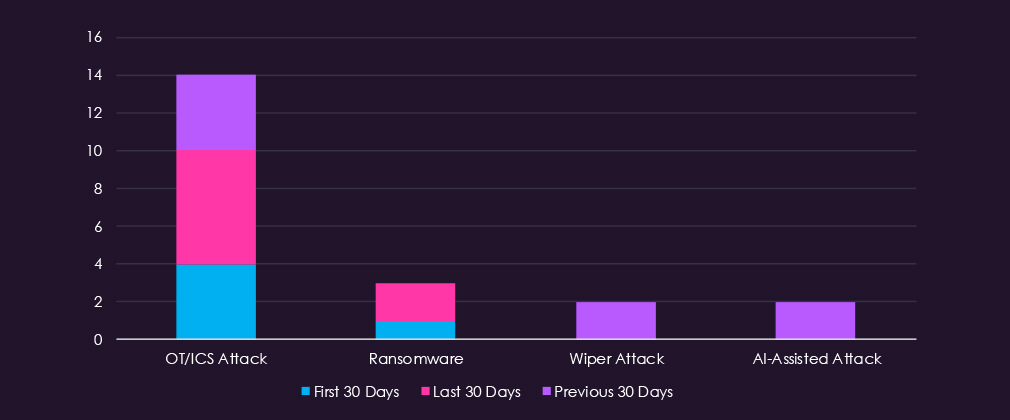
OT/ICS attacks dominated the period, appearing consistently across all three windows and accounting for the majority of observed activity. Ransomware appeared in the first and last 30 days, indicating persistent financially motivated targeting alongside state-sponsored activity. Wiper attacks and AI-assisted attacks each appeared twice, both concentrated in the previous 30 days, with the Venezuelan Lotus wiper campaign and an AI-driven attack against Mexican energy infrastructure representing the most notable cases.
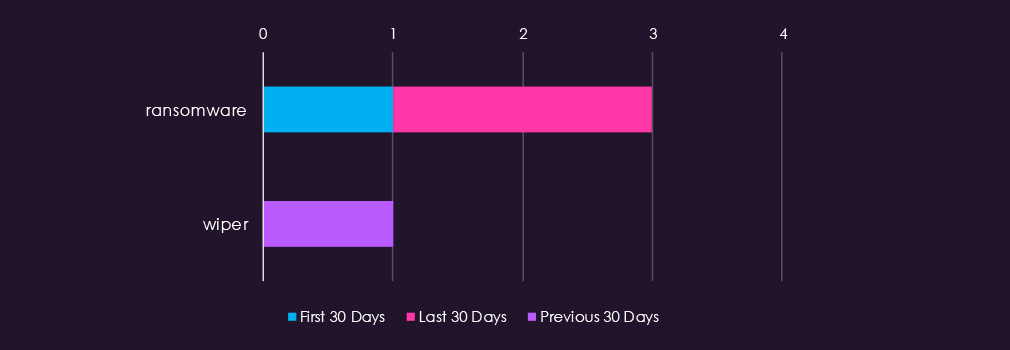
Malware identification was limited relative to total incidents. Ransomware was the most frequently identified tool, appearing in the first and last 30 days. Wiper malware appeared once in the previous 30 days, consistent with the Lotus wiper campaign targeting Venezuelan energy firms. The limited identification coverage reflects the broader limitation that public incident reports, particularly for OT/ICS attacks, frequently omit specific malware or tool details.
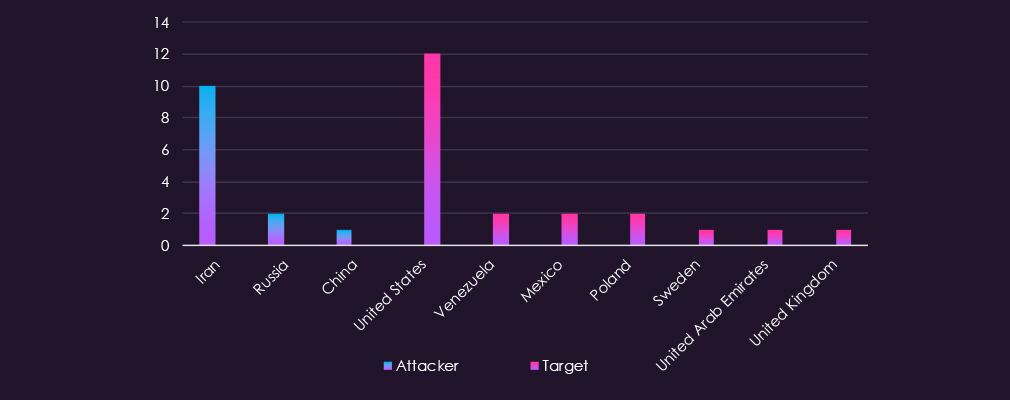
Attacking country attribution was dominated by Iran, identified in 10 incidents, reflecting CyberAv3ngers sustained campaign activity across the period. Russia and China each appeared once as attacking entities. Victim attribution was more complete, with the United States as the primary target by a significant margin, followed by Venezuela, Mexico, and Poland, with isolated cases across Sweden, the United Arab Emirates, and the United Kingdom. The geographic distribution reflects both concentrated Iranian targeting of US energy infrastructure and broader opportunistic activity across Europe, Latin America, and the Middle East.

The threat level for the energy and utilities sector over the next 90 days is assessed as a continued high risk.
The following developments are anticipated based on current trends, actor capabilities, and operational patterns:
Iranian OT Targeting. CyberAv3ngers demonstrated sustained campaign capability across the period, consistently targeting US critical infrastructure, including PLCs and fuel tank monitoring systems. Tempo is unlikely to decrease given current geopolitical conditions. Exposed industrial devices represent an unresolved attack surface.
Wiper and Destructive Attacks. The Lotus wiper campaign against Venezuelan energy infrastructure signals a willingness to cause physical disruption. Similar destructive capabilities observed from Russia-linked actors in European energy targets suggest this threat class is expanding geographically.
Ransomware Against Utilities. Cl0p and unattributed ransomware groups demonstrated continued interest in water and utilities infrastructure. The UK water company breach remaining undetected for nearly two years indicates persistent dwell time risk in this subsector.
AI-Assisted Attack Experimentation. The first observed AI-driven attack against energy OT infrastructure (Mexico) failed to breach systems but signals active capability development. Near-term attempts are likely to increase in sophistication.
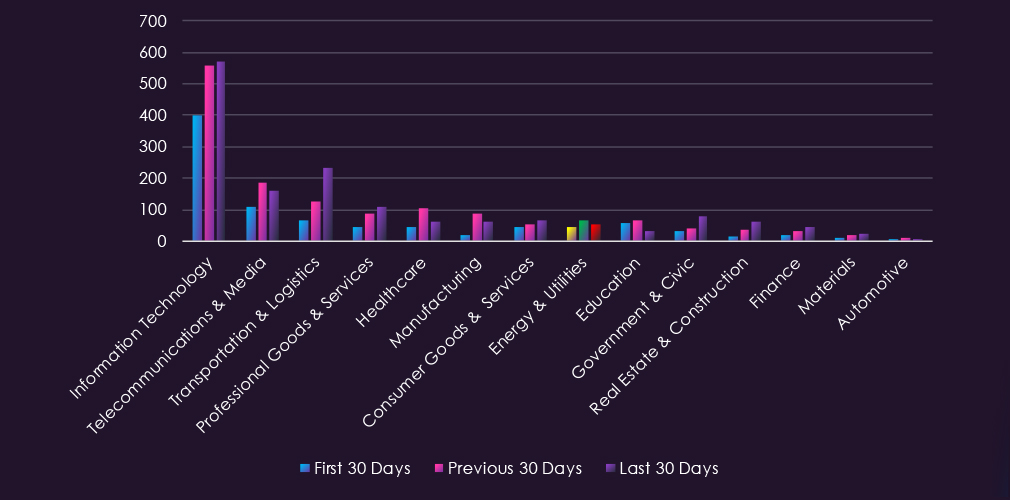
Over the past 90 days, CYFIRMA’s telemetry has identified 976 mentions of energy & utilities organizations out of a total of 42,895 industry-linked mentions. This is from a total of 300k+ posts across various underground and dark web channels and forums.
Energy & utilities organizations placed 11th out of 14 industries in the last 90 days with a share of 2.28% of all detected industry-linked chatter.
Below is a breakdown by 30-day periods of all mentions.
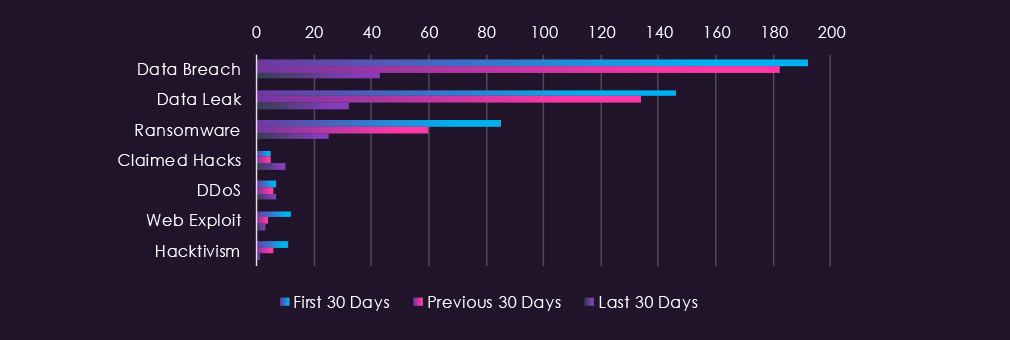
Underground & dark web chatter related to the energy & utilities sector over the last 90 days shows a dramatic decline in data breach and data leak discussions in the final period, dropping from 192 to 43 and 146 to 32, respectively. This sharp reduction aligns with documented BreachForums disruptions, forum fragmentation, and migration of threat actor activity to harder-to-monitor surfaces, including invite-only forums and decentralized channels. Ransomware mentions declined substantially from 85 to 25. Claimed hacks show an increase in the final period, while web exploits, DDoS, and hacktivism remain at comparatively lower volumes with overall downward trajectories. The significant drop in data breach and leak chatter may reflect monitoring coverage gaps as discussions migrate to less-visible platforms rather than reduced actual threat activity.

The energy & utilities Industry sits at high risk despite declining chatter volumes. The sector handles critical infrastructure, making it a high-value target by default. The sharp drop in data breach and leak mentions in the final period likely reflects forum disruptions and monitoring coverage gaps rather than reduced threat activity. The ongoing US/Israel vs Iran conflict adds meaningful elevation to this sector specifically, as energy infrastructure has historically been a primary target in state-nexus cyber operations tied to this conflict.
Data Breach and Data Leak: Chatter volumes decline sharply in the final period, most likely driven by BreachForums disruptions and migration of threat actor activity to invite-only forums and decentralized channels outside current monitoring scope. Actual exposure is likely higher than current visibility suggests.
Ransomware: Consistent decline across all periods but remains present. Targeted attacks against energy and utilities infrastructure remain probable given sector criticality and operational disruption potential.
Claimed Hacks: Modest increase in the final period despite overall declining chatter. Suggests continued active interest in energy and utilities access and credentials in underground markets.
Web Exploit and Hacktivism: Both are declining with minimal recent activity. However, given the ongoing US/Israel vs Iran conflict, energy infrastructure remains a credible target for state-nexus hacktivism and disruptive campaigns, representing a risk not fully reflected in current chatter volumes.
Over the past 90 days, CYFIRMA’s telemetry has identified 161 mentions of energy & utilities organizations out of a total of 3,959 industry mentions. This is from over 10k CVEs reported and updated in the last 90 days.
Energy & utilities organizations ranked 8th out of 14 industries in the last 90 days with a share of 4.07% of all detected industry-linked vulnerabilities.
Below is a breakdown by 30-day periods of all mentions.
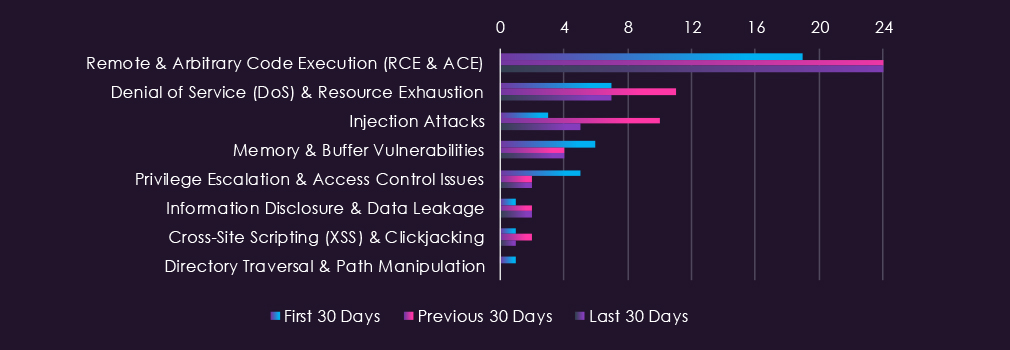
Reported CVEs in the energy & utilities sector over the last 90 days are dominated by remote and arbitrary code execution vulnerabilities, which spike mid-period and remain consistently elevated. Denial of service vulnerabilities show similar mid-period elevation before declining. Injection attacks spike mid-period before returning closer to initial levels. Memory and buffer vulnerabilities remain stable across periods. Privilege escalation, information disclosure, and cross-site scripting show minimal activity, while directory traversal is limited to a single initial period disclosure.

Energy & utilities CVE disclosures remain elevated, with RCE and ACE vulnerabilities consistently high across all periods, representing direct and critical risk to operational technology and SCADA-adjacent systems. Denial of service vulnerabilities show notable mid-period elevation, particularly concerning given the sector’s operational disruption potential. The ongoing US/Israel vs Iran conflict adds meaningful elevation, as state-nexus threat actors historically target energy infrastructure vulnerabilities for both espionage and disruption purposes.
Remote & Arbitrary Code Execution: It remains the dominant vulnerability category and stabilizes at elevated levels after a mid-period spike. Direct compromise potential against energy management systems and operational technology represents the primary CVE-driven risk in this sector.
Denial of Service: Mid-period spike reflects active disclosure of disruption-enabling vulnerabilities. In the critical infrastructure context, DoS vulnerabilities carry disproportionate operational risk compared to other sectors.
Injection Attacks: Mid-period spike followed by partial decline, but remains above initial levels. Reflects continued exposure of backend systems in energy management platforms.
Memory & Buffer Vulnerabilities: Stable and consistent across periods. Represents persistent low-level exposure in underlying system components common to operational technology environments.
Privilege Escalation: Declining trend but relevant given the sector’s sensitivity to unauthorized access to control systems and operational networks. Combined with RCE exposure, lateral movement risk remains present.
Geopolitical Context: State-nexus actors linked to the ongoing US/Israel vs Iran conflict have a documented history of targeting energy sector vulnerabilities for both intelligence gathering and pre-positioning for disruptive operations. Current CVE disclosure patterns, particularly RCE and DoS categories, align with known targeting priorities of relevant threat actors in this conflict context.
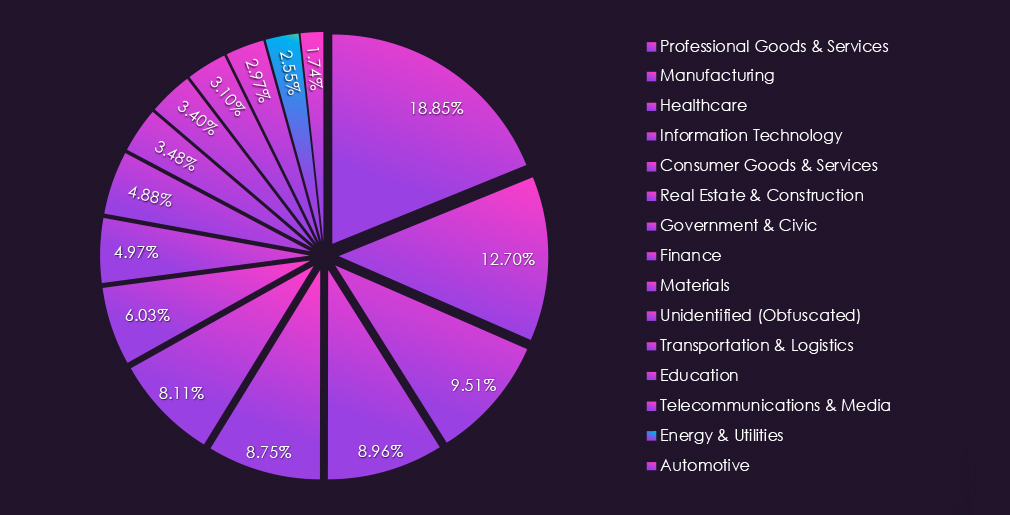
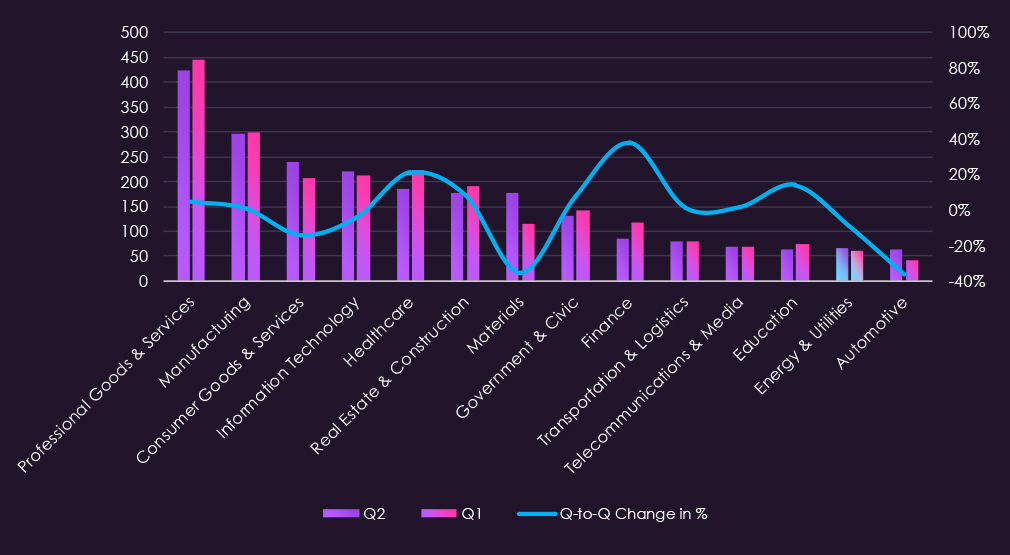
In the past 90 days, CYFIRMA has identified 60 verified ransomware victims in energy & utilities organizations. This accounts for 2.55% of all 2,355 ransomware victims during the same period, placing this sector 13th out of 14 industries.
Furthermore, a quarterly comparison shows that the number of victims in energy & utilities organizations has mildly declined. It went from 66 to 60 victims, a -9.1% drop. The overall interest, represented by share, also declined from 2.79% to 2.55% of all victims.
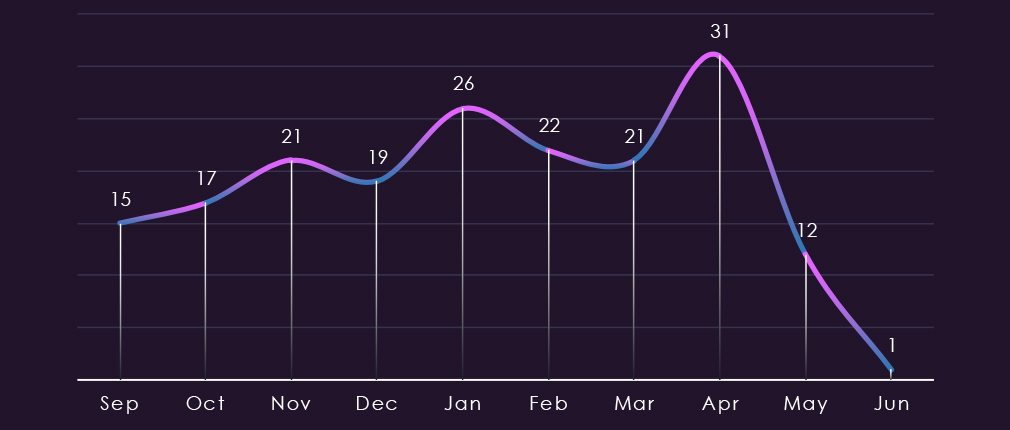
The monthly trendline shows us a gradually growing trend from September towards January. February and March recorded a minor dip, followed by a large spike during April. However, the number of victims in May was less than half of the April spike.
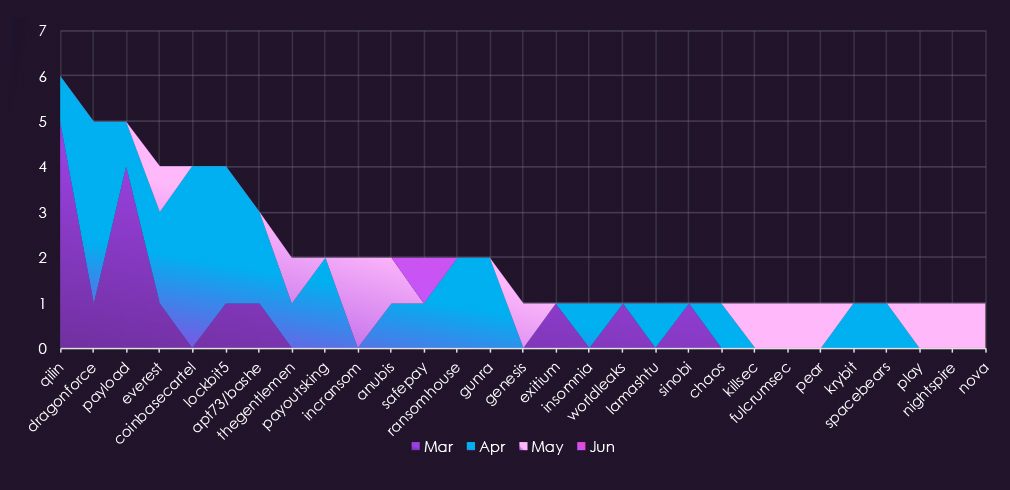
A breakdown of monthly activity per gang reveals which gangs were most active each month. For instance, gangs Qilin and Payload were highly active during March, and after only one victim each in April did not record new victims.
On the other hand, DragonForce and Coinbasecartel were mostly active in April, contributing to the April spike.
Lastly, gangs like Incransom or Genesis were behind the few May victims.
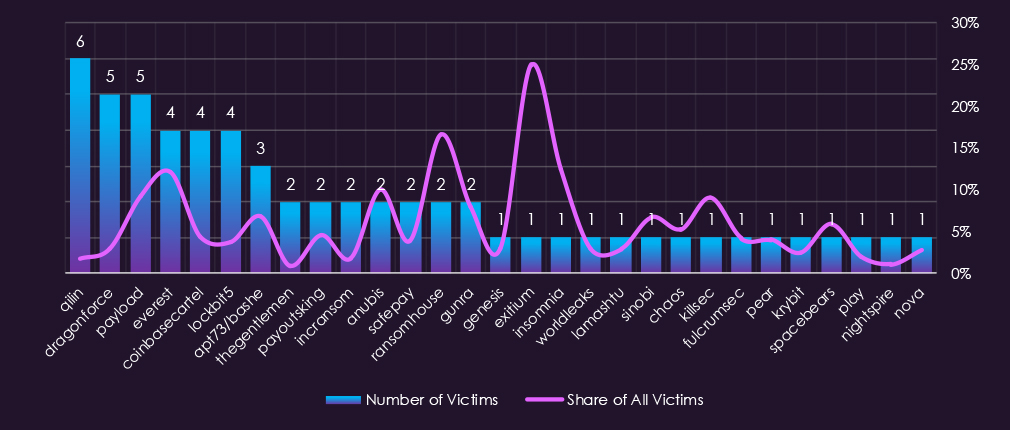
Out of the 80 gangs, 29 recorded victims in energy & utilities organizations in the last 90 days, representing a 36% participation.
Qilin had the highest number of victims, but only a 1.8% share out of all their 337 victims in this industry.
Everest stands out as the gang with the highest share (12%) of their victims from this industry. Disregarding the low total victim count in gangs.
Among gangs with more than 3 victims, on average, a 5.86% share of their victims are from this industry. That is about 1 in 17 victims.
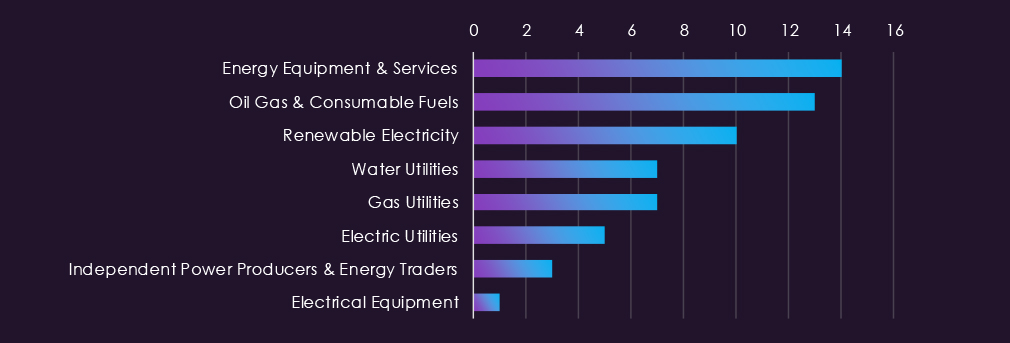
Energy Equipment & Services and Oil, Gas & Consumable Fuels led victim counts, with Renewable Electricity also recording notable activity. The spread across generation, distribution, and services subsectors reflects sustained threat actor interest in critical infrastructure where operational disruption carries significant consequences beyond data loss.
Water and Gas Utilities recorded moderate activity, while Electric Utilities and Independent Power Producers saw fewer incidents. The presence of victims across nearly every subsector underlines the breadth of targeting within this vertical.
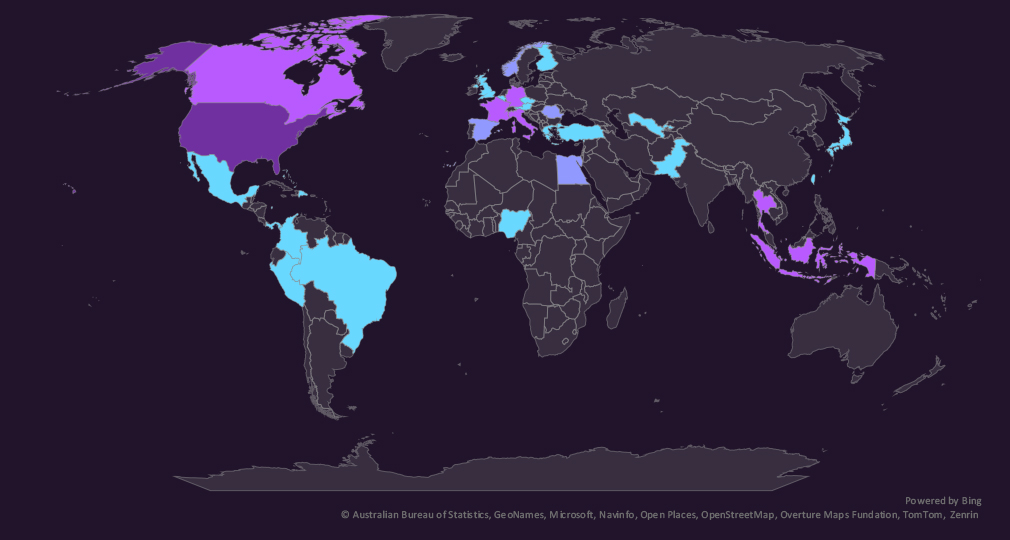
The geographic distribution heatmap underscores the widespread impact of ransomware, highlighting the countries where victims in this industry have been recorded.
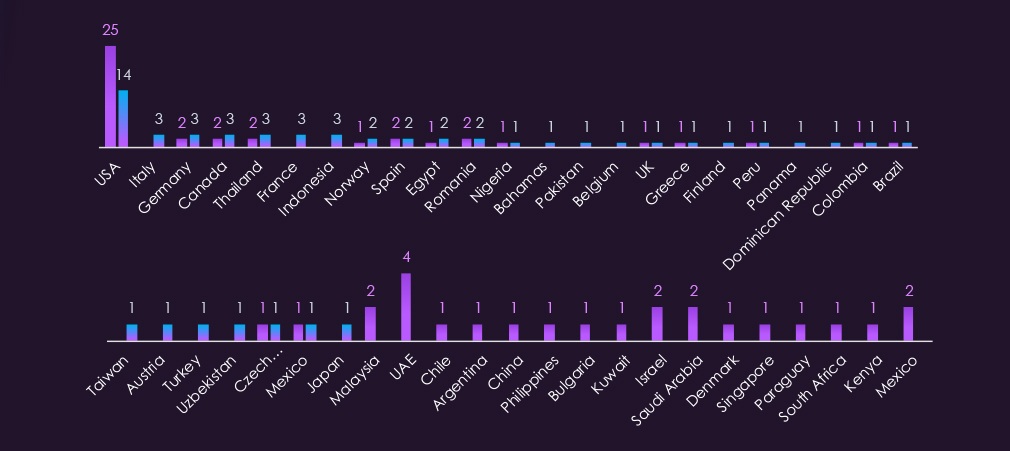
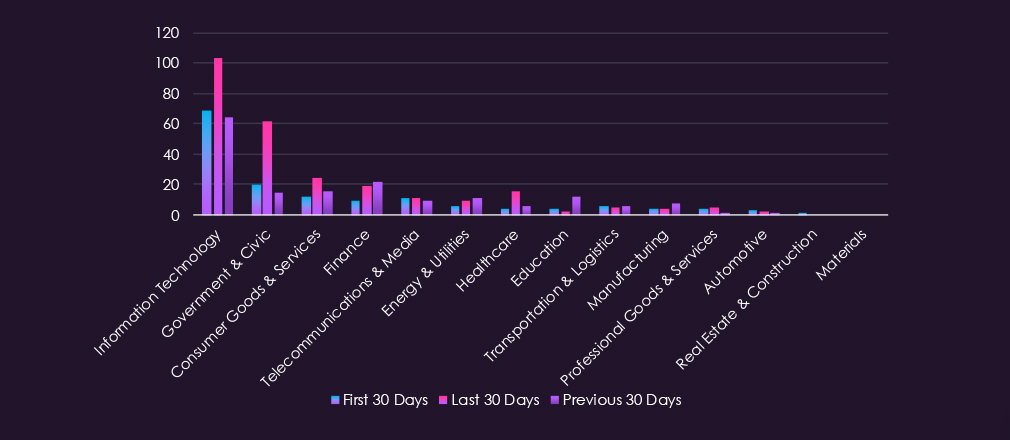
Finance victimology shows the USA as the most frequently targeted country, accounting for 23% of all victims. Activity is, however, very highly distributed, with 30 countries for 60 victims.
Italy, France, and Indonesia recorded the highest elevations in the last 90 days.
The USA, UAE, KSA, Israel, and Mexico saw the largest declines.
In the last 90 days, 30 countries recorded energy & utilities victims, 2 fewer than 32 countries in the previous period.

The Energy & Utilities sector threat landscape is expected to remain elevated through the next 90 days. The post-April decline is confirmed rather than a reporting artefact, but structural conditions sustaining high threat actor interest remain unchanged.
Volume outlook: The sharp May and June drop following the April peak is more consistent with an abrupt actor-level shift than an organic slowdown. A return toward mid-period volume levels is probable as groups resume normal operational tempo. The wide geographic footprint across 30 countries indicates a broad, multi-actor targeting pattern that is unlikely to contract significantly.
Actor behaviour: The breadth of groups active against this sector, combined with the sudden April cliff, suggests some actors may have deliberately reduced visible ransomware activity in response to heightened geopolitical attention on energy infrastructure. Operations may have continued through less attributable means not captured in the leak site data. Financially motivated actors are expected to resume activity as geopolitical visibility normalises.
Subsector risk: Renewable Electricity infrastructure presents a growing exposure as deployment accelerates ahead of security maturity in many operating environments. Energy Equipment & Services and Oil, Gas & Consumable Fuels remain consistently attractive targets given the operational leverage ransomware creates in time-sensitive supply environments.
Geographic targeting: Activity spans a wide range of countries with no single dominant region, consistent with opportunistic multi-actor targeting rather than focused campaigns. Emerging exposure across Southeast Asia and Latin America is expected to persist as energy infrastructure investment grows in those regions.
Operational risk: Even at reduced volume, successful attacks against water, gas, and electric utilities carry disproportionate consequence risk relative to victim count alone, sustaining the elevated risk rating through the next period.
APT Campaigns (Elevated): Energy & utilities featured in 10 of 27 campaigns (37%), up from 6 of 19 (32%) last period across a larger total campaign volume. Activity is predominantly state-sponsored and China-concentrated, with MISSION2074 recording the highest campaign count across all sectors this period. Lazarus Group and Charming Kitten also feature, while TA505 is the only financially motivated actor present. Remote desktop software, VPN solutions, and routers appear as targeted technologies alongside the dominant web application surface, pointing to persistent remote access objectives consistent with long-term infrastructure reconnaissance in energy environments. Geographic reach spans 30 victim countries, with the US, Japan, the UK, and India leading, and European energy infrastructure broadly represented.
Reported Cyber Incidents (High): 26 incidents recorded, with OT/ICS attacks as the dominant technique across all three 30-day periods. Iranian actor CyberAv3ngers conducted the most sustained campaign, repeatedly targeting US critical infrastructure, including PLCs and fuel tank monitoring systems. Venezuela’s energy sector was hit with wiper malware, causing significant disruption. Russia-linked actors targeted energy networks in Poland and Sweden. A first observed AI-assisted attack against energy OT infrastructure was recorded in Mexico, failing to breach systems but marking active capability development in this direction. Ransomware also featured, with Cl0p compromising a UK water company in a breach that went undetected for nearly two years.
Underground & Dark Web Chatter (Elevated): 976 mentions (2.28%) over 90 days. Data breach and data leak chatter declined sharply in the final period, dropping from 192 to 43 and 146 to 32, respectively. This decline most likely reflects BreachForums’ disruptions and migration of threat actor activity to invite-only and decentralised channels outside the current monitoring scope rather than reduced actual threat activity. Ransomware mentions declined from 85 to 25 across the period. The ongoing US/Israel vs. Iran conflict adds structural elevation to this sector specifically, as energy infrastructure has historically been a primary target in state-nexus operations tied to this conflict, and that risk is not fully captured in current chatter volumes.
Vulnerabilities (Elevated): 161 CVEs (4.07%) over 90 days. RCE vulnerabilities are the dominant category and remain consistently elevated across all periods, representing direct compromise potential against energy management systems and operational technology. Denial of service spiked mid-period, carrying disproportionate consequences in a sector where operational disruption is the primary risk. Injection vulnerabilities spiked mid-period before partial recovery. Memory and buffer vulnerabilities remain stable. The geopolitical context of the US/Israel vs. Iran conflict adds meaningful elevation, as state-nexus actors have a documented history of targeting energy sector vulnerabilities for pre-positioning ahead of disruptive operations.
Ransomware (Elevated): 60 victims (2.55%), a 9.1% decline from 66 last quarter. 29 of 80 active gangs recorded energy & utilities victims (36% participation rate). Everest recorded the highest sector share at 12% of their victims. Energy Equipment & Services and Oil, Gas & Consumable Fuels led sub-sector victim counts, with Renewable Electricity also recording notable activity, consistent with growing infrastructure deployment ahead of security maturity. Activity spans 30 countries; the USA accounts for 23%, with the remainder broadly distributed, suggesting opportunistic multi-actor targeting rather than focused campaigns. April spiked sharply before a significant May decline, though the structural conditions sustaining threat actor interest remain unchanged, and a return toward mid-period volumes is probable.