

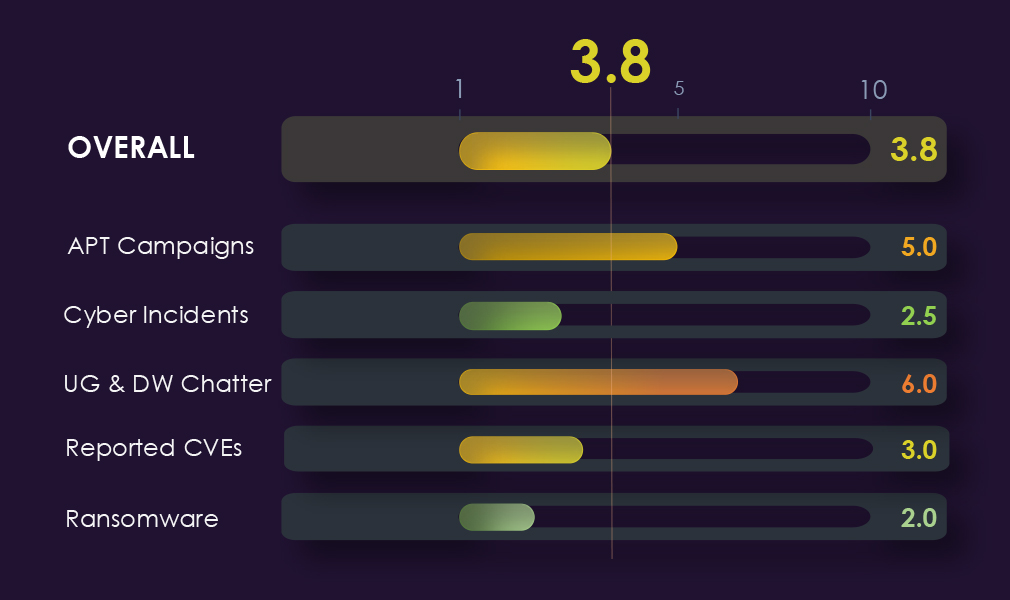
APT Campaigns – 5.0 ↑
Present in 20% of observed campaigns (5/25), up from zero last period, the most significant directional shift in this report. Exclusively state-sponsored profile with no financially motivated actors. China-linked groups dominate, led by MISSION2074 with 4 campaigns. Email, FTP, and SSHD server targeting distinguishes this sector, pointing to research data and institutional communications as primary objectives.
Cyber Incidents – 2.5 ↓
12 incidents at 1.49%, ranked 10th/14. Activity declined sharply from 9 in the first 30 days to 1–2 in subsequent periods. Supply chain attacks and spear-phishing were the primary identified techniques. China is the only attributed attacking country.
Dark Web Chatter – 6.0 ↑
3,536 mentions at 7.55%, ranked 7th/14. The headline signal is a coordinated disruption surge in the final period, hacktivism grew 7x across the period (28→216), and DDoS spiked 24x in the final 30 days alone (7→214). Data breach (514→237) and data leak (461→138) chatter declined sharply. Threat profile shifting from data theft toward ideologically motivated disruption.
Vulnerabilities – 4.5 ↓
156 CVEs at 3.94%, ranked 9th/14. RCE peaked mid-period and declined sharply (20→32→12); injection followed the same pattern (20→25→10). Overall volume fell in the final period (57→66→33). No escalating trajectory, declining across all major categories.
Ransomware – 2.0 ↓
54 victims, ranked 13th/14 at 2.36% share. Absolute count down 25% quarter-on-quarter (72→54) with share also declining (3.29%→3.04%). Gang participation at 29% (23/79) is the lowest of any sector. Leading gangs show only 2–3% sector concentration. Interlock is the only outlier, directing 27.3% of its victims to education organisations. Monthly activity down on average, no escalation signal.
The CYFIRMA Industry Report delivers original cybersecurity insights and telemetry-driven statistics of global industries, covering one sector each week for a quarter. This report focuses on the education industry, presenting key trends and statistics in an engaging infographic format.
Welcome to the CYFIRMA infographic industry report, where we delve into the external threat landscape of the education industry over the past three months. This report provides valuable insights and data-driven statistics, delivering a concise analysis of attack campaigns, phishing telemetry, and ransomware incidents targeting schools, universities, colleges, and other educational organizations.
We aim to present an industry-specific overview in a convenient, engaging, and informative format. Leveraging our cutting-edge platform telemetry and the expertise of our analysts, we bring you actionable intelligence to stay ahead in the cybersecurity landscape.
CYFIRMA delivers pre-emptive cybersecurity, cyber threat intelligence, and external threat landscape management through its platforms, DeCYFIR and DeTCT. These platforms have been purpose-built over many years to continuously collect, correlate, and analyse large volumes of external threat data, combining proprietary intelligence automation with deep, hands-on cyber threat research.
For the purpose of this report, the analysis draws on intelligence generated from CYFIRMA’s platforms. The data referenced has been processed through automated correlation and enrichment mechanisms, informed and validated by human-led research and investigative expertise, and sourced from both structured and unstructured external intelligence channels.
While this report contains data collected and processed by our in-house AI and ML, all charts, statistics, and analyses are done by human CYFIRMA CTI analysts to ensure the highest quality and provide accurate insights.
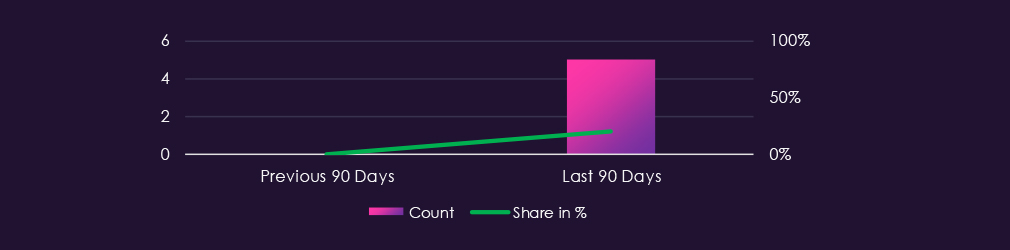
Education organizations featured in 5 out of the 25 observed campaigns, which is a presence in 20% of all campaigns, an increase from the previous period, where education organizations were present in none out of the 11 campaigns.

Out of the five campaigns, two were observed in February and the remaining three in April. February and the previous months observed campaigns; however, detections were updated, and campaigns have moved to March and April.
Observed APT campaigns show an exclusively state-sponsored actor profile this period, with no financially motivated actors present.
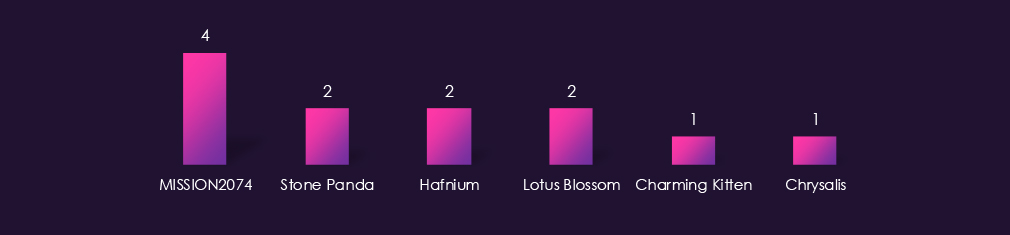
China-linked groups account for all confirmed attributions, with MISSION2074 leading, followed by Stone Panda, Hafnium, and Lotus Blossom. Iran-linked Charming Kitten is the only non-Chinese state actor observed.
The narrow actor profile, combined with the education sector’s concentration of research institutions and intellectual property, suggests campaigns are primarily driven by strategic intelligence collection objectives.
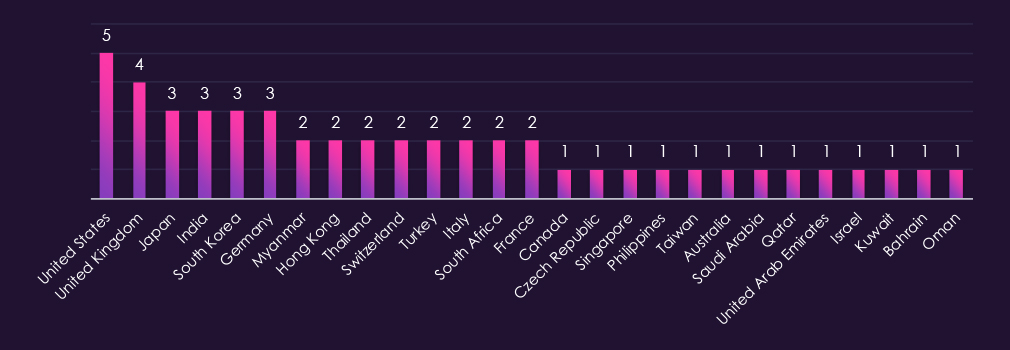
Victim distribution spans 27 countries, with the United States recording the highest victim count, followed by the United Kingdom, Japan, India, South Korea, and Germany. The top tier is more geographically diverse than in other sectors, with European countries featuring more prominently relative to Asia-Pacific.
Myanmar and Hong Kong both appear in the mid-frequency tier, consistent with the China-linked actor profile and known targeting of diaspora and regional research institutions. Middle Eastern presence spans multiple Gulf states, including Saudi Arabia, Qatar, Kuwait, Bahrain, and Oman, consistent with Iran-linked Charming Kitten’s known targeting patterns in that region.
Remaining victims are spread across Southeast Asia, continental Europe, Africa, and isolated cases in East Asia, reflecting broad but low-frequency targeting outside the primary concentration areas.
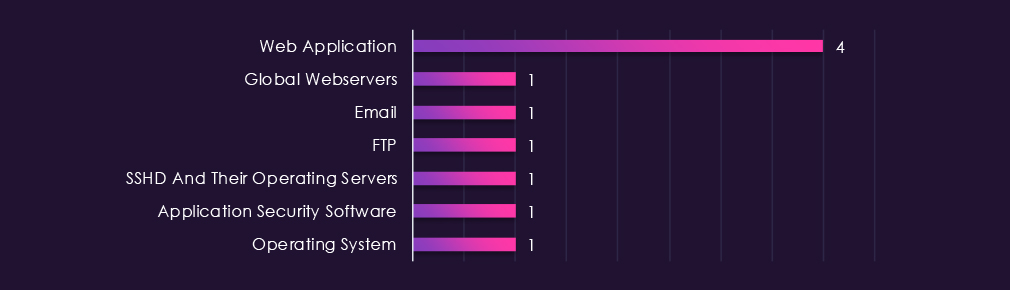
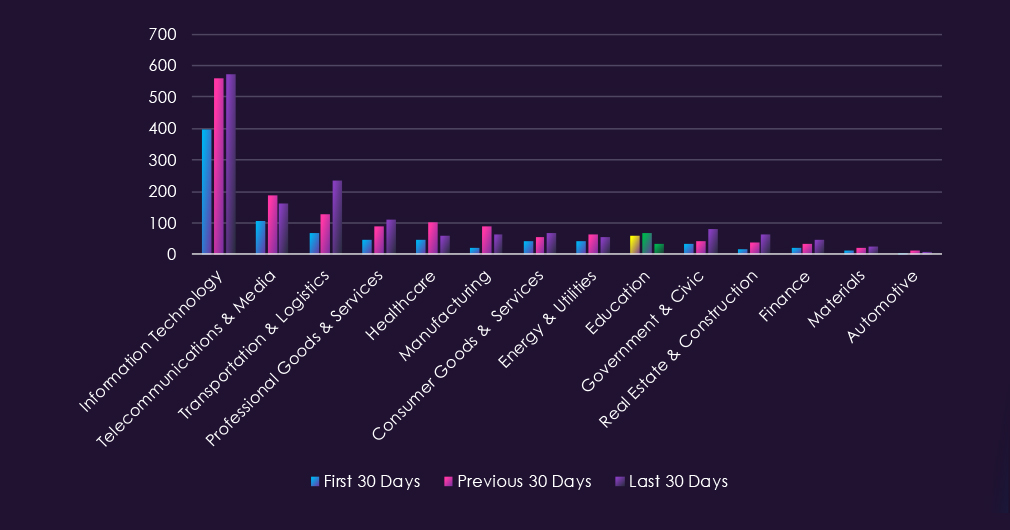
Web applications record the highest number of observed attacks, though the margin over other categories is narrower than in most sectors this period. The remaining targeted technologies — global webservers, email, FTP, SSHD servers, application security software, and operating systems — each recorded single instances.
The technology profile is notably different from other sectors, with email, FTP, and SSHD servers appearing in place of the typical network infrastructure categories such as VPNs and routers. This pattern is consistent with threat actor interest in accessing research data and institutional communications, aligning with the education sector’s concentration of intellectual property.

Over the past 90 days, the education industry has been moderately impacted by advanced persistent threat (APT) campaigns.
5 out of 25 observed APT campaigns recorded victims in this industry. That is a 20% presence in observed campaigns.
That is an increase from the previous 90-day period, during which none of the 11 campaigns targeted this industry.
Monthly Trends
Of the five campaigns, two were observed in February and three in April. While campaigns were also seen in February and earlier months, updated detections have since shifted them to March and April.
Key Threat Actors
Campaigns show an exclusively state-sponsored actor profile, with no financially motivated actors observed in this period. China-linked groups account for all confirmed attributions, with MISSION2074 leading, followed by Stone Panda, Hafnium, and Lotus Blossom. Iran-linked Charming Kitten is the only non-Chinese state actor present, consistent with known Iranian interest in targeting academic and research institutions.
Geographical Impact
Victim distribution spans 27 countries, with the United States recording the highest victim count, followed by the United Kingdom, Japan, India, South Korea, and Germany. European countries feature more prominently relative to the Asia-Pacific compared to other sectors. Myanmar and Hong Kong appear in the mid-frequency tier, consistent with China-linked actor targeting patterns. Gulf states, including Saudi Arabia, Qatar, Kuwait, Bahrain, and Oman reflect Iran-linked actor activity in the region.
Targeted Technologies
Web applications record the highest number of observed attacks, though the margin over other categories is narrower than in most sectors. Email, FTP, and SSHD server targeting distinguishes this sector from others, pointing to threat actor interest in accessing research data and institutional communications rather than infrastructure compromise.
Over the past 90 days, DeCYFIR and DeTCT platforms tracked 806 cyber incidents reported publicly. We could identify the industry for 505 of these incidents (68.9%).
Education was detected in 12 incidents, which equals 1.49% of the incidents where we knew the industry, ranking 10th out of 14 industries.
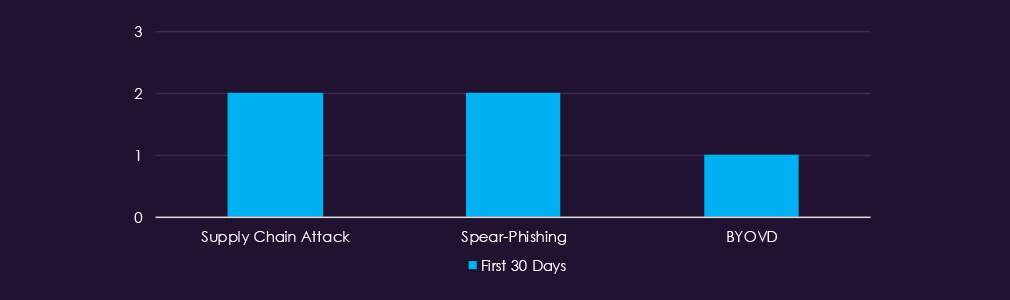
The attack technique was available only in reports during the first 30 days, with no technique data available for subsequent periods despite continued incident reporting.
Supply chain attacks and spear-phishing each appeared twice, suggesting both infrastructure compromise and targeted social engineering were employed against education sector organizations. BYOVD (Bring Your Own Vulnerable Driver) appeared once, indicating the use of more sophisticated evasion techniques typically associated with advanced threat actors. The combination of these techniques suggests deliberate, targeted campaigns rather than opportunistic activity, though the limited volume prevents confident conclusions.
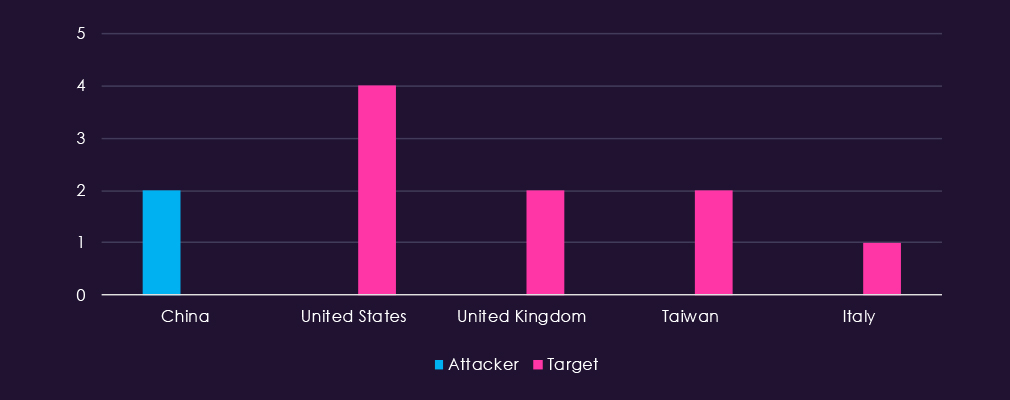
Attacking country attribution was limited, with China the only identified source across 2 incidents. Victim attribution was more complete, with the United States accounting for the most targets, followed by the United Kingdom and Taiwan, and an isolated case in Italy. The pattern of China-linked activity targeting Western and Asia-Pacific education institutions is consistent with known state-sponsored interest in academic research and intellectual property. As with other sectors, victim countries were more frequently disclosed than attacking nations in public reporting.

Over the past 90 days, the education organizations have not been significantly impacted by cyber incidents.
12 out of 556 industry-linked cyber incident reports were against education organizations. That is a 1.49% presence, ranking 10th out of 14 industries.
Monthly Trends
Activity has declined from 9 to 1 and 2 incidents in the respective 30-day period.
Attack Techniques
Attack technique identification was limited to the incidents from the first 30 days, with no technique data available for subsequent incident reporting. Supply chain attacks and spear-phishing each appeared twice, suggesting both infrastructure compromise and targeted social engineering were employed against education sector organizations. BYOVD appeared once, indicating the use of more sophisticated evasion techniques typically associated with advanced threat actors.
Geographical Impact
Attacking country attribution was limited, with China the only identified source across 2 incidents. Victim attribution was more complete, with the United States accounting for the most targets, followed by the United Kingdom and Taiwan, and an isolated case in Italy. The pattern of China-linked activity targeting Western and Asia-Pacific education institutions is consistent with known state-sponsored interest in academic research and intellectual property. Victim countries are generally more frequently disclosed than the attacking nations in public reporting.
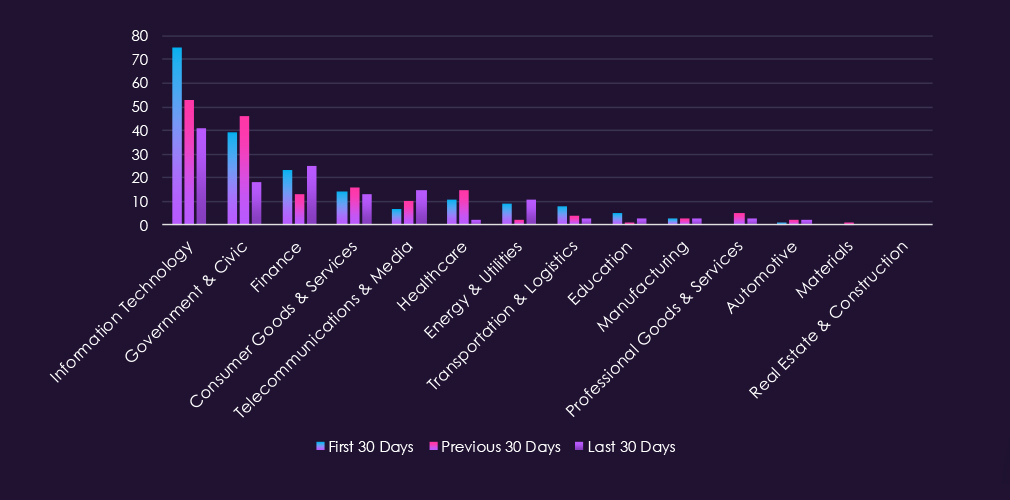
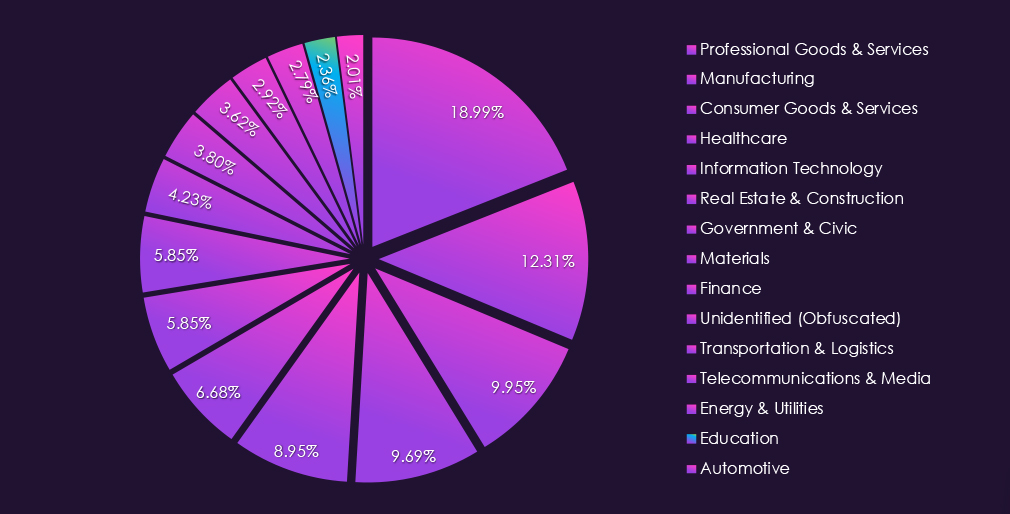
Over the past 90 days, CYFIRMA’s telemetry has identified 3.536 mentions of education organizations out of a total of 46,851 industry-linked mentions. This is from a total of 300k+ posts across various underground and dark web channels and forums.
Education organizations placed 7th out of 14 industries in the last 90 days, with a share of 7.55% of all detected industry-linked chatter.
Below is a breakdown by a 30-day period of all mentions.
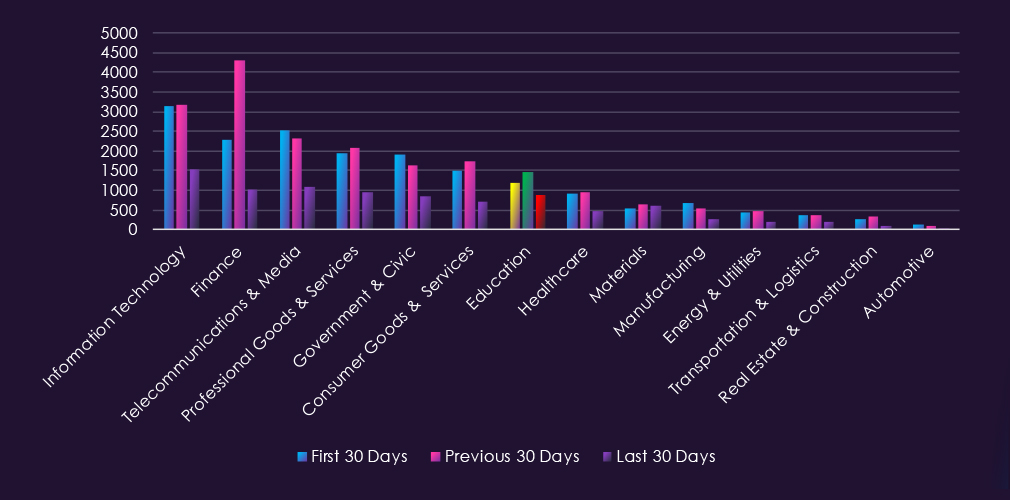
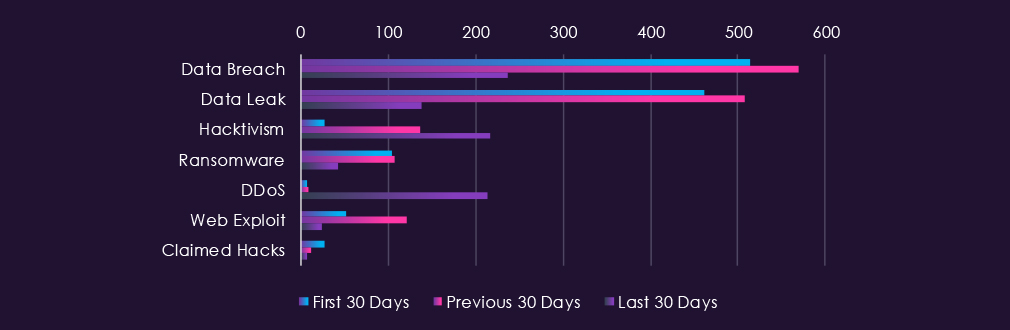
Underground & dark web chatter related to the education sector over the last 90 days shows significant volatility across threat categories. Data breaches and data leaks decline substantially in the final period, dropping from 514 to 237 and 461 to 138, respectively. Hacktivism shows a dramatic surge, more than tripling from 28 to 216 mentions in the final period. DDoS activity spikes sharply in the final period to 214 mentions after minimal prior activity. Ransomware mentions decline from 104 to 42. Web exploits show a significant mid-period elevation, followed by a sharp decline, while claimed hacks remain at minimal levels with an overall downward trend.

In total, education organizations comprise 7.55% of all detected industry underground and dark web chatter in the last 90 days, ranking 7th out of 14 industries.
Below are the observed key trends across 90 days:
Data Breach
514 → 569 → 237. An initial rise followed by a substantial decline in the final period. Education entities remain targeted due to student records, staff credentials, and institutional data, though the sharp downward trend in the final period suggests reduced dark web focus on newly surfaced compromises.
Data Leak
461 → 508 → 138. An initial rise followed by a significant decline in the final period. Indicates reduced circulation of education-related data, such as student information, staff records, and institutional credentials, in dark web postings recently.
Hacktivism
28 → 137 → 216. Dramatic and consistent increase across all periods, more than sevenfold from initial levels. Suggests a significant surge in ideological targeting of education infrastructure, potentially linked to geopolitical narratives, information influence operations, or reactions to institutional policies.
Ransomware
104 → 108 → 42. Decline in the final period after initial stability. Ransomware targeting of the education sector is decreasing, potentially reflecting reduced perceived return on investment or shifts in attacker priorities.
DDoS
7 → 9 → 214. Sharp and dramatic spike in the final period. Indicates a significant surge in disruption-based attacks against education infrastructure, likely coordinated with the concurrent surge in hacktivism activity.
Web Exploit
52 → 121 → 24. Mid-period elevation followed by a sharp decline. Reflects variable probing of education platforms, student portals, and institutional systems with reduced emphasis recently.
Claimed Hacks
28 → 12 → 7. Consistent decline across all periods. Suggests reduced publicly claimed intrusions or access sales involving education entities.
Over the past 90 days, CYFIRMA’s telemetry has identified 156 mentions of education organizations out of a total of 3,959 industry mentions. This is from over 10k CVEs reported and updated in the last 90 days.
Education organizations ranked 9th out of 14 industries in the last 90 days, with a share of 3.94% of all detected industry-linked vulnerabilities.
Below is a breakdown by a 30-day period of all mentions.
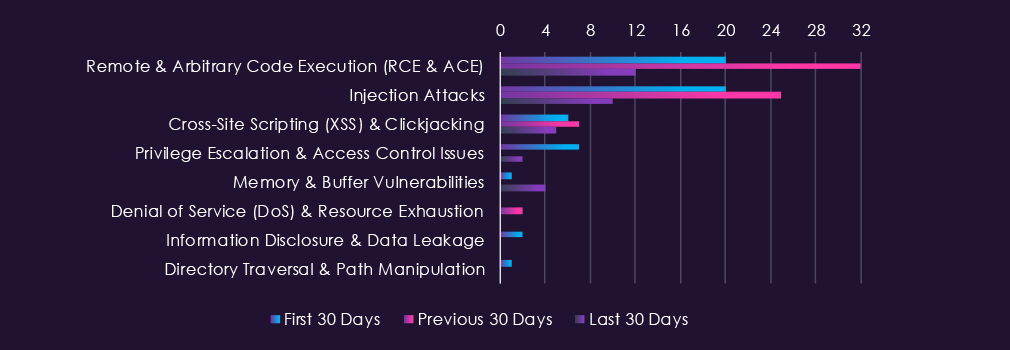
Reported CVEs in the education sector over the last 90 days show declining activity in high-impact vulnerabilities. Remote and arbitrary code execution vulnerabilities spike mid-period before declining sharply to 12 in the final period. Injection attacks show similar patterns, declining from 25 to 10 in the final period. Cross-site scripting vulnerabilities remain stable at low levels. Privilege escalation issues and memory vulnerabilities show minimal and variable activity, while denial of service, information disclosure, and directory traversal remain at negligible levels.

In total, info education organizations comprise of 3.94% of all detected industry-linked vulnerabilities in the last 90 days. And ranking 9th out of 14 industries.
Below are observed key trends across 90 days:
Remote & Arbitrary Code Execution (RCE & ACE)
20 → 32 → 12. Mid-period spike followed by a sharp decline in the final period. RCE and ACE vulnerabilities represent high-impact threats to education systems due to direct compromise potential and access to student and institutional data.
Injection Attacks
20 → 25 → 10. Mid-period elevation followed by a significant decline in the final period. Reflects variable disclosure of vulnerabilities targeting application logic and backend systems in education platforms and learning management systems.
Cross-Site Scripting (XSS) & Clickjacking
6 → 7 → 5. Minimal and stable activity across all periods. Reflects limited client-side vulnerability disclosures affecting education web applications.
Privilege Escalation & Access Control Issues
7 → 0 → 2. Minimal and variable activity across periods. Reflects sporadic disclosures of vulnerabilities enabling lateral movement and privilege advancement in education systems.
Memory & Buffer Vulnerabilities
1 → 0 → 4. Emergence of activity in the final period. Represents minimal but variable disclosure in this vulnerability category.
Denial of Service (DoS) & Resource Exhaustion
0 → 2 → 0. Minimal and sporadic activity. Represents negligible disclosure volume of DoS-enabling vulnerabilities.
Information Disclosure & Data Leakage
2 → 0 → 0. Decline to zero in mid and final periods. Represents minimal and inconsistent disclosure activity.
Directory Traversal & Path Manipulation
1 → 0 → 0. Single disclosure in the initial period. Represents negligible activity in this vulnerability category.
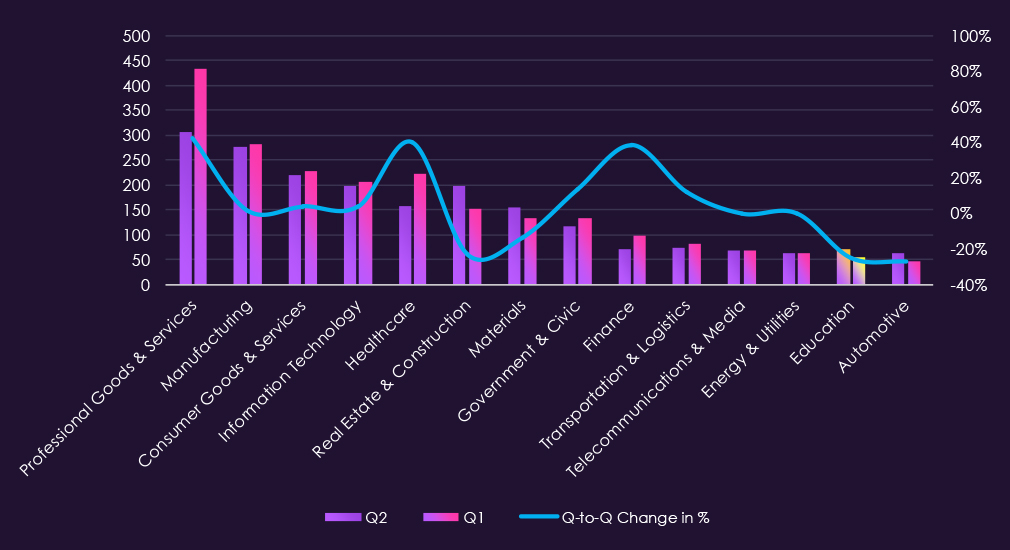
In the past 90 days, CYFIRMA has identified 54 verified ransomware victims in education organizations. This accounts for 2.36% of all 2,291 ransomware victims during the same period, placing this sector 13th out of 14 industries.
Furthermore, a quarterly comparison shows that the number of victims in education organizations has significantly declined. It went from 72 to 54 victims, a -25.0% decrease. The overall interest, represented by the share, also declined from 3.29% to 3.04% of all victims.
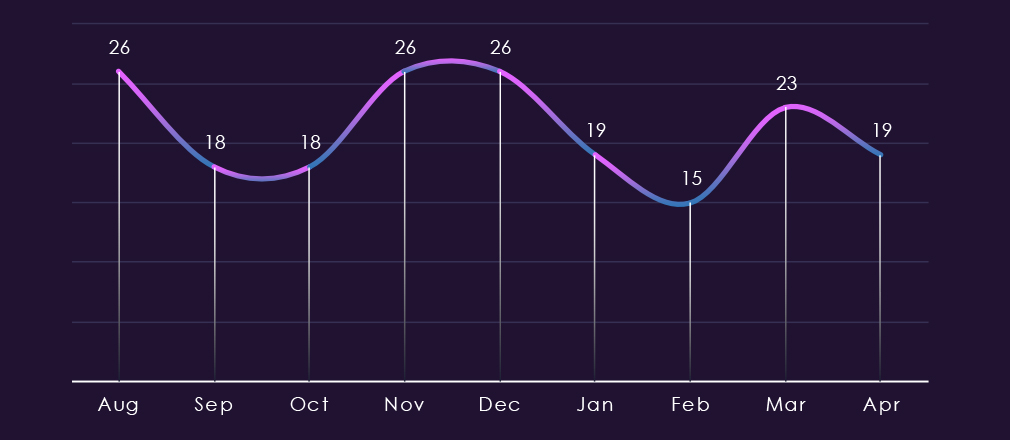
The monthly trendline shows us oscillating activity. Interestingly, spikes and dips remained around similar values over the past 180 days, swinging between 26 and 18-19, with the lowest dip being 15 during February.
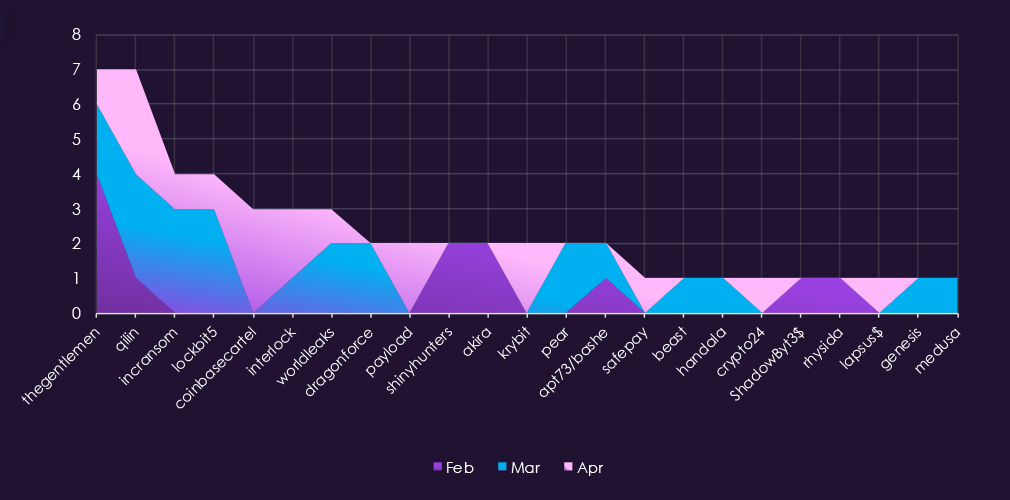
A breakdown of monthly activity per gang reveals which gangs were most active each month. For instance, the leading gang Qilin, after a higher volume in February, recorded a low number of victims in the following months.
Furthermore, LockBit5 has been most active during March, whereas Coinbasecartel recorded all education victims in April.
Lastly, many gangs like Dragonforce, Payload, Akira, and Pear contributed only during a single month.
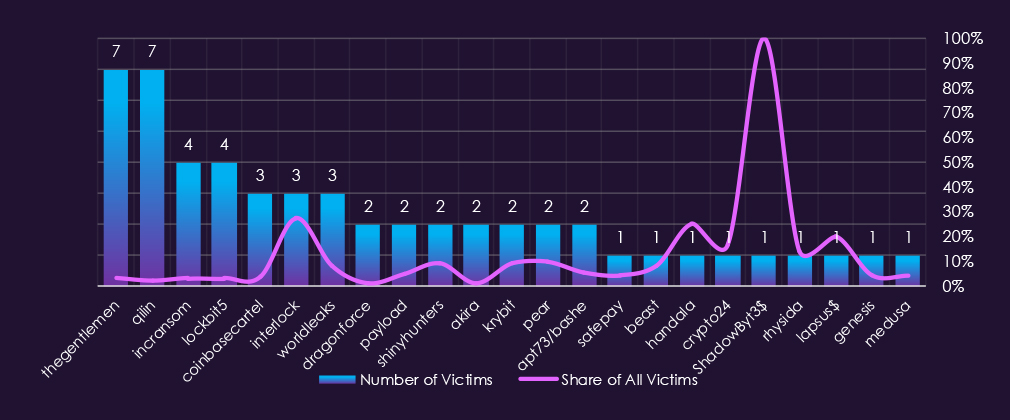
Out of the 79 gangs, 23 recorded victims in education organizations in the last 90 days, representing a 29% participation.
The Gentlemen and Qilin had the highest number of victims, but just 3.2% and 2.0% share out of all their 219 and 348 victims in this industry.
Only two of the gangs with 3 or more victims show significant interest in education. Interlock with 27.3% is by far the most focused gang. Second highest is Worldleaks with only 8.3%.
Among gangs with more than 2 victims, on average, 7.02%, without the 27.3% outlier, it falls to just 5.46%. That is about 1 in 18 victims.
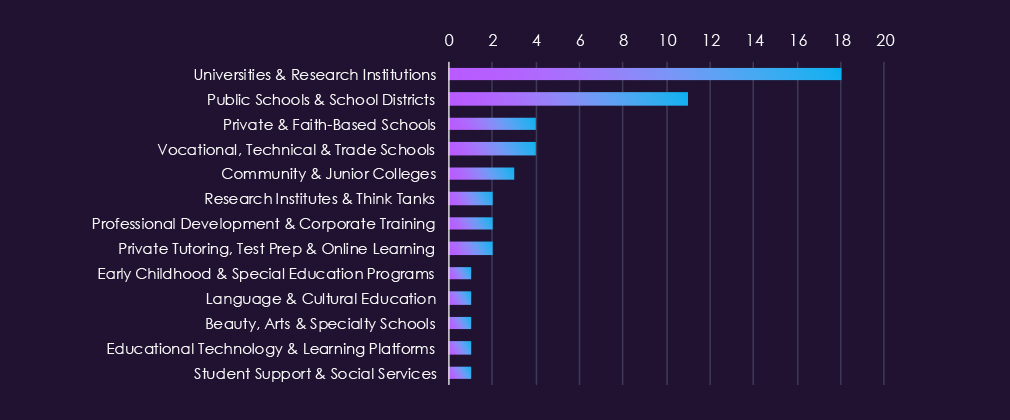
Universities and research institutions accounted for most of the victims by a considerable margin. Public schools and school districts were the second most affected group, reflecting the vulnerability of under-resourced institutions managing large volumes of student records.
Activity across the remaining subsectors was sparse, with most recording only one or two victims. The spread across vocational schools, community colleges, tutoring providers, and specialist institutions suggests ransomware operators are not limiting their focus to large academic targets.
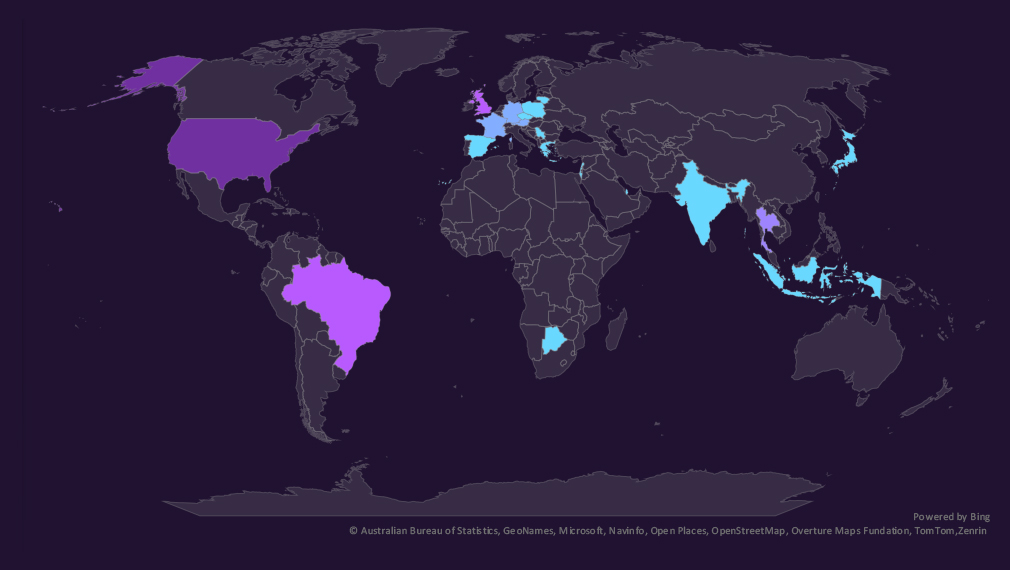
The geographic distribution heatmap underscores the widespread impact of ransomware, highlighting the countries where victims in this industry have been recorded.
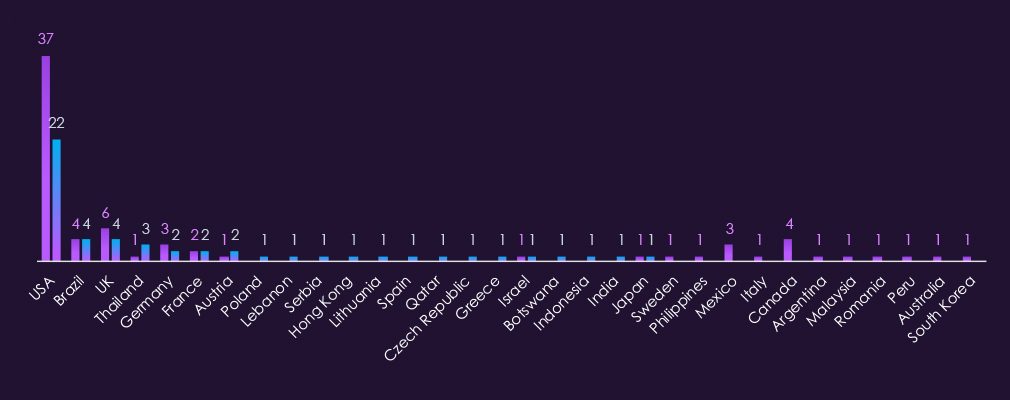
Education victimology shows the USA as the most frequently targeted country, accounting for 41% of all victims. The USA is also the main driver behind the decline in the number of victims, with 15 less than the previous quarter.
Thailand recorded the highest elevation with 3 education sector victims in the last 90 days.
Canada, Mexico, and the UK recorded the largest declines.
In the last 90 days, 21countries recorded education victims. Just one more than 20 countries in the previous period.

Education organizations ranked 13th out of 14 monitored industries, recording 54 victims in the last 90 days, a significant increase of -25.0% from the previous 72.
Overall share also dropped from 3.29% to 3.04% of all ransomware victims.
Universities and research institutes were the most targeted, followed by public schools and school districts. Remaining activity was spread across vocational schools, community colleges, tutoring services, or specialist institutions.
Monthly Activity Trends
The monthly trendline shows us alternating activity. Peaks and lows remained around similar values across 180 days, swinging between 26 and 18-19, with the lowest dip of 15 during February.
Ransomware Gangs
A total of 23 out of 79 active ransomware groups targeted this sector in the past 90 days. That is 29% participation.
Qilin: Continuously the most active gang with 348 victims across industries in the last 90 days. 7 were from this sector (2.0%).
TheGentlemen: Placed in shared first place with Qilin and 7 victims. Similarly, it was only a fraction (3.2%) of all their victims.
Interlock: Outlier with 27.3% of their victims being from education organisations, suggesting a focused interest. However much smaller victim count (3 out of 11).
The average share among groups with more than 2 victims was 7.02%.
Geographic Distribution
The geographic distribution of ransomware victims is concentrated in the USA, recording 41% of all victims.
Thailand recorded the highest elevations.
Canada, Mexico and the UK on the other hand the largest declines.
For a comprehensive, up-to-date global ransomware tracking report, please refer to our new monthly “Tracking Ransomware” series here.
APT Campaigns (Moderate): Education recorded zero APT campaign victims in the prior period. This period saw five, marking a notable emergence. Activity is exclusively state-sponsored, with no financially motivated actors present. China-linked groups dominate, while Iran’s Charming Kitten is the only non-Chinese actor, consistent with known Iranian interest in academic and research institutions. Uniquely among sectors, email, FTP, and SSHD server targeting distinguishes this sector, pointing to research data and institutional communications as primary objectives rather than infrastructure compromise.
Reported Cyber Incidents (Low): Reported incident volume is low, declining sharply from 9 in the first period to 1-2 in subsequent periods. Supply chain attacks and spear-phishing were the primary techniques identified, with BYOVD appearing once, a more sophisticated evasion technique typically associated with advanced actors. China was the only identified attacking country. The low volume likely reflects under-reporting rather than low risk, consistent with known targeting patterns observed in APT data.
Underground & Dark Web Chatter (Moderate): The sector ranked 7th overall, but the most striking signals this period are in hacktivism and DDoS. Hacktivist mentions grew more than sevenfold across the period, while DDoS chatter spiked dramatically in the final period to 214, up from just 9 mid-period. The two trends appear coordinated, suggesting an organized campaign of ideologically motivated disruption targeting education infrastructure. Breach and leak volumes declined sharply in the final period despite elevated mid-period activity.
Vulnerabilities (Low): RCE and injection attack vulnerabilities both spiked mid-period before declining sharply in the final period, suggesting a concentrated disclosure window rather than a sustained trend. Overall vulnerability volume is moderate relative to other sectors. The more notable concern for this sector comes from the dark web and APT data rather than the vulnerability disclosure profile itself.
Ransomware (Low): 54 victims, down 25% from 72 in the prior period. Universities and research institutes are the most targeted, followed by public schools and school districts. Gang participation is the lowest across all sectors at 29%. Interlock stands out as an outlier, directing 27.3% of its total victims at education organizations, a small but deliberate focus. Activity has been relatively flat across 180 days with no sustained escalation trend.