

REAL ESTATE & CONSTRUCTION Q1 I 2026 : INDUSTRY REPORT
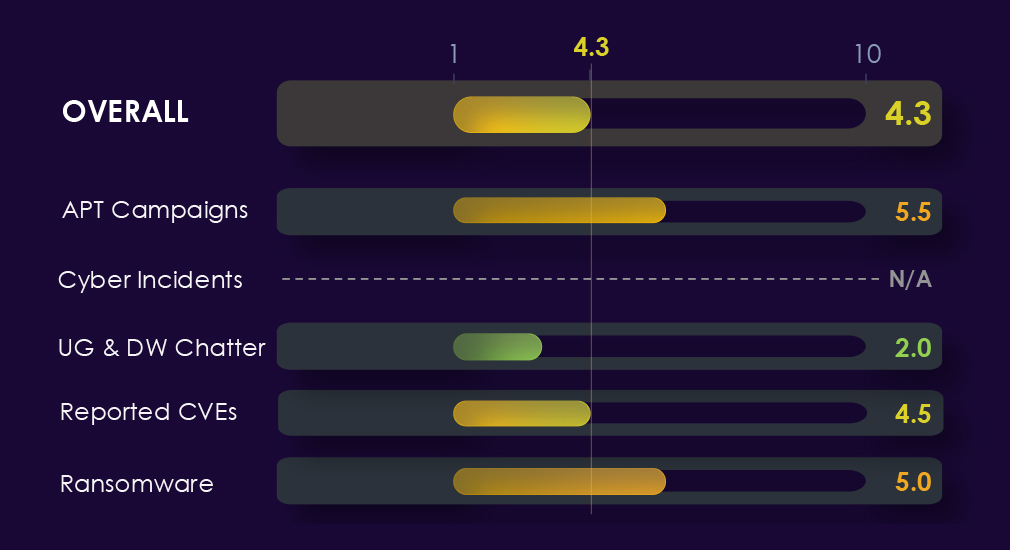
APT Campaigns – 5.5 ↓
Present in 44% of observed campaigns (7/16), same absolute count as prior quarter but share down from 64%, as overall campaign volume grew. China-linked actors dominate heavily. MISSION2074 led with 5 campaigns, alongside 6 additional Chinese groups. Targeting profile points to strategic intelligence and infrastructure reconnaissance. Monthly activity is rising, with April recording the highest count this period at 3 campaigns.
Cyber Incidents – N/A
Only industry with zero reported incidents this period. Assessed as under-reporting bias and excluded from the overall score.
Dark Web Chatter – 2.0 ↓
855 mentions at 1.50% share. Every category declined consistently across the period. Data breach (142→77), ransomware mentions (103→69), data leaks (75→42). Overall chatter volume fell 43%. Likely reflects under-reporting bias consistent with the zero cyber incident result, rather than a genuine absence of adversary interest.
Vulnerabilities – 4.5 ↑
Total CVEs rose from 13 to 62 across the period. RCE nearly quadrupled (8→30); XSS spiked 14x with the sharpest rise in the final 30 days (1→14); injection attacks grew 8x. Low absolute volume, but the steepest escalation trajectory observed across all sections – the primary watchlist signal for this sector.
Ransomware – 5.0 →
158 victims across 27 countries, down 15.5% in absolute terms but share held essentially flat (5.76%→5.95%), indicating sustained TA interest. Activity stabilised between 40–55 victims per month across the quarter. General and specialty trade contractors were most impacted. Several major gangs show notable sector concentration – Cl0p at 18.5%, Play at 14.7%, and Safepay at 14.3% of their respective victim pools.
The CYFIRMA Industries Report delivers original cybersecurity insights and telemetry-driven statistics of global industries, covering one sector each week for a quarter. This report focuses on the real estate & construction, presenting key trends and statistics in an engaging infographic format.
Welcome to the CYFIRMA infographic industry report, where we delve into the external threat landscape of the real estate & construction industry over the past three months. This report provides valuable insights and data-driven statistics, delivering a concise analysis of attack campaigns, phishing telemetry, and ransomware incidents targeting real estate developers, architect studios, and contractors, among others, in this industry.
We aim to present an industry-specific overview in a convenient, engaging, and informative format. Leveraging our cutting-edge platform telemetry and the expertise of our analysts, we bring you actionable intelligence to stay ahead in the cybersecurity landscape.
CYFIRMA delivers pre-emptive cybersecurity, cyber threat intelligence, and external threat landscape management through its platforms, DeCYFIR and DeTCT. These platforms have been purpose-built over many years to continuously collect, correlate, and analyse large volumes of external threat data, combining proprietary intelligence automation with deep, hands-on cyber threat research.
For the purpose of this report, the analysis draws on intelligence generated from CYFIRMA’s platforms. The data referenced has been processed through automated correlation and enrichment mechanisms, informed and validated by human-led research and investigative expertise, and sourced from both structured and unstructured external intelligence channels.
While this report contains data collected and processed by our in-house AI and ML, all charts, statistics, and analyses are done by human CYFIRMA CTI analysts to ensure the highest quality and provide accurate insights.
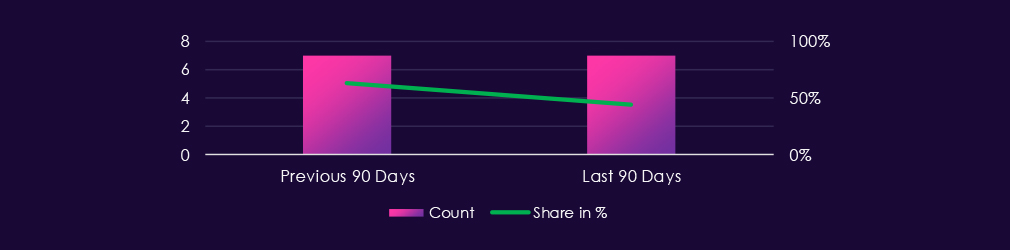
The real estate & construction industry featured in 7 out of the 16 observed campaigns, which is a presence in 44% of all campaigns, the same as the previous period, where real estate & construction organizations were present in 7 out of 11 campaigns; however, a decline from 64% presence.

APT activity against the real estate & construction industry has sustained for months, oscillating between 1 and 2 campaigns from January to March, and mildly jumping to 3 in April.
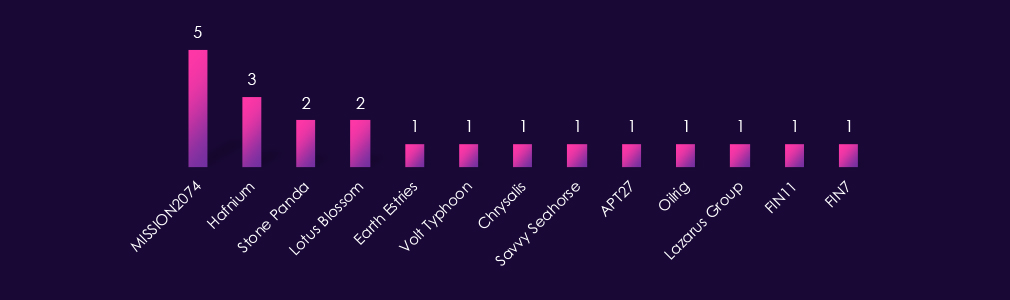
Observed APT campaigns show the strongest concentration of China-linked, state-sponsored actors across all sectors covered this period. MISSION2074 leads with the highest number of observed campaigns, followed by Hafnium, with Stone Panda, Lotus Blossom, APT27, Earth Estries, and Volt Typhoon providing additional China-aligned representation.
Iran-linked OilRig and North Korea-associated Lazarus Group each appear in a single campaign. Financially motivated actors FIN11 and FIN7 are present at low frequency, alongside the suspected Russian-speaking Savvy Seahorse. The overall profile suggests activity driven primarily by strategic intelligence and infrastructure reconnaissance objectives.
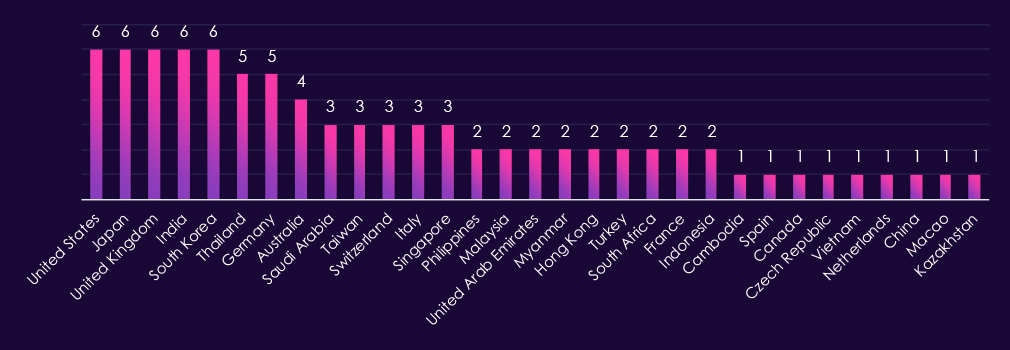
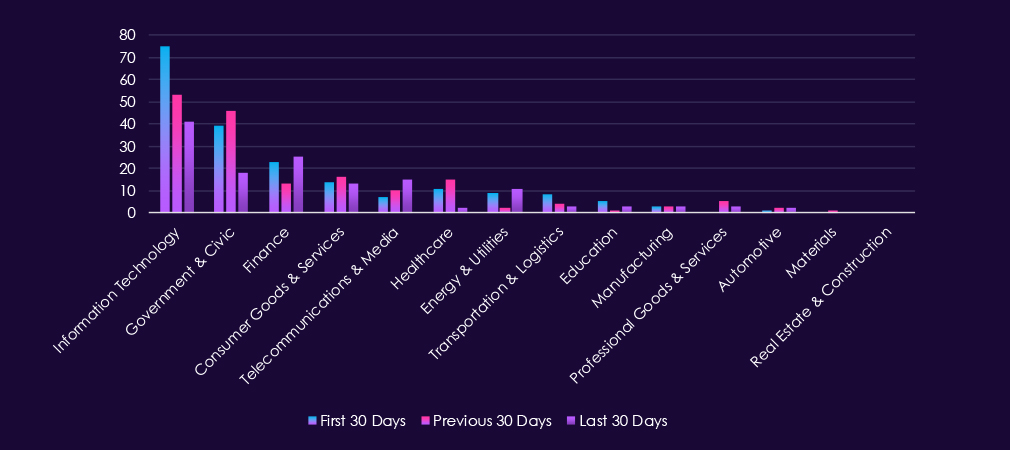
Victim distribution spans 31 countries, with the United States, Japan, the United Kingdom, India, and South Korea, all recording identical victim counts. Thailand and Germany both follow closely, with Germany’s relatively high ranking again notable for a European country and consistent with its significant construction and real estate sector.
Australia, Saudi Arabia, Taiwan, Switzerland, Italy, and Singapore round out the mid-frequency tier, reflecting broader targeting across developed economies. Southeast Asian countries, including Thailand, the Philippines, Malaysia, and Indonesia, appear regularly, consistent with the geographic focus of several China-linked actors observed during this period. The Middle Eastern presence is modest compared to other sectors, with Saudi Arabia and the UAE as the primary representatives.
Remaining victims are spread across continental Europe, Africa, and isolated cases in Central Asia, reflecting the broad but uneven global footprint typical of state-sponsored campaigns.
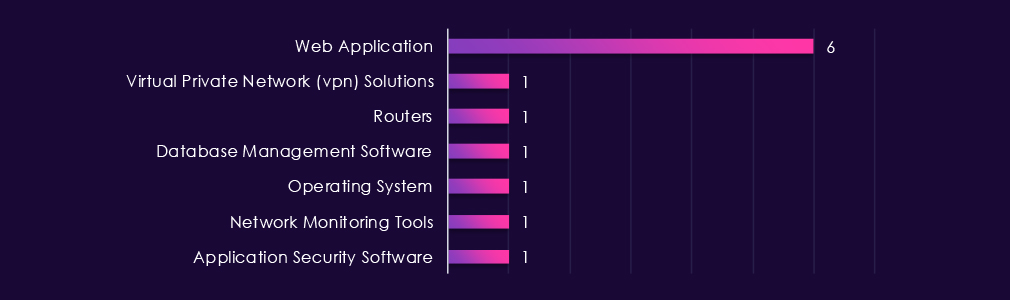
Web applications account for the large majority of observed attacks, dominating the technology distribution more heavily than in other sectors during this period. The remaining targeted technologies — VPN solutions, routers, database management software, operating systems, network monitoring tools, and application security software — each recorded single instances.
Despite their low individual frequency, the presence of VPNs, routers, and network monitoring tools points to infrastructure access and reconnaissance objectives, consistent with the state-sponsored actor profile observed during this period.

Over the past 90 days, the real estate & construction industry has been moderately impacted by advanced persistent threat (APT) campaigns.
7 out of 16 observed APT campaigns recorded victims in this industry. That is 44% presence in observed campaigns.
That is the same number of campaigns as the previous 90-day period, during which 7 out of 11 campaigns targeted this industry, however a decline in the overall share from the previous 64%.
Monthly Trends
Monthly trends show a sustained APT activity against real estate & construction over the months. From January, we have observed an alternating pattern between 1 and 2 campaigns per month. April so far jumped mildly to 3 campaigns.
Key Threat Actors
Campaigns show the strongest concentration of China-linked threat actors across all sectors this period, with MISSION2074 leading and Stone Panda, Hafnium, Lotus Blossom, APT27, Earth Estries, and Volt Typhoon providing additional representation. No Russia-linked actors are observed this period. Iran-linked OilRig and North Korea-associated Lazarus Group each appear in a single campaign, alongside financially motivated actors FIN11 and FIN7 at low frequency.
Geographical Impact
Victim distribution spans 31 countries, with the United States, Japan, the United Kingdom, India, and South Korea all recording identical victim counts at the top tier. Thailand and Germany follow closely, with Germany’s ranking consistent with its significant construction and real estate sector exposure. Saudi Arabia, Taiwan, and Singapore also record meaningful numbers. Remaining cases are spread across Southeast Asia, continental Europe, and isolated instances in Africa and Central Asia.
Targeted Technologies
Web applications dominate the technology distribution more heavily than in any other sector this period, with all remaining technologies recording single instances. VPN solutions, routers, and network monitoring tools appear alongside database management software and application security software, pointing to infrastructure access and reconnaissance objectives consistent with the state-sponsored actor profile observed during this period.
Over the past 90 days, DeCYFIR and DeTCT platforms tracked 777 cyber incidents reported publicly. We could identify the industry for 505 of these incidents (60.5%).
Real estate & construction was not explicitly mentioned in any of the observed incidents.
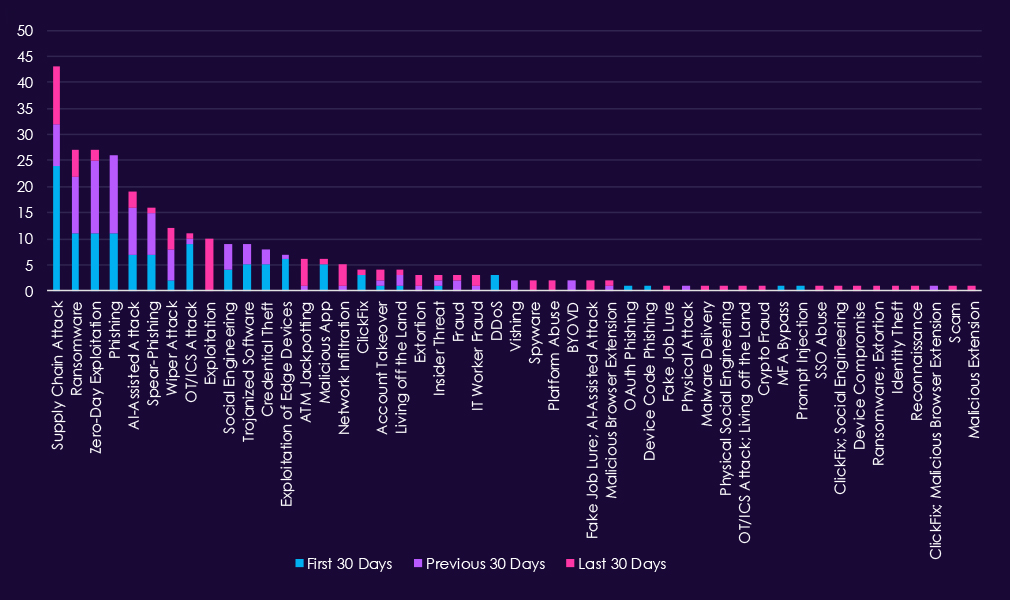
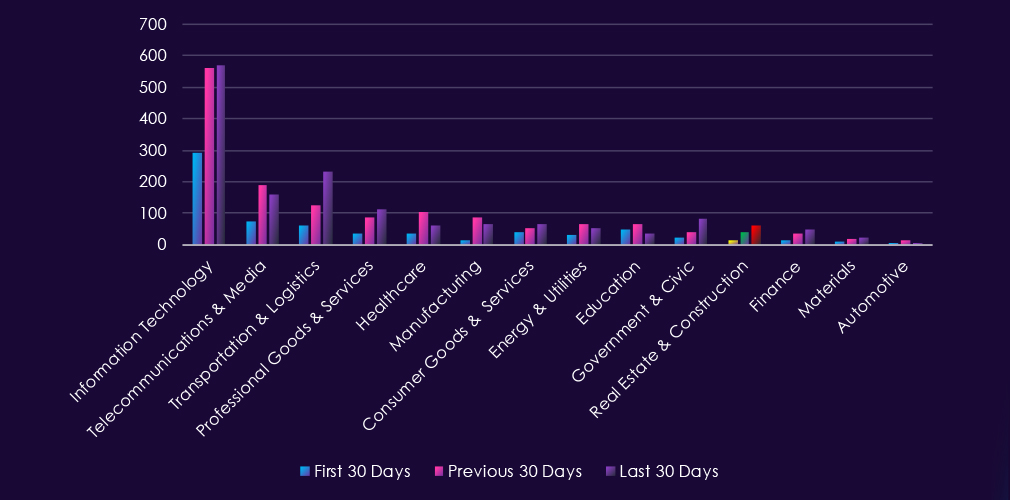
Since there were no relevant industry-linked incidents, we provide overall landscape data for all industry-linked attack techniques.
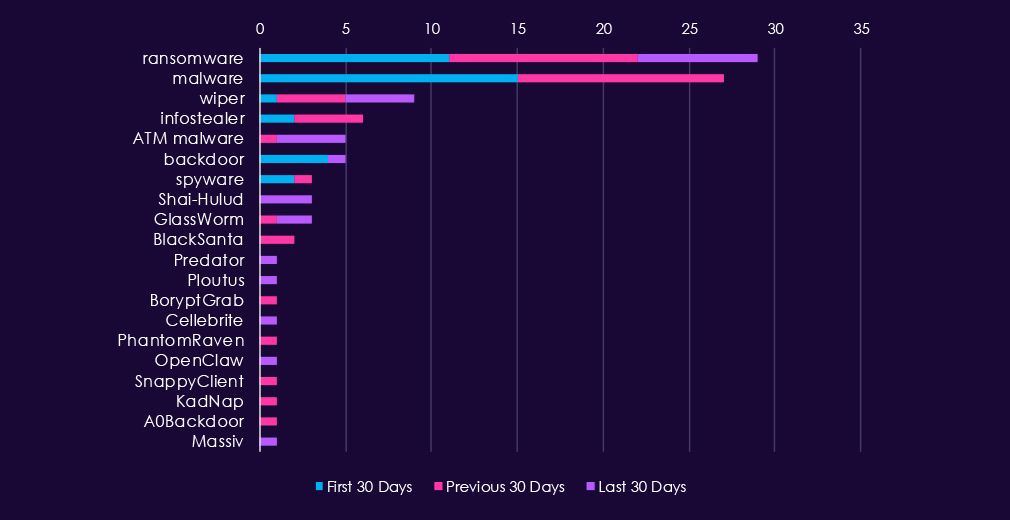
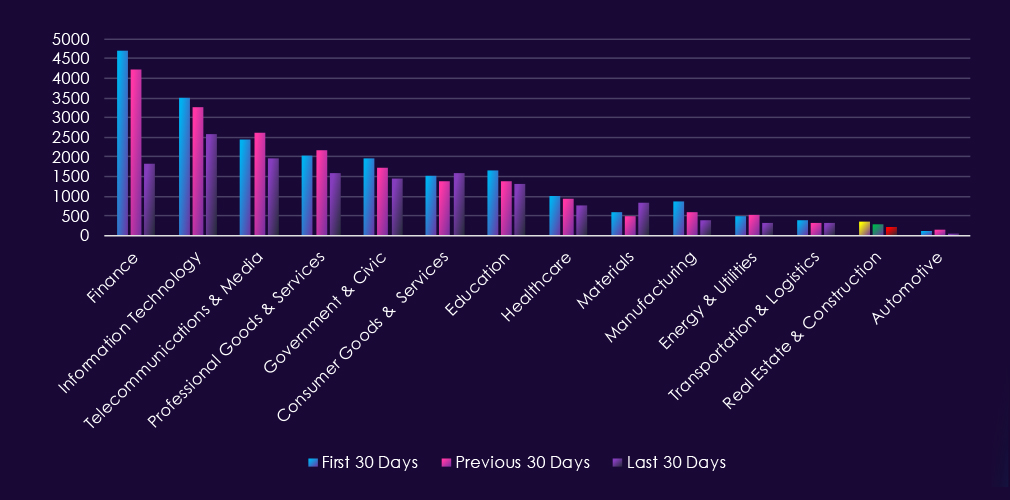
The above chart shows all overall industry-linked malware used in observed incidents.

Over the past 90 days, the real estate & construction industry has not been reported in any of the observed cyber incidents.
This is the only industry in the current period with no reported incidents. It is a curious observation. Review of processing and detection logic did not find any obvious issues, though the entire data set for this section of the report is a work in progress and has room for improvement.
As we can see in the APT campaigns and ransomware sections, the real estate & construction industry is definitely being targeted.
Our hypothesis here is under-reporting bias by common sources, which heavily focus on government and healthcare organizations, compromised or attacked technologies, and TTPs, rather than more industry-specific victims.
Over the past 90 days, CYFIRMA’s telemetry has identified 855 mentions of real estate & construction organizations out of a total of 56,935 industry-linked mentions. This is from a total of 300k+ posts across various underground and dark web channels and forums.
Real estate & construction organizations placed 13th out of 14 industries in the last 90 days, with a share of 1.50% of all detected industry-linked chatter.
Below is a breakdown by 30-day periods of all mentions.
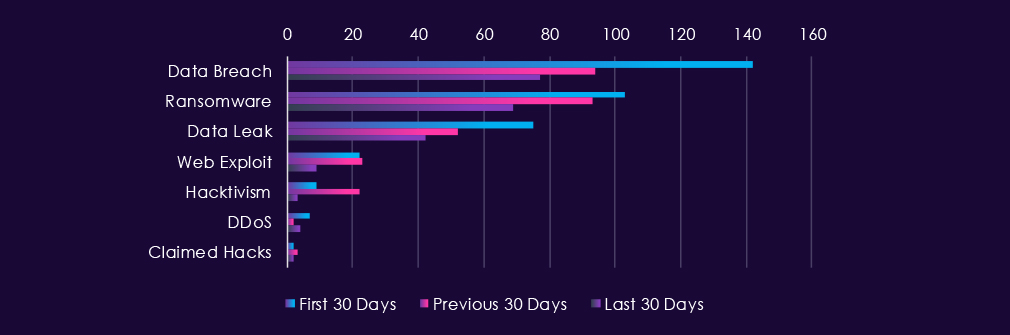
Underground & dark web chatter related to the real estate & construction sector over the last 90 days is dominated by data breach and ransomware discussions. Data breaches decline consistently from 142 to 77, while ransomware mentions decrease from 103 to 69 across all periods. Data leaks show a steady downward trend from 75 to 42. Web exploits decline sharply in the final period after modest mid-period activity. Hacktivism shows a significant mid-period elevation, followed by a notable decline to minimal levels. DDoS and claimed hacks remain at comparatively lower volumes with variable fluctuations.

In total, real estate & construction organizations comprise 1.50% of all detected industry underground and dark web chatter in the last 90 days, ranking 13th out of 14 industries.
Below are observed key trends across 90 days:
Data Breach
142 → 94 → 77. Consistent decline across all periods. Real estate and construction companies remain targeted due to project data, financial information, and client credentials, though the downward trend suggests fewer newly surfaced large-scale compromises in dark web discussions.
Ransomware
103 → 93 → 69. Steady decline across all periods. Ransomware targeting of the real estate and construction sector is decreasing, potentially reflecting lower perceived return on investment or shifts in attacker focus to other sectors.
Data Leak
75 → 52 → 42. Consistent decline across all periods. Indicates reduced circulation of real estate and construction-related data such as project details, client lists, and credentials in dark web postings.
Web Exploit
22 → 23 → 9. Mid-period stability followed by a sharp decline. Reflects variable probing of real estate platforms, construction management systems, and project portals with reduced activity recently.
Hacktivism
9 → 22 → 3. Significant mid-period spike followed by a notable decline in the final period. Suggests episodic ideological targeting of real estate and construction infrastructure rather than sustained campaigns.
DDoS
7 → 2 → 4. Variable activity with minimal emphasis across all periods. Indicates limited focus on disruption-based attacks in this sector.
Claimed Hacks
2 → 3 → 2. Minimal and stable across all periods. Suggests sporadic publicly claimed intrusions or access sales involving real estate and construction entities.
Over the past 90 days, CYFIRMA’s telemetry has identified 113 mentions of the real estate & construction industry out of a total of 3,740 industry mentions. This is from over 10k CVEs reported and updated in the last 90 days.
The real estate & construction industry ranked 11th out of 14 industries in the last 90 days, with a share of 3.02% of all detected industry-linked vulnerabilities.
Below is a breakdown by 30-day periods of all mentions.
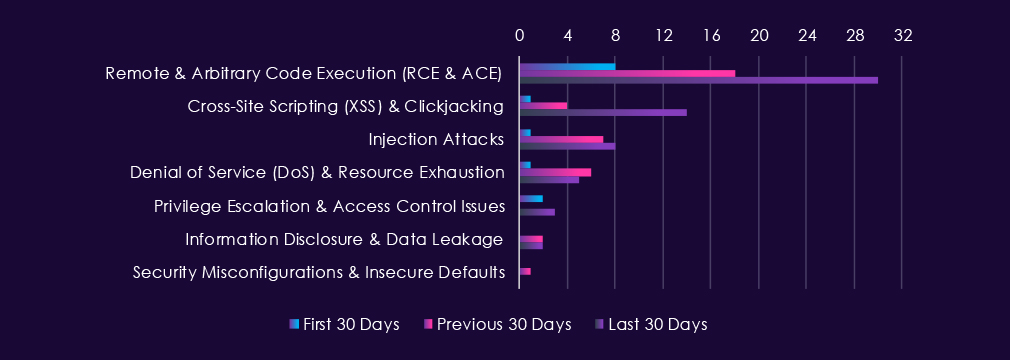
Reported CVEs in the real estate & construction sector over the last 90 days show escalating activity in code execution and injection vulnerabilities. Remote and arbitrary code execution vulnerabilities increase substantially, nearly quadrupling from initial levels to 30 in the final period. Cross-site scripting vulnerabilities show sharp increases, particularly in the final period. Injection attacks and denial of service vulnerabilities show moderate increases across periods. Privilege escalation and information disclosure remain at minimal levels, while security misconfigurations show negligible activity.

In total, real estate & construction organizations comprise of 3.02% of all detected industry-linked vulnerabilities in the last 90 days, ranking 11th out of 14 industries.
We assign moderate risk due to elevation rather than relative industry position.
Below are observed key trends across 90 days:
Remote & Arbitrary Code Execution (RCE & ACE)
8 → 18 → 30. Sharp and escalating increase across all periods, nearly quadrupling from initial levels. RCE and ACE vulnerabilities represent high-impact threats to real estate and construction systems due to direct system compromise potential and access to project management and client data.
Cross-Site Scripting (XSS) & Clickjacking
1 → 4 → 14. Sharp increase in the final period, more than tripling from mid-period levels. A growing volume of client-side vulnerabilities affecting real estate portals, property listing platforms, and construction management web applications.
Injection Attacks
1 → 7 → 8. Gradual increase across periods. Reflects the growing volume of vulnerabilities targeting application logic and backend systems in real estate and construction platforms.
Denial of Service (DoS) & Resource Exhaustion
1 → 6 → 5. Mid-period elevation followed by a modest decline, but remaining elevated above initial levels. Reflects variable DoS-enabling vulnerability disclosures.
Privilege Escalation & Access Control Issues
2 → 0 → 3. Variable activity with an increase in the final period. Reflects minimal but emerging disclosures of vulnerabilities enabling lateral movement and privilege advancement.
Information Disclosure & Data Leakage
0 → 2 → 2. Minimal and stable in mid and final periods. Represents negligible disclosure activity in this vulnerability category.
Security Misconfigurations & Insecure Defaults
0 → 1 → 0. Minimal and sporadic activity. Represents negligible disclosure in this vulnerability category.
In the past 90 days, CYFIRMA has identified 158 verified ransomware victims in the real estate & construction industry. This accounts for 7.05% of all 2,242 ransomware victims during the same period, placing this sector 6th out of 14 industries.
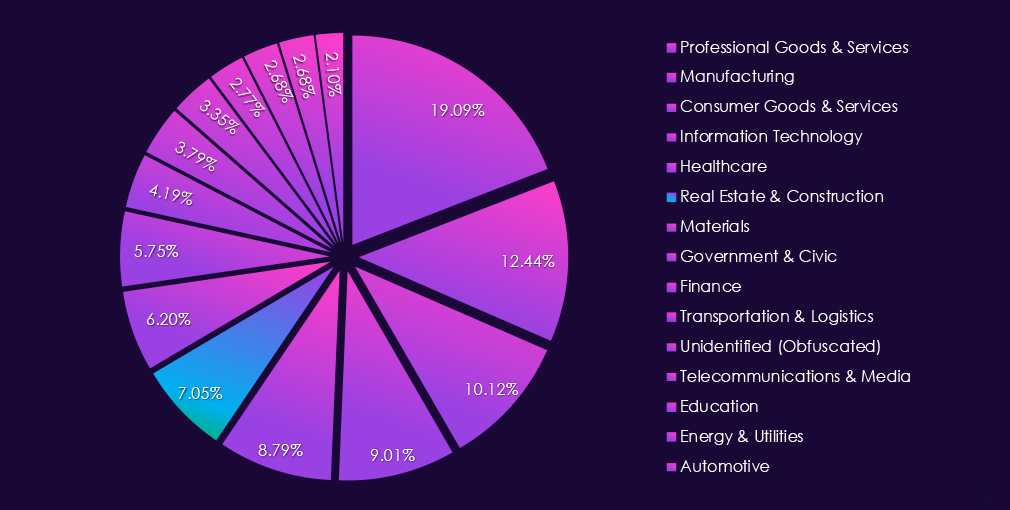
Furthermore, a quarterly comparison shows that the number of victims in the real estate & construction industry has declined. It went from 187 to 158 victims, a -15.5% increase. The overall interest, represented by share, however, grew from 5.76% to 5.95% of all victims.
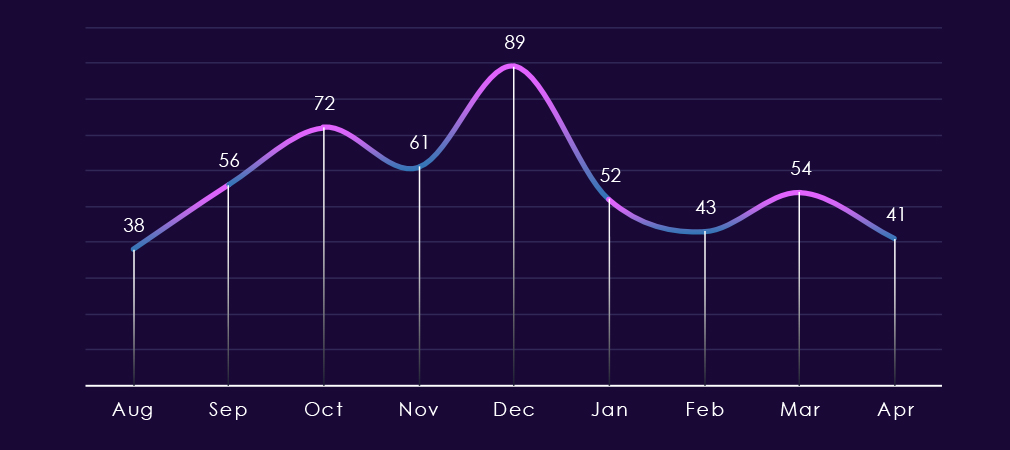
The monthly trendline shows us a sharp increase from the August low to October. November recorded a short-lived dip, followed by a spike to a 180-day high during December. The January to April period recorded sustained levels of activity between 40 and 55 victims per month.
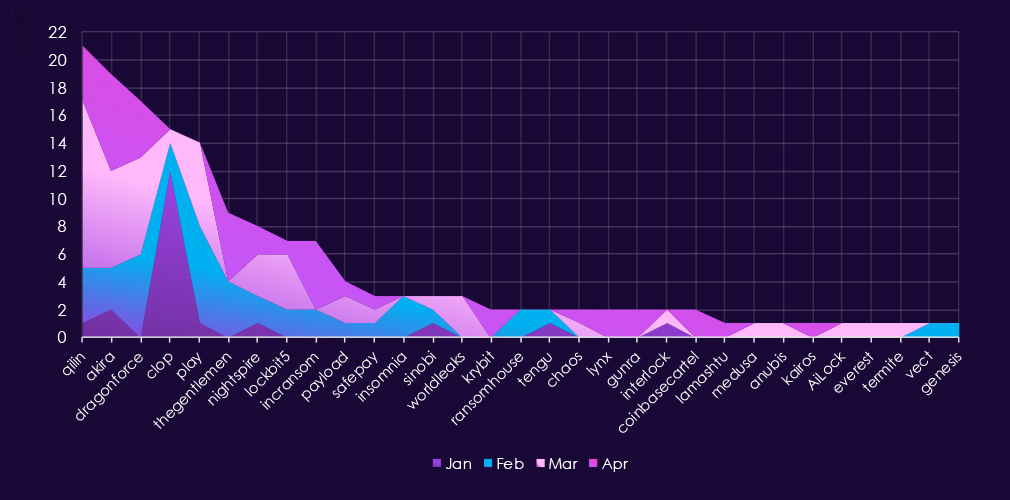
A breakdown of monthly activity per gang reveals which gangs were most active each month. For instance, the leading gang, Qilin, after low volumes in January and February, recorded a high number of victims in March.
Conversely, Cl0p, after major activity in January, recorded only a few more victims.
Lastly, gangs like Insomnia or Worldleaks contributed only during a single month.
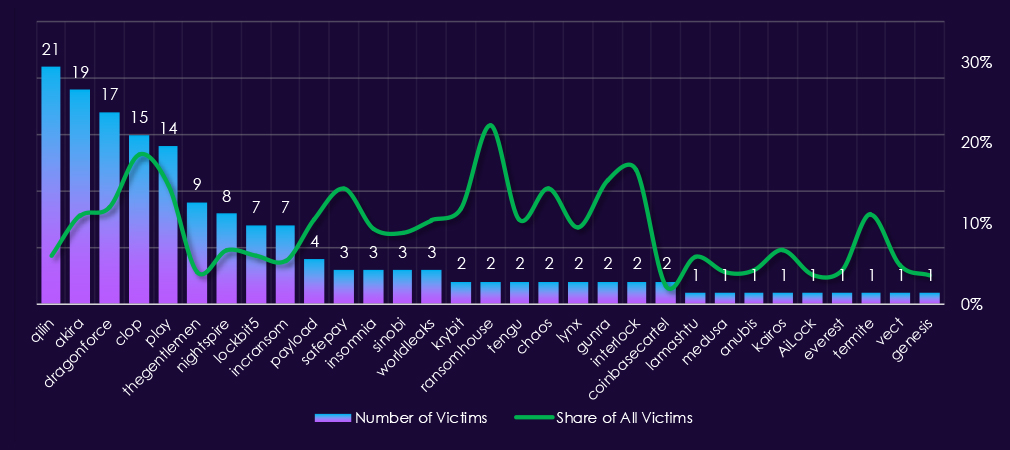
Out of the 70 gangs, 31 recorded victims in the real estate & construction industry in the last 90 days, representing a 44% participation.
Qilin had the highest number of victims, but only a 6.1% share out of all their 347 victims in this industry.
Some gangs show much more focus on this sector than others. Cl0p, Play, Dragonforce, Akira, and Payload have the highest shares (<10%) from gangs with more than 4 victims.
Among gangs with more than 3 victims, on average, 9.82%, 1 in 10 of their victims are from the real estate & construction industry.
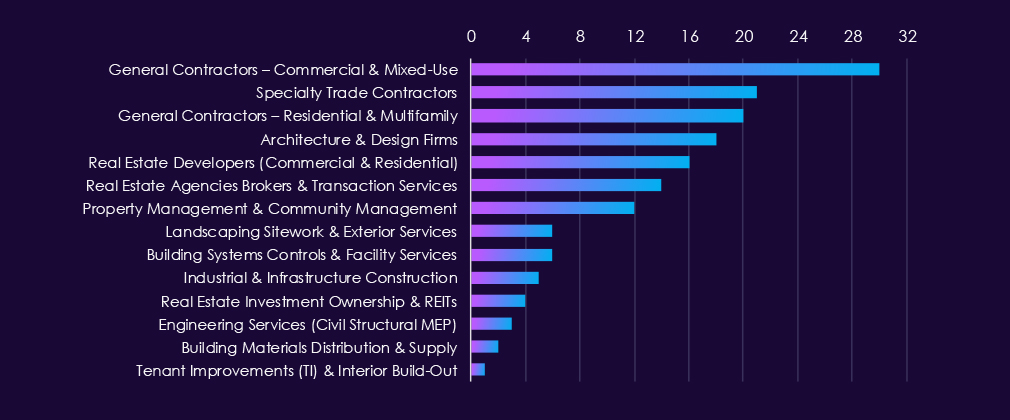
General Contractors, Specialty Trade Contractors, and Architecture & Design Firms led victim counts, reflecting the sector’s reliance on project data, contracts, and proprietary designs that create strong leverage for ransomware operators. Real Estate Developers, Agencies, and Property Management firms also recorded meaningful activity, consistent with the sensitive financial and personal data they hold.
Victim counts drop off sharply across the remaining subsectors, with industrial, engineering, and supply-side firms seeing only isolated incidents.
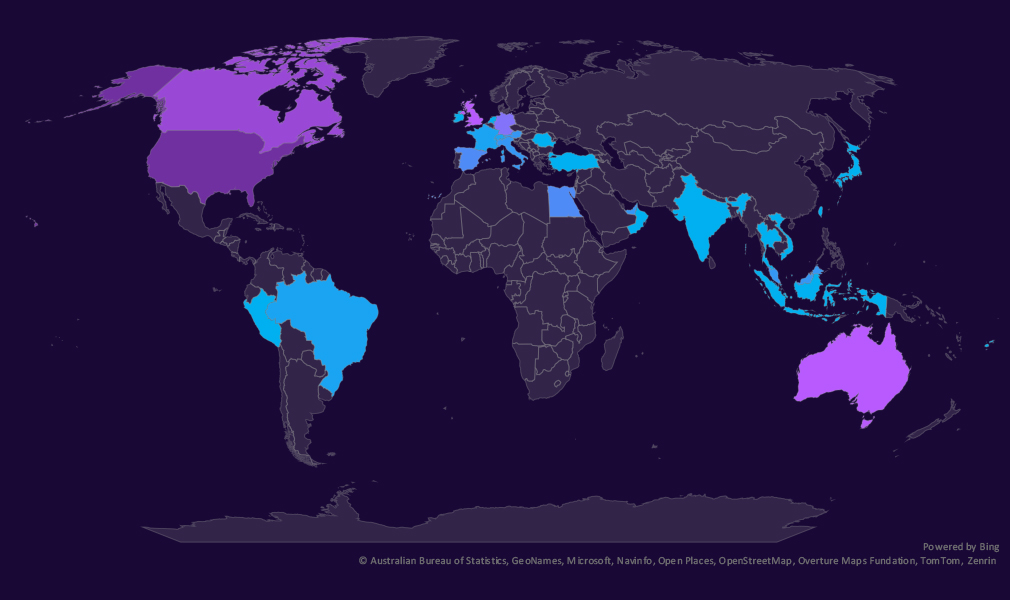
The geographic distribution heatmap underscores the widespread impact of ransomware, highlighting the countries where victims in this industry have been recorded.
Real estate & construction victimology shows sustained, though mildly lower interest. Germany and Australia were countries with the highest elevations.
The UAE, Saudi Arabia, Singapore, and Czechia, on the other had the largest declines.
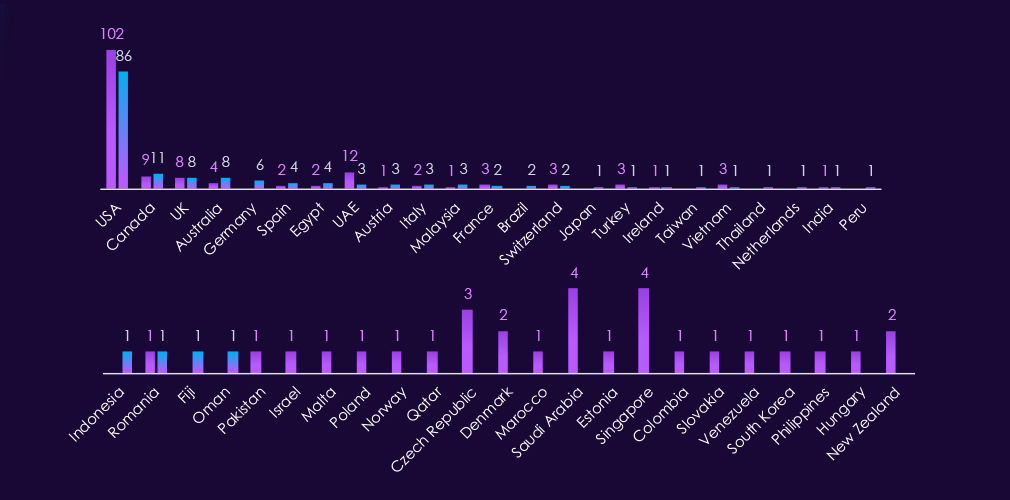
In the last 90 days, 27 countries recorded real estate & construction victims, nine fewer than 36 countries in the previous period.
Overall, more than half (54%) of all victims are based in the US. The remaining victims are relatively highly distributed.

Real estate & construction organizations ranked 6th out of 14 monitored industries, recording 158 victims in the last 90 days, a meaningful decline of 15.5% from the previous 1187.
Overall, the share mildly increased from 5.76% to 5.95% of all ransomware victims.
Combined contractor categories were the most targeted, followed by architecture & design firms, real estate developers, and brokers.
Monthly Activity Trends
The monthly trendline shows us a sharp increase from the August low to October. November recorded another short-lived dip, followed by a spike to 89 victims during December. January to April stabilized between 40 to 55 victims per month.
Ransomware Gangs
A total of 31 out of 70 active ransomware groups targeted this sector in the past 90 days. That is a 44% participation.
Qilin: Continuously the most active gang with 347 victims across industries in the last 90 days. 21 were from this sector (6.1%).
Clop, Play, Dragonforce, Akira, Payload: Recorded the highest shares of victims among gangs with a higher number of victims, suggesting a focus on this industry.
The average share among groups with more than 3 victims was 9.82%. That is 1 in 10 of their victims was a real estate & construction company.
Geographic Distribution
The geographic distribution of ransomware victims is relatively high, and spread across 27 countries, down from 36 in the previous period.
The USA recorded 54% of all victims.
Germany and Australia recorded the highest elevations.
The UAE, Saudi Arabia, Singapore, and Czechia on the other hand, the largest declines.
For a comprehensive, up-to-date global ransomware tracking report, please refer to our new monthly “Tracking Ransomware” series here.
APT Campaigns (Moderate): Real estate & construction recorded the strongest concentration of China-linked threat actors across all sectors this period, with MISSION2074 leading and six additional Chinese groups represented. No Russia-linked actors appear, a notable absence. Activity has been sustained rather than declining, with April showing a mild uptick to three campaigns. Web applications dominate, targeting more heavily than in any other sector, with VPN and router presence pointing to infrastructure access and reconnaissance as primary objectives.
Reported Cyber Incidents (Low): Real estate & construction is the only industry in the current period with no reported incidents. This is assessed as likely under-reporting bias from common sources, which focus heavily on government, healthcare, and technology sectors. APT and ransomware data confirm the industry is actively targeted, making the absence of incident reports a data gap rather than a signal of low risk.
Underground & Dark Web Chatter (Low): The sector ranked 13th out of 14 industries. Across all categories, breach, leak, ransomware, and web exploit chatter declined consistently through the period. The one notable exception was a sharp mid-period spike in hacktivist mentions that fell away sharply in the final period, suggesting an episodic rather than sustained campaign. The overall low volume and declining trend likely reflect the same under-reporting dynamic observed in the incidents section.
Vulnerabilities (Moderate): Despite ranking 11th in disclosure volume, the risk indicator is set to moderate based on trajectory rather than relative position. RCE vulnerabilities nearly quadrupled across the period. XSS vulnerabilities more than tripled in the final period alone. Injection attacks also grew steadily. The escalation across multiple vulnerability classes in a sector with limited security visibility is the primary concern.
Ransomware (Moderate): 158 victims, down 15.5% from the prior period, though the overall share increased marginally. Contractors are the most targeted sub-sector, followed by architecture and design firms. Geographic spread narrowed from 36 to 27 countries, while the US share rose to 54%. Germany and Australia recorded the largest increases. Cl0p, Play, Dragonforce, Akira, and Payload all show notable sector concentration among active gangs.