
CONSUMER GOODS SERVICES Q1 I 2026 : INDUSTRY REPORT
The CYFIRMA Industry Report delivers original cybersecurity insights and telemetry-driven statistics of global industries, covering one sector each week for a quarter. This report focuses on the consumer goods & services industry, presenting key trends and statistics in an engaging infographic format.
Welcome to the CYFIRMA infographic industry report, where we delve into the external threat landscape of the consumer goods & services industry over the past three months. This report provides valuable insights and data-driven statistics, delivering a concise analysis of attack campaigns, phishing telemetry, and ransomware incidents targeting the retail goods & services industry.
We aim to present an industry-specific overview in a convenient, engaging, and informative format. Leveraging our cutting-edge platform telemetry and the expertise of our analysts, we bring you actionable intelligence to stay ahead in the cybersecurity landscape.
CYFIRMA delivers pre-emptive cybersecurity, cyber threat intelligence, and external threat landscape management through its platforms, DeCYFIR and DeTCT. These platforms have been purpose-built over many years to continuously collect, correlate, and analyse large volumes of external threat data, combining proprietary intelligence automation with deep, hands-on cyber threat research.
For the purpose of this report, the analysis draws on intelligence generated from CYFIRMA’s platforms. The data referenced has been processed through automated correlation and enrichment mechanisms, informed and validated by human-led research and investigative expertise, and sourced from both structured and unstructured external intelligence channels.
While this report contains data collected and processed by our in-house AI and ML, all charts, statistics, and analyses are done by human CYFIRMA CTI analysts to ensure the highest quality and provide accurate insights.
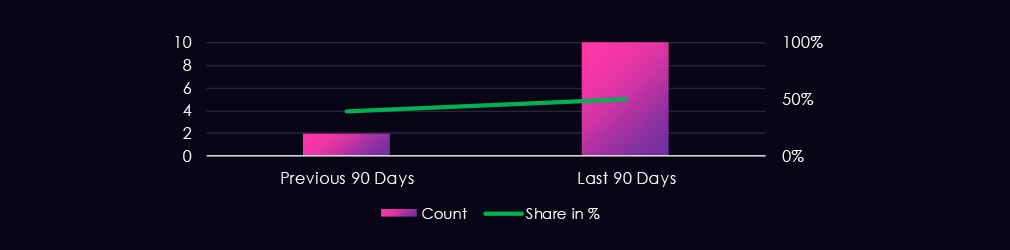
Consumer goods & services industry featured in 10 out of the 20 observed campaigns, which is a presence in 50% of all campaigns, an increase from previous period, where retail organizations were present in 2 out of 5 campaigns, also an increase from a 40% presence.

APT activity in the retail industry has been sustained for months. January and February both observed four campaigns. Activity declined slightly during March to two campaigns. April so far has not seen a campaign.
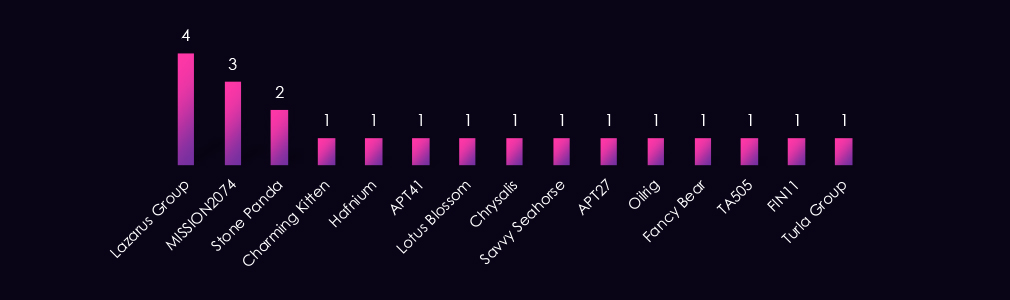
Observed APT campaigns show a broader mix of state-sponsored actors compared to other sectors this period. North Korean Lazarus Group leads, reflecting the group’s known interest in financially valuable consumer-facing targets. China-linked actors remain well represented, with MISSION2074 and Stone Panda following closely, and additionally Hafnium, APT41, Lotus Blossom, and APT27.
Iran-linked actors appear through both OilRig and Charming Kitten, while Russia-linked Fancy Bear and Turla Group appear too. Financially motivated actors TA505 and FIN11 round out the observed threat actor profile, consistent with the consumer sector’s exposure to opportunistic as well as targeted campaigns.
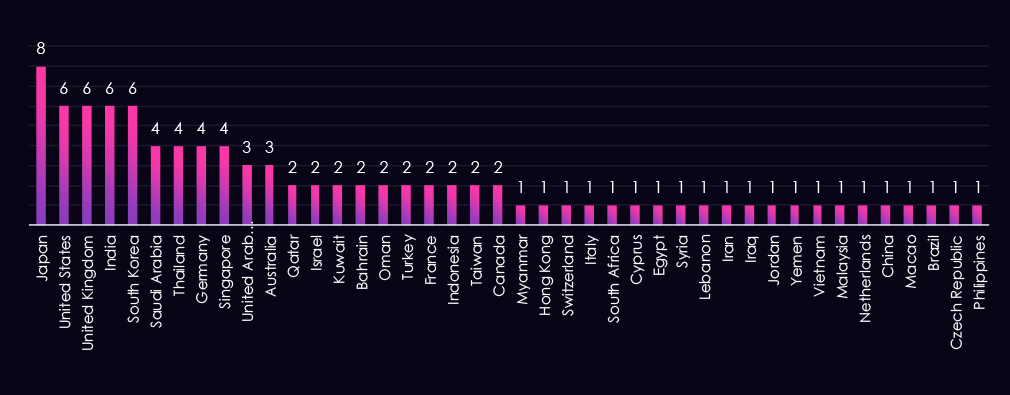
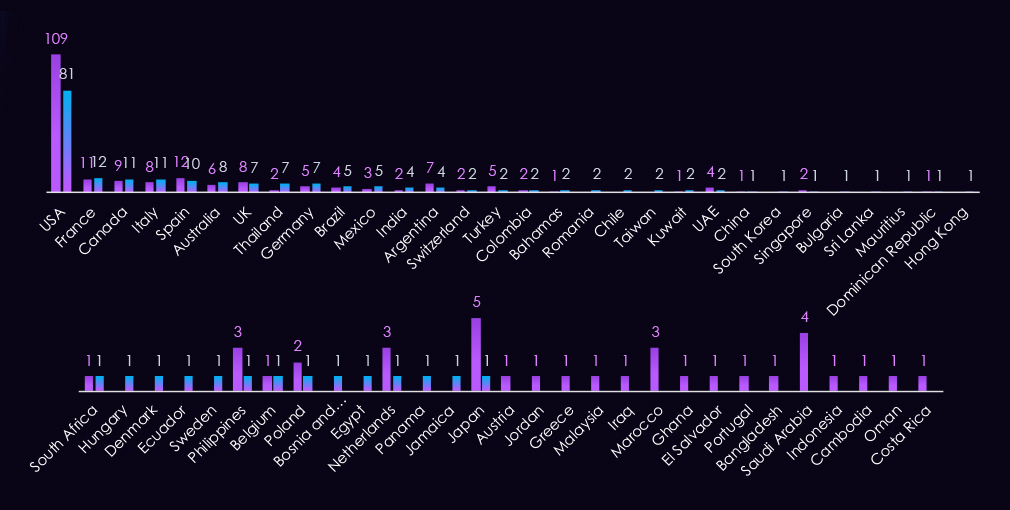
Victim distribution spans 42 countries, notably broader than other sectors this period, reflecting the consumer sector’s large attack surface and the financial motivation of several observed threat actors.
Japan leads in victim count, with the United States, United Kingdom, India, and South Korea close behind. Germany, Saudi Arabia, Thailand, and Singapore also record meaningful numbers. The Middle East shows stronger representation than in other sectors, with Saudi Arabia, UAE, Qatar, Kuwait, Bahrain, and Oman all recording victims, consistent with Iran-linked and financially motivated actor activity.
Remaining victims are distributed across Southeast Asia, continental Europe, Africa, and Latin America, pointing to a mix of targeted state-sponsored campaigns and broader opportunistic activity.
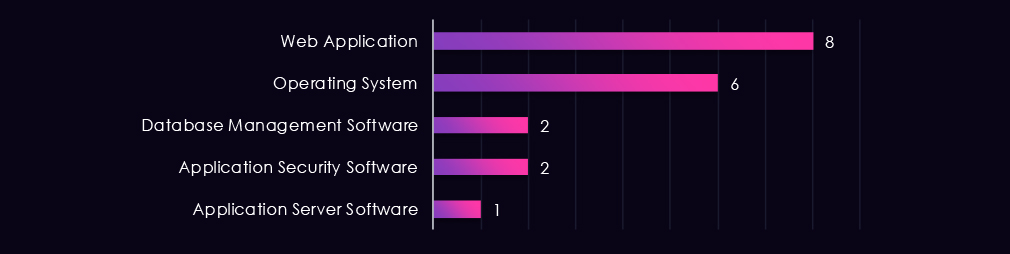
Web applications and operating systems account for the large majority of observed attacks, consistent with patterns seen across other sectors this period. Database management and application security software each recorded multiple instances, suggesting data access and attempts to undermine defensive tooling as secondary objectives.
Application server software rounds out the targeted technology profile, appearing in a single observed campaign. The relatively narrow technology distribution reflects a more focused intrusion pattern compared to other sectors, despite the broader geographic spread observed during this period.
Risk Level Indicator: Moderate

Over the past 90 days, the consumer goods & services industry has been moderately impacted by advanced persistent threat (APT) campaigns.
10 out of 20 observed APT campaigns recorded victims in this industry. That is 50% presence in observed campaigns.
That is an increase from the previous 90-day period, during which 2 out of 5 campaigns targeted this industry, and in the overall share from the previous 40%.
Monthly Trends
APT activity has been sustained for months. January and February both observed four campaigns. Activity declined slightly during March to two campaigns. April so far has not seen a campaign.
Key Threat Actors
North Korea-associated Lazarus Group leads with the highest number of observed campaigns, marking a notable shift from other sectors where China-linked actors dominate. MISSION2074 and Stone Panda follow, with additional China-linked representation from Hafnium, APT41, Lotus Blossom, and APT27. Iran-linked OilRig and Charming Kitten both appear, alongside Russia-linked Fancy Bear and Turla Group. Financially motivated actors TA505 and FIN11 are present, consistent with the consumer sector’s exposure to opportunistic campaigns.
Geographical Impact
Victim distribution spans 42 countries, broader than other sectors this period. Japan leads in victim count, with the United States, United Kingdom, India, and South Korea close behind. The Middle East shows stronger representation than in other sectors, with Saudi Arabia, UAE, Qatar, Kuwait, Bahrain, and Oman all recording victims. Remaining cases are spread across Southeast Asia, continental Europe, Africa, and Latin America.
Targeted Technologies
Web applications and operating systems account for the large majority of observed attacks. Database management and application security software each feature across multiple campaigns, suggesting data access and attempts to undermine defensive tooling as secondary objectives. The technology distribution is narrower than in other sectors, despite the broader geographic footprint observed during this period.
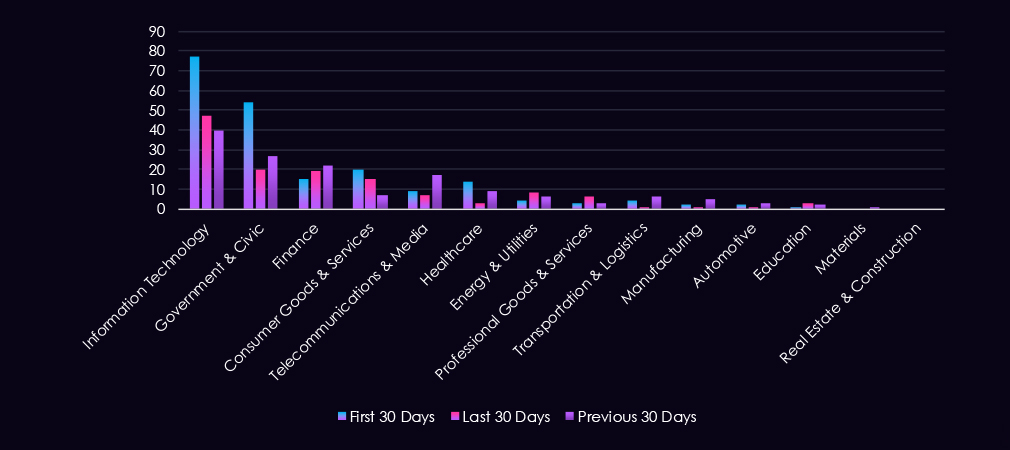
Over the past 90 days, DeCYFIR and DeTCT platforms tracked 800 cyber incidents reported publicly. We could identify the industry for 484 of these incidents (60.5%).
Consumer goods & services were detected in 42 incidents, which equals 5.25% of the incidents where we knew the industry, ranking 4th out of 14 industries.
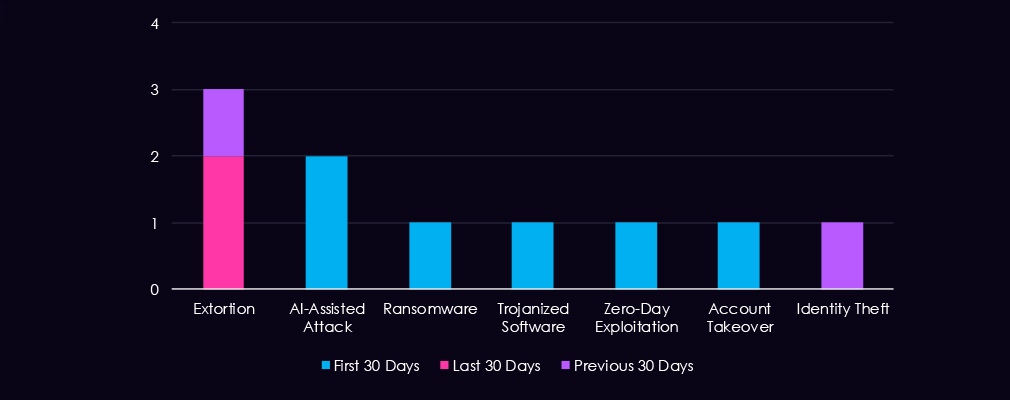
Extortion was the most frequently observed technique (3 incidents), concentrated in the previous and last 30-day periods. AI-assisted attacks appeared twice in the first 30 days, representing early experimentation with this emerging attack method.
Ransomware, trojanized software, zero-day exploitation, account takeover, and identity theft each appeared once across the reporting period.
The diversity of techniques and concentration of extortion activity suggest opportunistic targeting rather than coordinated campaigns focused on specific attack methods.
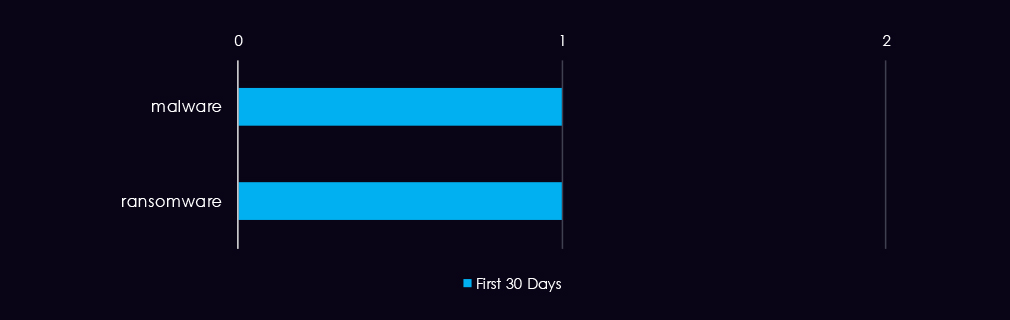
Malware identification was extremely limited across Consumer Goods & Services incidents. It is subject to intense development and improvement
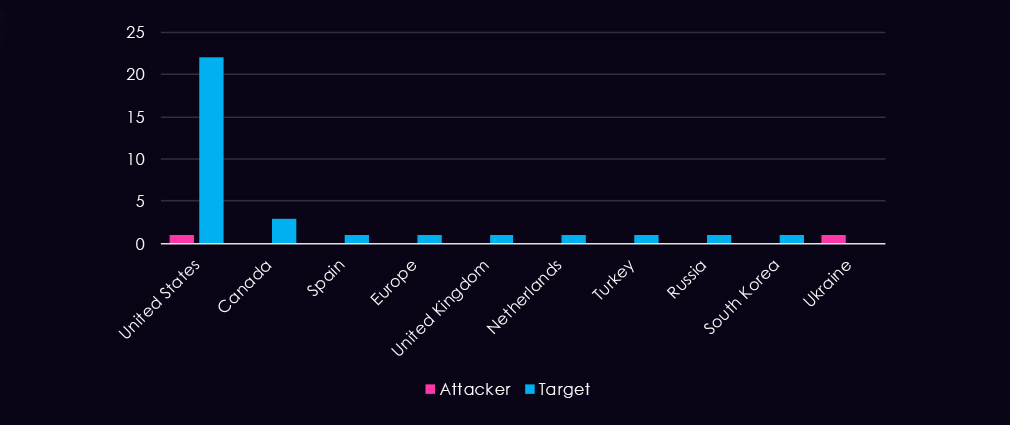
The United States was overwhelmingly targeted (22 incidents), followed by Canada (3 incidents) and isolated cases in Spain, the United Kingdom, the Netherlands, Turkey, Russia, and South Korea.
Attacking country was rarely identified; the United States and Ukraine each appeared once.
The concentration of victims in North America, particularly the United States, suggests geographically focused targeting or increased public reporting of incidents in these regions.
Risk Level Indicator: Moderate

Over the past 90 days, the consumer goods & services industry has been moderately impacted by cyber incidents.
42 out of 484 industry-linked cyber incident reports were against retail organizations. That is 5.25% presence and ranking 4th out of 14 industries.
We acknowledge this is low, as this data set is in development and will improve over time.
Monthly Trends
Activity was relatively stable across the first 60 days, with 20 incidents in the first 30 days, declining slightly to 15 in the previous 30 days, then falling to 7 in the last 30 days.
Attack Techniques
Extortion was the dominant technique (3 incidents), concentrated in the previous and last 30-day periods. AI-assisted attacks appeared twice in the first 30 days. Ransomware, trojanized software, zero-day exploitation, account takeover, and identity theft each appeared once, suggesting opportunistic targeting across diverse methods.
Malware/Tools used
Malware identification was extremely limited, detecting only one malware and ransomware respectively in the first 30 days.
Geographical Impact
The United States accounted for 22 of 28 victim identifications, with Canada (3 incidents) and isolated cases across Europe, the Middle East, and Asia. Attacking country was rarely identified, with only the United States and Ukraine appearing once each.
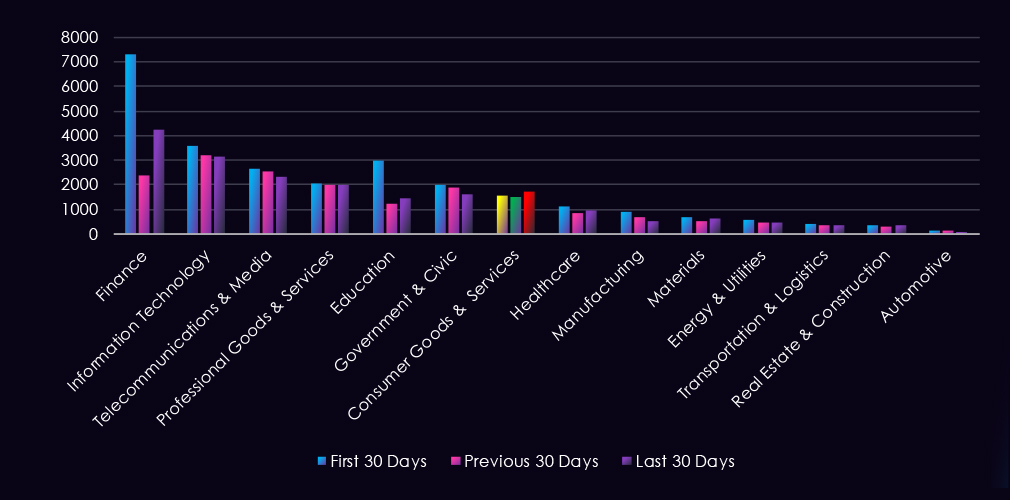
Over the past 90 days, CYFIRMA’s telemetry has identified 4,753 mentions of the consumer goods & services industry out of a total of 63,998 industry-linked mentions. This is from a total of 300k+ posts across various underground and dark web channels and forums.
Consumer goods & services industry placed 7th out of 14 industries in the last 90 days, with a share of 9.28% of all detected industry-linked chatter.
Below is a breakdown by 30 day-period of all mentions.
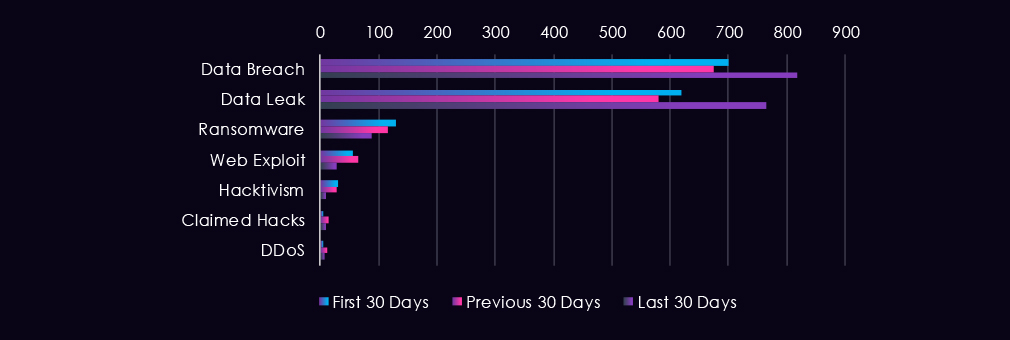
Underground & dark web chatter related to the consumer goods & services sector over the last 90 days is dominated by data breach and data leak discussions, which remain consistently elevated and show an upward trend in the final period. Data breaches rose from 699 to 817, and data leaks from 619 to 764. Ransomware mentions decline substantially across all periods, from 130 to 89. Web exploits show a sharp decline in the final period after moderate activity mid-period. Hacktivism activity drops notably in the most recent period, while claimed hacks and DDoS remain at comparatively lower volumes with variable fluctuation.
Risk Level Indicator: Moderate

In total, the consumer goods & services industry comprise 7.43% of all detected industry underground and dark web chatter in the last 90 days. And ranking 7th out of 14 industries.
Below are observed key trends across 90 days:
Data Breach
699 → 674 → 817. An initial dip followed by a substantial rise in the final period. Consumer goods & services companies remain major targets due to customer payment data, personal information, and loyalty program credentials, with the sharp upward trend indicating intensifying focus on newly surfaced compromises.
Data Leak
619 → 579 → 764. Initial decline followed by significant recovery. Indicates sustained circulation of consumer-related data such as customer lists, payment information, and personal details, with leak postings notably increasing in the final period.
Ransomware
130 → 115 → 89. Consistent decline across all periods. Ransomware targeting of the consumer goods & services sector is decreasing, potentially reflecting lower perceived return on investment compared to other sectors or shifts in attacker priorities.
Web Exploit
55 → 64 → 27. Mid-period activity followed by a sharp decline. Reflects variable probing of consumer-facing platforms, e-commerce systems, and customer portals with reduced emphasis recently.
Claimed Hacks
5 → 13 → 9. Modest mid-period spike followed by a decline. Indicates sporadic publicly claimed intrusions or access sales involving consumer goods & services entities.
Hacktivism
30 → 29 → 9. Consistent decline across periods with a notable drop in the final period. Suggests reduced ideological targeting of consumer goods & services infrastructure.
DDoS
6 → 12 → 8. Mid-period elevation followed by a decline. Indicates variable and limited emphasis on disruption-based attacks in this sector.
Over the past 90 days, CYFIRMA’s telemetry has identified 158 mentions of the consumer goods & services industry out of a total of 3,735 industry mentions. This is from over 10k CVEs reported and updated in the last 90 days.
Consumer goods & services industry ranked 8th out of 14 industries in last 90 days with a share of 4.23% of all detected industry-linked vulnerabilities.
Below is a breakdown by 30-day periods of all mentions.
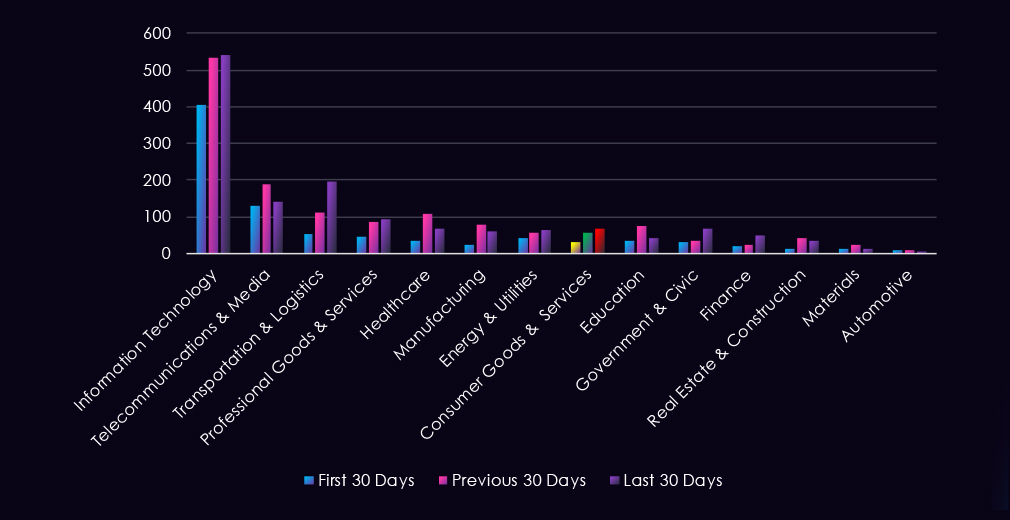
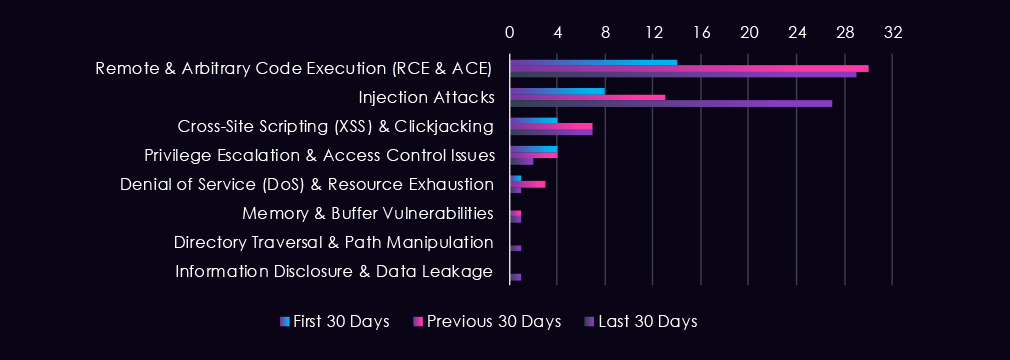
Reported CVEs over the last 90 days show elevated activity in code execution and injection vulnerabilities. Remote and arbitrary code execution vulnerabilities spike mid-period and remain consistently high, while injection attacks show a sharp increase in the final period, more than tripling from initial levels. Cross-site scripting vulnerabilities remain stable at modest levels. Privilege escalation and denial of service vulnerabilities show minimal activity with variable fluctuation, while directory traversal and information disclosure remain at negligible levels.
Risk Level Indicator: Moderate

In total, info consumer goods & services industry comprise of 4.23% of all detected industry-linked vulnerabilities in the last 90 days. And ranking 8th out of 14 industries.
Below are observed key trends across 90 days:
Remote & Arbitrary Code Execution (RCE & ACE)
14 → 30 → 29. Mid-period spike followed by stable elevation. RCE and ACE vulnerabilities represent high-impact threats to consumer goods & services systems due to direct system compromise potential and access to customer-facing infrastructure.
Injection Attacks
8 → 13 → 27. Sharp increase in the final period, more than tripling from initial levels. Growing volume of vulnerabilities targeting application logic and backend systems in consumer platforms and e-commerce environments.
Cross-Site Scripting (XSS) & Clickjacking
4 → 7 → 7. Modest elevation mid-period followed by stabilization. Reflects consistent client-side vulnerability disclosures affecting consumer-facing web applications.
Privilege Escalation & Access Control Issues
4 → 4 → 2. Decline in the final period. Reflects minimal disclosures of vulnerabilities enabling lateral movement and privilege advancement in this sector.
Denial of Service (DoS) & Resource Exhaustion
1 → 3 → 1. Minimal and variable activity across periods. Reflects low disclosure volume of DoS-enabling vulnerabilities.
Memory & Buffer Vulnerabilities
0 → 1 → 1. Minimal and sporadic activity. Represents negligible disclosure in this vulnerability category.
Directory Traversal & Path Manipulation
0 → 0 → 1. Single disclosure in the final period. Represents minimal activity.
Information Disclosure & Data Leakage
0 → 0 → 1. Single disclosure in the final period. Represents minimal activity.
In the past 90 days, CYFIRMA has identified 214 verified ransomware victims in the consumer goods & services industry. This accounts for 9.96% of all 2,149 ransomware victims during the same period, placing the retail sector 3rd out of 14 industries.
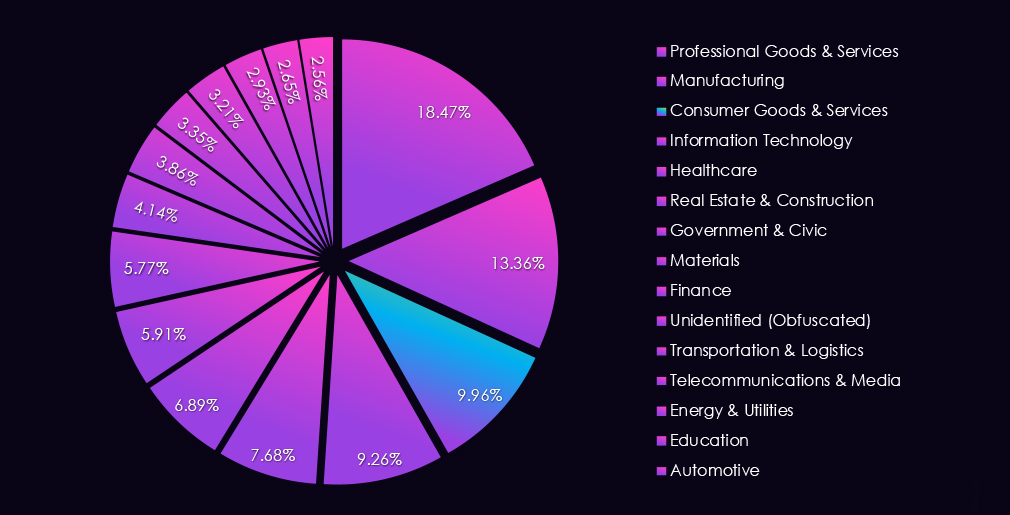
Furthermore, a quarterly comparison shows that the number of victims in the consumer goods & services industry has declined. It went from 242 to 214 victims, a -11.6% decrease. The overall interest, represented by share, also slowed from 11.45% to 9.96% of all victims.
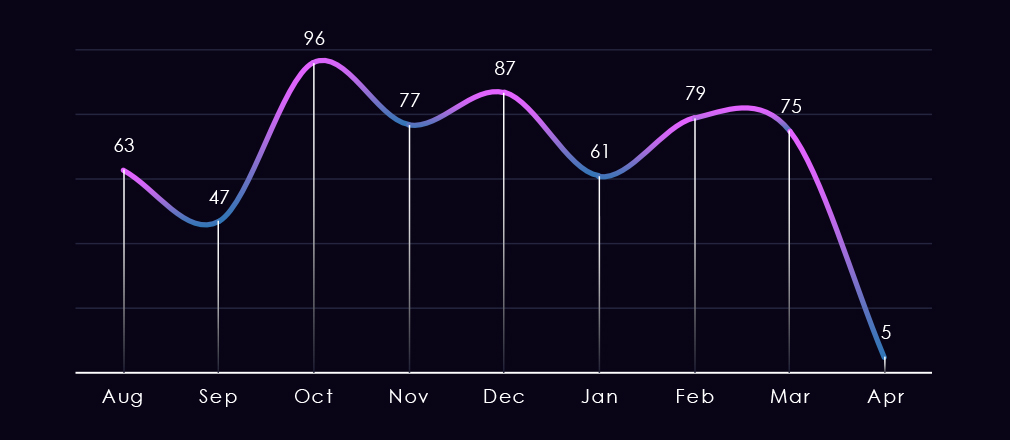
The monthly trendline shows us a dip in September, followed by 180-days high in October, and since then, numbers have oscillated around a mildly downward trendline. Just the first few days of April have recorded 5 victims.
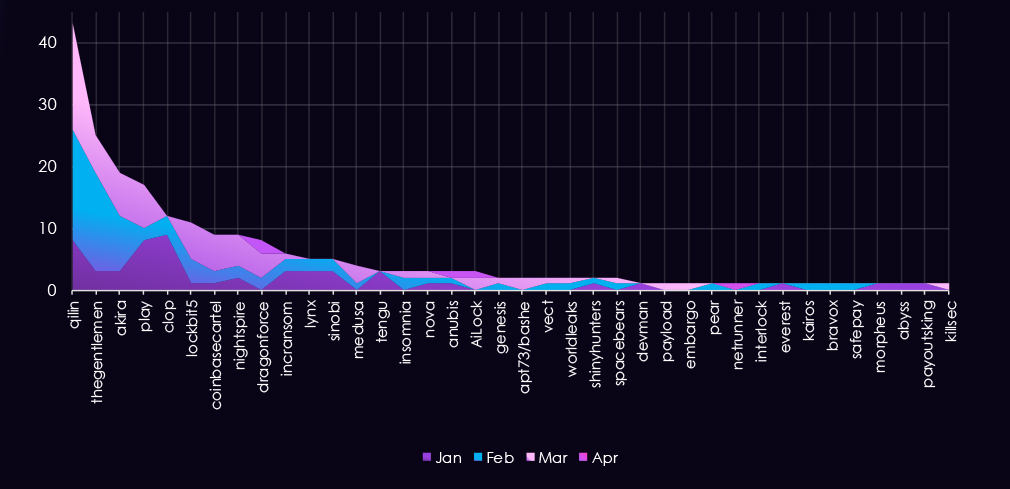
A breakdown of monthly activity per gang reveals which gangs were most active each month. For instance, the top 4 leading gangs were active each month.
On the other hand, the fifth most active gang, Cl0p, did not record any new victims since February.
Lastly, LockBit5 and mid-size gangs like Coinbasecartel and Nightspire contributed to the numbers in March after Cl0p stopped posting new victims.
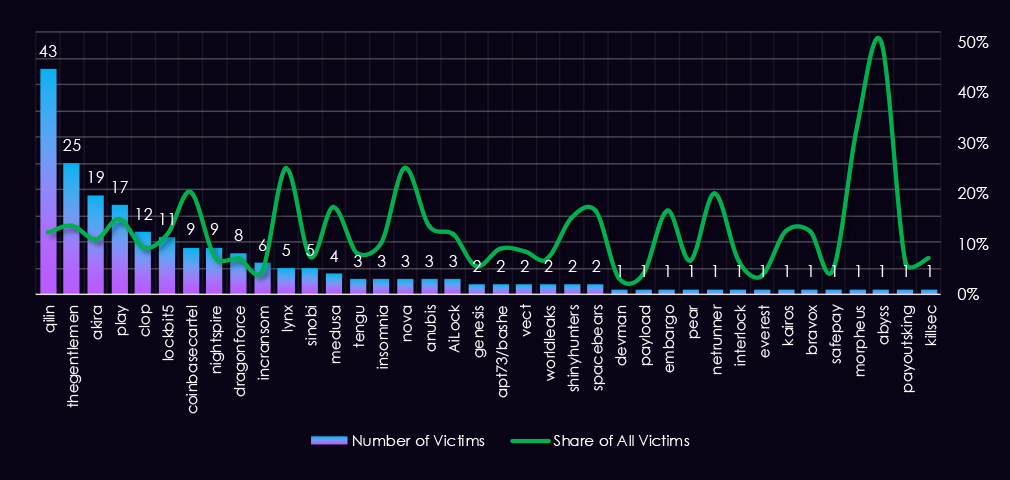
Out of the 68 gangs, 38 recorded victims in the consumer goods & services industry in the last 90 days, representing a 56% participation.
Qilin had the highest number of victims and a 12.5% share out of all their 345 victims in this industry.
Since the retail industry is made up of countless small and medium businesses, which are the most common targets of ransomware, we can see high shares of many gangs from this industry. Among gangs with more than 3 victims, on average, 13%, 1 in less than 8 of their victims are retail businesses.
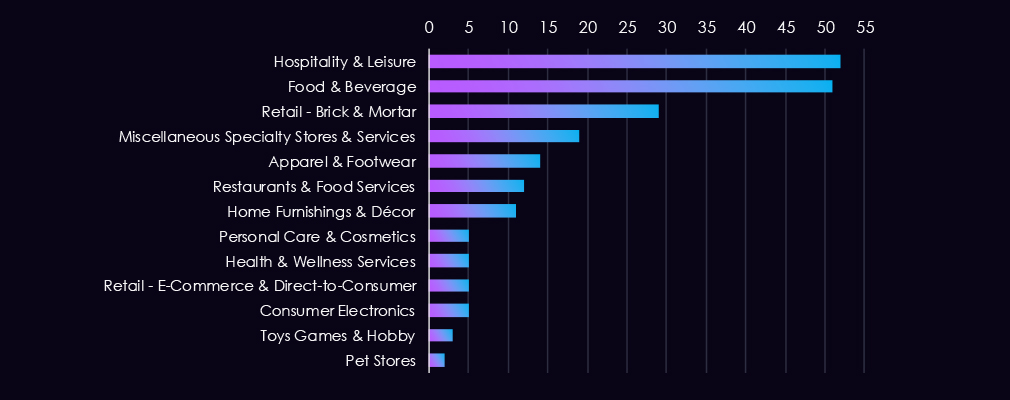
Hospitality & Leisure and Food & Beverage led the sector with near-identical victim counts, pointing to sustained threat actor interest in consumer-facing businesses that handle high volumes of payment and personal data. Retail – Brick & Mortar also recorded notable activity, rounding out a clear top tier.
The remaining subsectors were significantly quieter. Low counts across the tail likely reflect a combination of limited targeting and possibly public reporting rather than an absence of exposure.
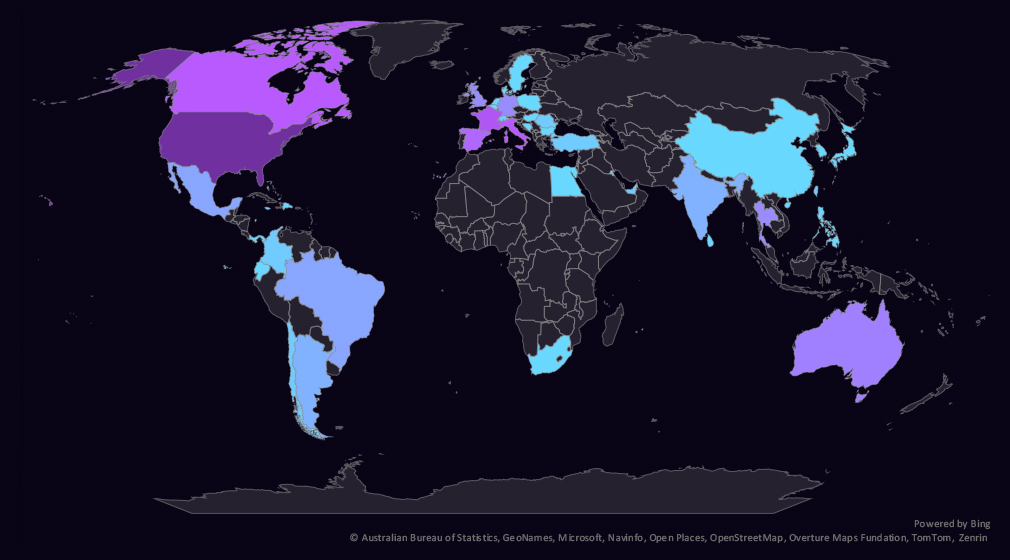
The geographic distribution heatmap underscores the widespread impact of ransomware, highlighting the countries where victims in this industry have been recorded.
Consumer goods & services victimology shows a decline of interest in the USA. Italy, Thailand and India were among the countries with the highest elevations.
Turkey, Japan, Saudi Arabia, and Moroccoon the other hand, had the largest declines.
In the last 90 days, 44 countries recorded retail industry victims, just one more than 43 countries in the previous period.
Overall, more than a third (38%) of all victims are based in the US. The remaining victims are relatively highly distributed.
Risk Level Indicator: High

Consumer goods & services industry ranked 3rd out of 14 monitored industries, recording 214 victims in the last 90 days, a meaningful decline from the previous 242.
Overall share also dropped from 11.45% to 9.96% of all ransomware victims.
Consumer goods & services, especially hospitality & leisure, food & beverage, and combined retail stores, are among the most frequent victims of ransomware globally across industries. This is in line with the sheer number of small and medium businesses in this industry.
Monthly Activity Trends
The monthly trendline shows a dip in September, followed by an all-time high in October, with numbers since oscillating along a mildly downward trend. April has already recorded 5 victims within its first few days.
Ransomware Gangs
A total of 38 out of 68 active ransomware groups targeted this industry in the past 90 days. That is a 56% participation.
Qilin: Continuously the most active gang with 347 victims across industries in the last 90 days. 43 were from this industry (12.5%).
Coinbasecartel, Lynx: Recorded the highest shares of victims (21% and 25%) among gangs with a higher number of victims, suggesting a focus on this industry.
The average share among groups with more than 3 victims was 13%. That is 1 in less than 8 of their victims was a retail business.
Geographic Distribution
The geographic distribution of ransomware victims is relatively high, and spread across 44 countries, up by one from 43 in the previous period.
The USA recorded 38% of all victims.
Italy, Thailand and India recorded the highest elevations.
Turkey, Japan, Saudi Arabia, and Morocco, on the other hand, have the largest declines.
For a comprehensive, up-to-date global ransomware tracking report, please refer to our new monthly “Tracking Ransomware” series here.
APT Campaigns (Moderate): Consumer goods & services saw 50% of observed APT campaigns record victims in this period, up from 40% prior. Notably, North Korea’s Lazarus Group leads campaign activity here, a shift from other sectors where China-linked actors dominate, though Chinese groups remain well represented. Victim distribution spans 42 countries, broader than most sectors, with a stronger Middle East presence than observed elsewhere. Targeting concentrates on web applications and operating systems, with database and security software appearing as secondary objectives.
Reported Cyber Incidents (Moderate): The sector ranked 4th out of 14 industries at 5.25% of reported incidents. Activity declined across the period, with the final 30 days recording the lowest volume. Extortion was the dominant technique, with AI-assisted attacks, zero-day exploitation, and account takeover each appearing sporadically. The United States accounted for the large majority of identified victims. As with other sectors, attribution and malware identification were limited by the nature of public reporting.
Underground & Dark Web Chatter (Moderate): The sector ranked 7th at 7.43% of detected chatter. The headline trend is a sharp late-period surge in data breach and leak mentions, driven by consumer sector exposure to payment data, personal information, and loyalty credentials. Ransomware chatter declined consistently across the period, as did hacktivism and web exploit activity, suggesting threat actor focus is shifting toward data theft over disruption or encryption.
Vulnerabilities (Moderate): The sector ranked 8th at 4.23% of disclosures. Injection attack vulnerabilities more than tripled in the final period, mirroring a pattern seen across other sectors this quarter. RCE vulnerabilities spiked mid-period and remain elevated. The overall volume is modest relative to higher-ranked sectors, but the injection escalation in consumer-facing platforms and e-commerce environments is the primary concern.
Ransomware (High): The sector ranked 3rd with 214 victims, down from 242 in the prior period, with overall share declining from 11.45% to 9.96%. Hospitality, food & beverage, and retail stores are the most targeted sub-sectors, driven largely by the sheer volume of small and medium businesses. 56% of active ransomware gangs targeted this sector. Coinbasecartel and Lynx show notably high sector concentration at 21% and 25% of their respective victim counts. The number of countries affected widened to 44, though the US accounts for 38% of all cases.