

PROFESSIONAL GOODS SERVICES Q1 I 2026 : INDUSTRY REPORT
The CYFIRMA Industry Report delivers original cybersecurity insights and telemetry-driven statistics of global industries, covering one sector each week for a quarter. This report focuses on the professional goods & services, presenting key trends and statistics in an engaging infographic format.
Welcome to the CYFIRMA infographic industry report, where we delve into the external threat landscape of the professional goods & services industry over the past three months. This report provides valuable insights and data-driven statistics, delivering a concise analysis of attack campaigns, phishing telemetry, and ransomware incidents targeting the B2B goods & services organizations.
We aim to present an industry-specific overview in a convenient, engaging, and informative format. Leveraging our cutting-edge platform telemetry and the expertise of our analysts, we bring you actionable intelligence to stay ahead in the cybersecurity landscape.
CYFIRMA delivers pre-emptive cybersecurity, cyber threat intelligence, and external threat landscape management through its platforms, DeCYFIR and DeTCT. These platforms have been purpose-built over many years to continuously collect, correlate, and analyse large volumes of external threat data, combining proprietary intelligence automation with deep, hands-on cyber threat research.
For the purpose of this report, the analysis draws on intelligence generated from CYFIRMA’s platforms. The data referenced has been processed through automated correlation and enrichment mechanisms, informed and validated by human-led research and investigative expertise, and sourced from both structured and unstructured external intelligence channels.
OBSERVED ATTACK CAMPAIGNS
REPORTED CYBER INCIDENTS
UNDERGROUND & DARK WEB CHATTER
VULNERABILITIES
RANSOMWARE
While this report contains data collected and processed by our in-house AI and ML, all charts, statistics, and analyses are done by human CYFIRMA CTI analysts to ensure the highest quality and provide accurate insights.
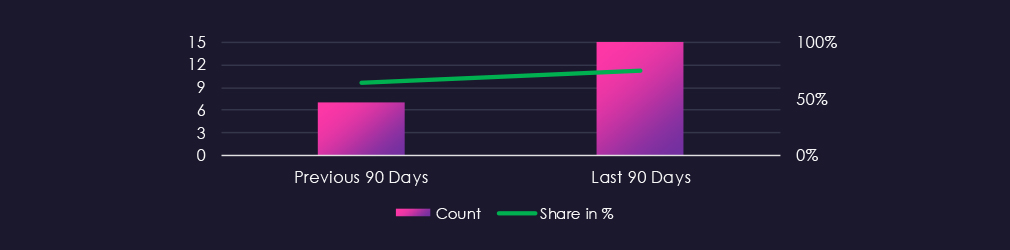
The professional goods & services industry featured in 15 out of the 20 observed campaigns, which is a presence in 75% of all campaigns. An increase from 64% presence in the previous period, where B2B organizations were present in 7 out of 11 campaigns.

Disregarding a few days of December, January followed by a large number of campaigns observed or updated. February then observed lower detections. March has seen 1 new or updated campaign, a likely shift due to geopolitical events in March.
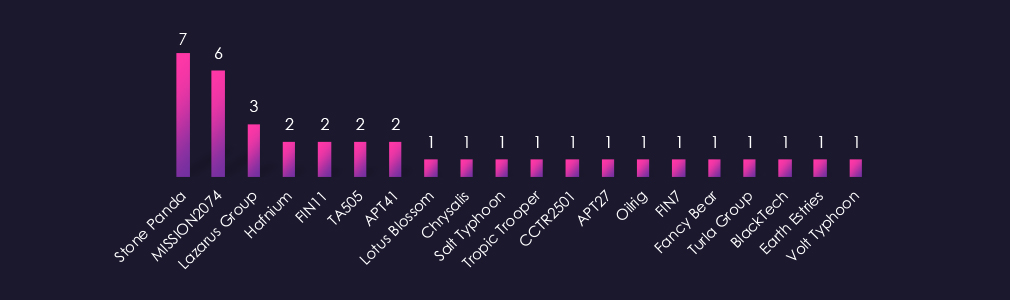
Observed APT campaigns are dominated by suspected China-linked, state-sponsored actors. Stone Panda and MISSION2074 jointly lead with the highest number of observed campaigns, followed by Lazarus Group, Hafnium, and APT41. Additional China-aligned representation includes Lotus Blossom, Tropic Trooper, Salt Typhoon, BlackTech, Earth Estries, and Volt Typhoon.
North Korea-associated Lazarus Group is the most prominent non-Chinese state actor this period. Russia-linked groups Fancy Bear and Turla Group also feature, alongside Iran-linked OilRig. Financially motivated actors, FIN11, FIN7, and TA505, appear across multiple campaigns, reflecting a broader mix of threat motivations compared to some other sectors. CCTR2501 represents a Turkish-speaking cybercriminal group.
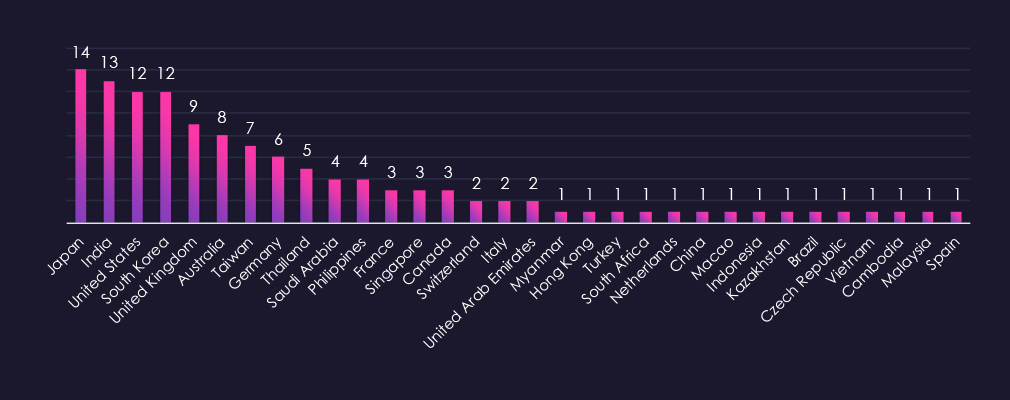
Victimology shows a high concentration in the Asia-Pacific region, which aligns with the suspected threat actors observed during this period. Japan records the highest number of victims, followed closely by India, the United States, and South Korea. The United Kingdom and Australia also appear frequently, with Taiwan and Germany rounding out the higher-frequency tier.
In the Middle East, Saudi Arabia and the UAE recorded victims across multiple campaigns. Southeast Asian countries, including Thailand, the Philippines, and Singapore, also appear regularly. Germany’s relatively high victim count is notable for a European country and may reflect the sector’s concentration of B2B and professional services targets in that market. Remaining victims are spread across continental Europe, Latin America, Central Asia, and isolated cases in Africa.
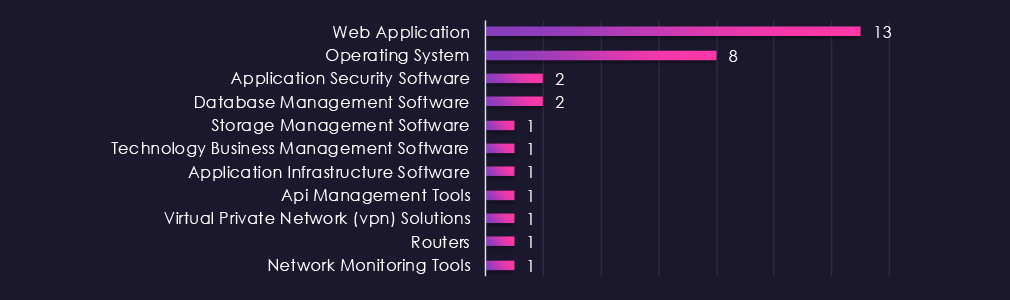
Web applications remain the most frequently targeted technology category, recording the highest number of observed attacks this period. Operating systems follow as the second most targeted, reflecting continued threat actor interest in host-level compromise. Application security software and database management software each recorded multiple instances, the former being notable as it suggests attempts to undermine defensive tooling directly.
The remaining targeted technologies, including storage management, API management, VPN solutions, routers, and network monitoring tools, each recorded single instances. While lower in frequency, targeting of VPNs, routers, and network monitoring tools is consistent with infrastructure access and persistence techniques commonly associated with state-sponsored actors observed during this period.
Risk Level Indicator: High

Over the past 90 days, the professional goods & services industry has been significantly impacted by advanced persistent threat (APT) campaigns.
15 out of 20 observed APT campaigns recorded victims in this industry. That is 75% presence in observed campaigns.
That is an increase from the previous 90-day period, during which 7 out of 11 campaigns targeted this industry, and in the overall share from the previous 64%.
Monthly Trends
January recorded 10 out of the 15. February then observed 4 detections. March has seen 1 campaign. Likely shift due to Iran-linked geopolitical events in March.
Key Threat Actors
Campaigns show a strong concentration of suspected China-linked threat actors, with Stone Panda and MISSION2074 jointly recording the highest number of observed campaigns. North Korea-associated Lazarus Group is the most prominent non-Chinese state actor, while Russia-linked Fancy Bear and Turla Group, and Iran-linked OilRig also appear. Financially motivated actors, including FIN11, FIN7, and TA505, are more prominent than in some other sectors, though state-sponsored activity remains the dominant driver.
Geographical Impact
Victims are concentrated in the Asia-Pacific region. Japan leads in victim count, followed closely by India, the United States, and South Korea. The United Kingdom, Australia, and Taiwan also recorded significant numbers, with Germany notable as the highest-ranking European country. Middle Eastern presence is noted through Saudi Arabia and the UAE. Remaining cases are spread across Southeast Asia, continental Europe, and Central Asia.
Targeted Technologies
Observed targeting is weighted toward web applications and operating systems, which account for most of the recorded attacks. Application security software and database management software each feature across multiple campaigns, the former suggesting attempts to compromise defensive tooling directly. Infrastructure-level technologies, including VPNs, routers, and network monitoring tools, appear less frequently but align with persistence techniques associated with state-sponsored actors observed during this period.
Over the past 90 days, DeCYFIR and DeTCT platforms tracked 763 cyber incidents reported publicly. We could identify the industry for 446 of these incidents (58%).
Professional goods & services were detected in 14 incidents, which equals 3.14% of the incidents where we knew the industry, ranking 8th out of 14 industries.
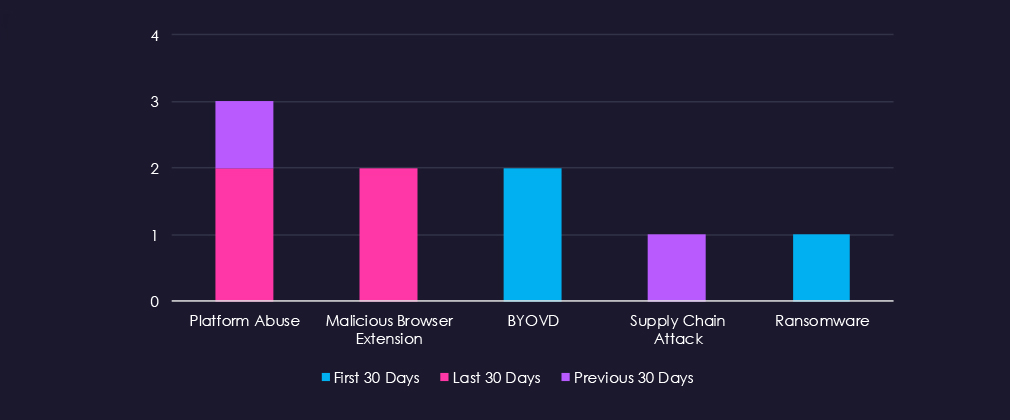
Platform abuse was the most frequently observed technique (3 incidents), concentrated in the previous and last 30-day periods. Malicious browser extensions appeared twice in the last 30 days. BYOVD (Bring Your Own Vulnerable Driver) attacks were identified in the first 30 days (2 incidents).
Supply chain attacks and ransomware each appeared once across the reporting period. The limited volume and scattered distribution of techniques suggest no dominant attack pattern, with activity spread across diverse methods.
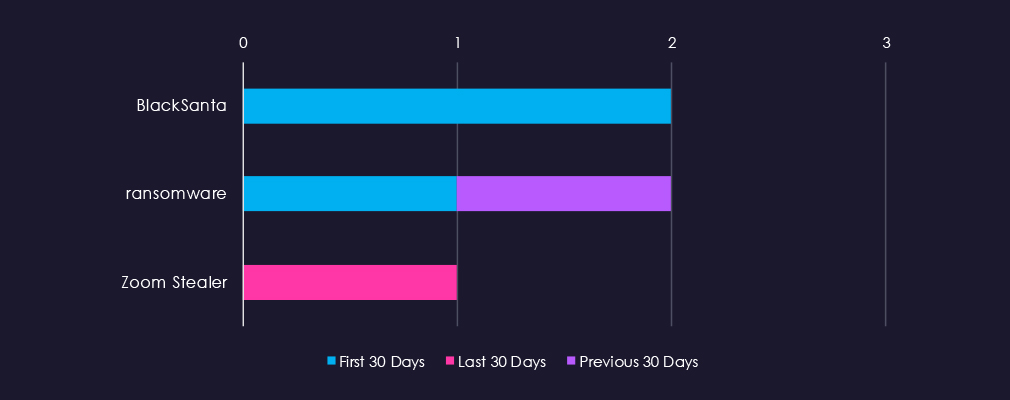
Malware identification was extremely limited across Professional Goods & Services incidents. BlackSanta appeared twice (first 30 days), ransomware was identified twice across two separate periods, and Zoom Stealer appeared once. This sparse coverage reflects the broader limitation that most public incident reports lack detailed technical indicators. The diversity of tools identified suggests no dominant malware family driving activity in this sector.
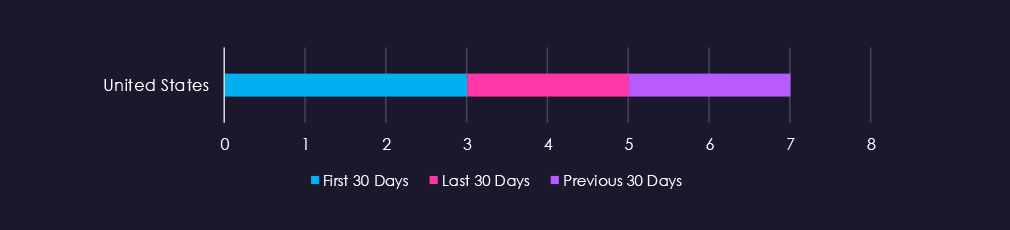
Victim country attribution was limited to 7 incidents, all targeting the United States. Attacking country was not identified in any incidents, reflecting the broader data limitation that public incident reports for this sector lack detailed attribution information.
Risk Level Indicator: Low

Over the past 90 days, the professional goods & services industry has not been significantly impacted by cyber incidents.
14 out of 446 industry-linked cyber incident reports were against B2B organizations. That is 3.14% presence and ranking 8th out of 14 industries.
We acknowledge this is low, as this data set is in development and will improve over time.
Monthly Trends
Activity was relatively stable across the reporting period, with 5 incidents in the first 30 days, declining slightly to 3 in the previous 30 days, then rising to 6 in the last 30 days. No significant seasonal pattern emerged, suggesting consistent targeting throughout the period.
Attack Techniques
Platform abuse was the most frequently observed technique (3 incidents), appearing across the previous and last 30-day periods. Malicious browser extensions appeared twice in the last 30 days. BYOVD (Bring Your Own Vulnerable Driver) attacks were identified in the first 30 days (2 incidents). Supply chain attacks and ransomware each appeared once. The limited volume and scattered distribution of techniques suggest no dominant attack pattern, with activity spread across diverse methods.
Malware/Tools used
Malware identification was extremely limited, reflecting the broader limitation that most public incident reports lack detailed technical indicators. BlackSanta appeared twice in the first 30 days. Ransomware and Zoom Stealer each appeared once across the reporting period. The diversity of tools identified suggests no dominant malware family driving activity in this sector.
Geographical Impact
Victim country attribution was limited to 7 incidents, all targeting the United States. Attacking country was not identified in any incidents, reflecting the broader data limitation that public incident reports for this sector lack detailed attribution information.
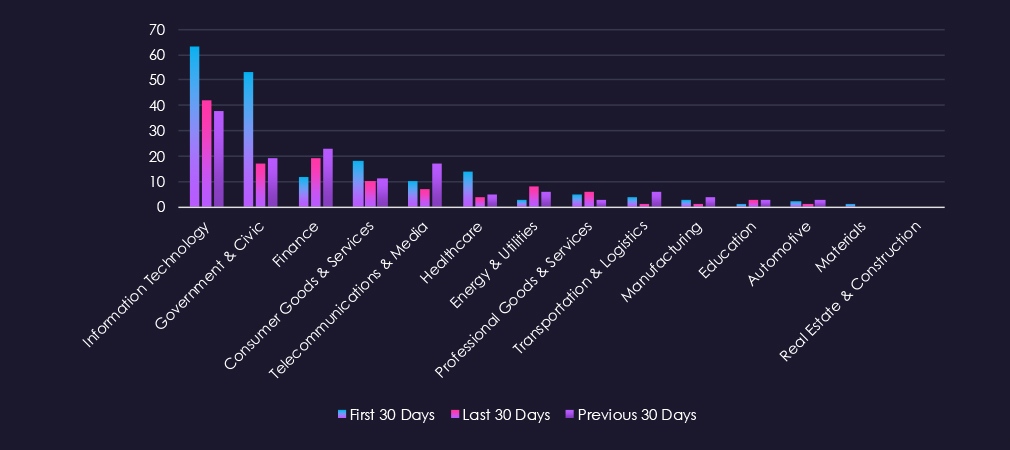
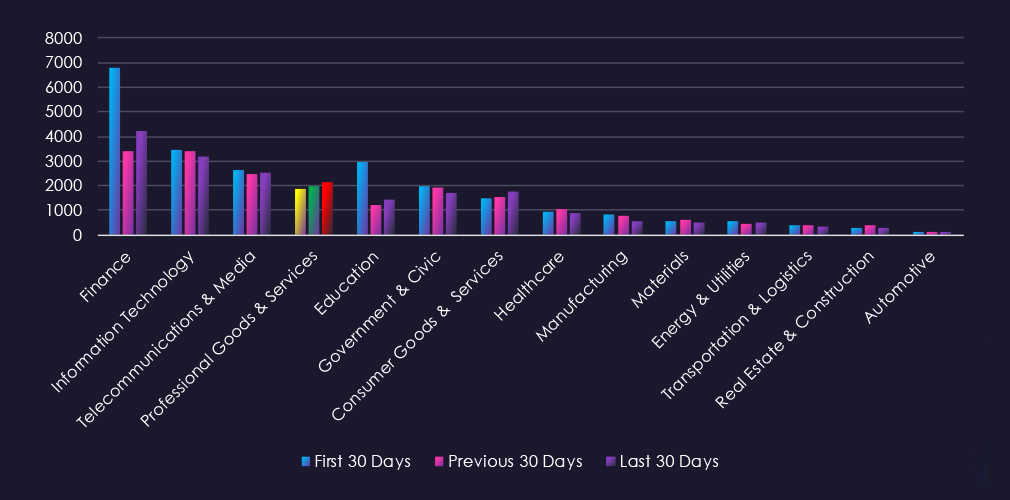
Over the past 90 days, CYFIRMA’s telemetry has identified 5.995 mentions of the professional goods & services industry out of a total of 64,618 industry-linked mentions. This is from a total of 300k+ posts across various underground and dark web channels and forums.
The professional goods & services industry placed 4th out of 14 industries in the last 90 days with a share of 9.28% of all detected industry-linked chatter.
Below is a breakdown by 30-day periods of all mentions.
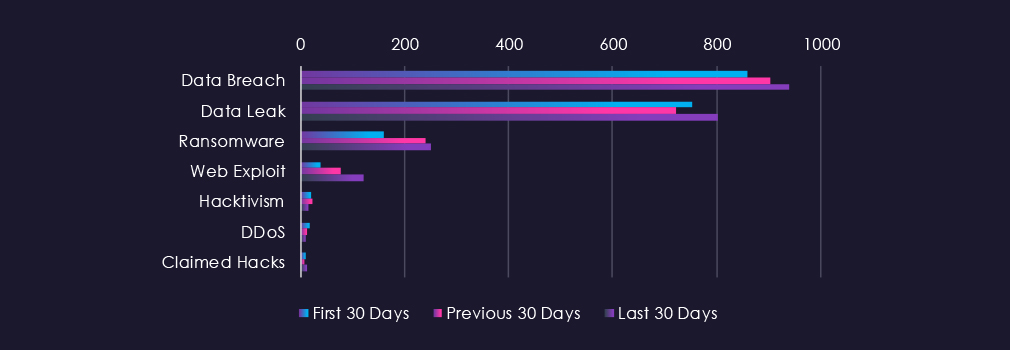
Underground & dark web chatter related to the professional goods & services sector over the last 90 days is dominated by data breach and data leak discussions, which remain consistently elevated across all three 30-day periods. Both categories show an upward trend, with data breaches rising from 860 to 940 and data leaks from 753 to 803.
Ransomware mentions increase substantially, rising from 161 to 250. Web exploits show notable growth, more than tripling from 39 to 121. Hacktivism and DDoS activity remain at comparatively lower volumes with modest fluctuation, while claimed hacks show modest increases in the final period.
Risk Level Indicator: High

In total, the professional goods & services industry comprise 9.28% of all detected industry underground and dark web chatter in the last 90 days. And ranking 4th out of 14 industries.
Below are observed key trends across 90 days:
Data Breach
860 → 902 → 940. Consistently high and rising across all periods. Professional services and goods companies remain major targets due to client data, financial information, and operational credentials, with the upward trend indicating sustained focus on newly surfaced compromises.
Data Leak
753 → 722 → 803. Initial dip followed by recovery. Indicates continued circulation of professional services-related data such as client lists, credentials, and internal documentation, with leak postings increasing in the final period.
Ransomware
161 → 240 → 250. Consistent and substantial increase across all periods. Ransomware targeting of professional goods & services sector is rising and sustained, reflecting the growing attractiveness of this sector to ransomware operators.
Web Exploit
39 → 76 → 121. Sharp and escalating increase across all periods, more than tripling over the window. Reflects intensifying probing of professional services web platforms, client portals, and e-commerce systems.
Claimed Hacks
10 → 7 → 13. Decline mid-period followed by recovery in the final period. Indicates modest publicly claimed intrusions or access sales involving professional goods & services entities.
DDoS
18 → 13 → 9. Consistent decline across periods. Indicates reduced emphasis on disruption-based attacks compared to data-focused and ransomware threats in this sector.
Hacktivism
19 → 23 → 16. Modest fluctuation with a decline in the final period. Suggests limited ideological targeting of professional goods & services infrastructure relative to other threat categories.
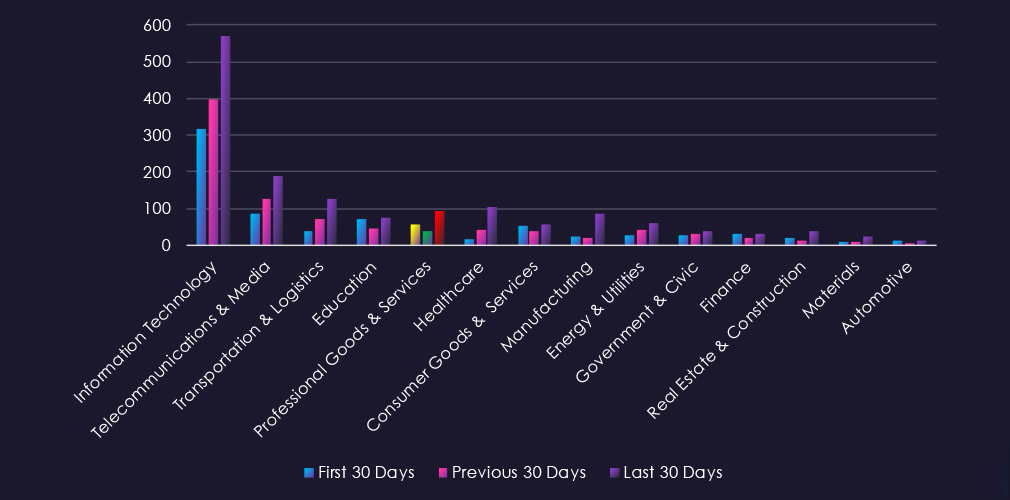
Over the past 90 days, CYFIRMA’s telemetry has identified 199 mentions of the professional goods & services industry out of a total of 3,582 industry mentions. This is from over 10k CVEs reported and updated in the last 90 days.
The professional goods & services industry ranked 5th out of 14 industries in the last 90 days, with a share of 40.14% of all detected industry-linked vulnerabilities.
Below is a breakdown by 30-day periods of all mentions.
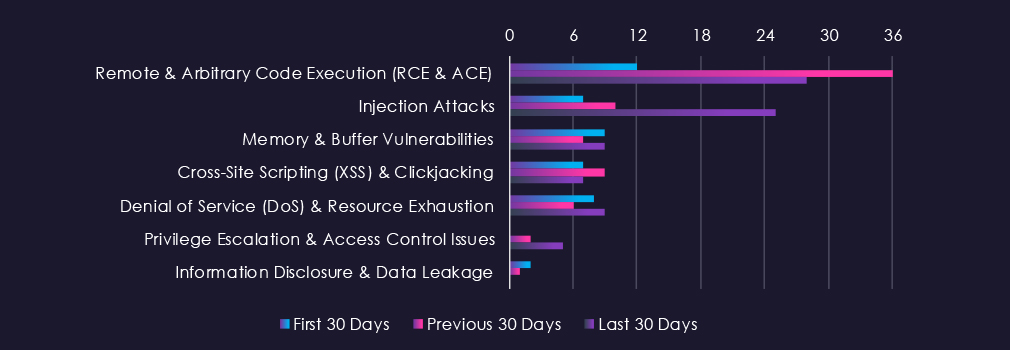
Reported CVEs in the professional goods & services sector over the last 90 days show variable activity across vulnerability categories. Remote and arbitrary code execution vulnerabilities spike mid-period before declining slightly, while injection attacks show a sharp increase in the final period. Memory and buffer vulnerabilities remain stable, and cross-site scripting activity fluctuates minimally. Denial of service vulnerabilities show modest increases, while privilege escalation issues and information disclosure remain at comparatively lower volumes.
Risk Level Indicator: Moderate

In total, the professional goods & services industry comprise of 5.56% of all detected industry-linked vulnerabilities in the last 90 days. And ranking 5th out of 14 industries.
Below are observed key trends across 90 days:
Remote & Arbitrary Code Execution (RCE & ACE)
12 → 36 → 28. Mid-period spike followed by a decline but remaining elevated above initial levels. RCE and ACE vulnerabilities represent high-impact threats to professional services systems due to the direct system compromise potential.
Injection Attacks
7 → 10 → 25. Sharp increase in the final period, more than tripling from initial levels. Growing volume of vulnerabilities targeting application logic and backend systems in professional services platforms.
Memory & Buffer Vulnerabilities
9 → 7 → 9. Minimal fluctuation across all periods. Represents stable but modest disclosure activity.
Cross-Site Scripting (XSS) & Clickjacking
7 → 9 → 7. Minimal fluctuation across all periods. Reflects consistent but limited client-side vulnerability disclosures.
Denial of Service (DoS) & Resource Exhaustion
8 → 6 → 9. Modest fluctuation across periods. Reflects variable DoS-enabling vulnerability disclosures.
Privilege Escalation & Access Control Issues
0 → 2 → 5. Emerging trend with an increase in the final period. Reflects growing disclosures of vulnerabilities enabling lateral movement and privilege advancement.
Information Disclosure & Data Leakage
2 → 1 → 0. Decline across periods. Minimal disclosure activity in this vulnerability category.
In the past 90 days, CYFIRMA has identified 387 verified ransomware victims in the professional goods & services industry. This accounts for 18.34% of all 2,110 ransomware victims during the same period, placing the B2B sector 1st out of 14 industries.
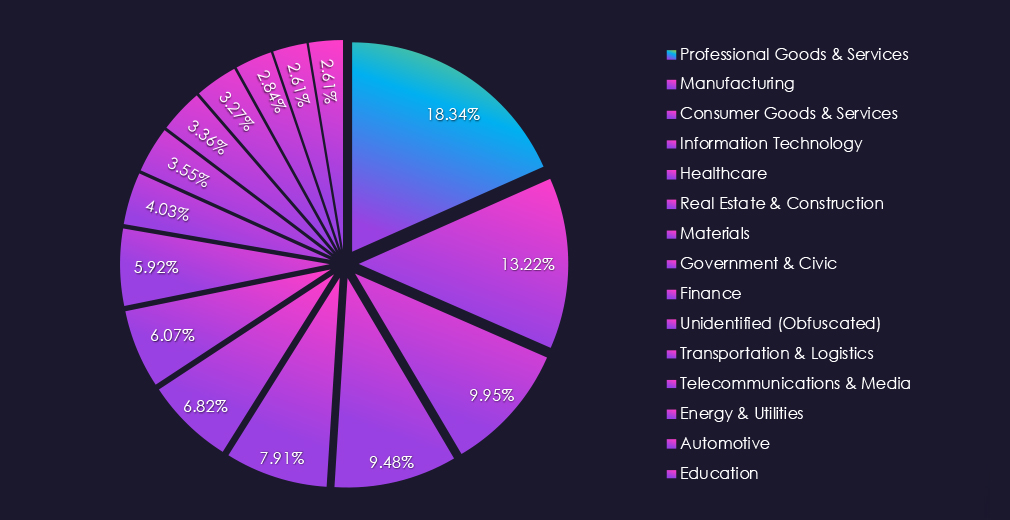
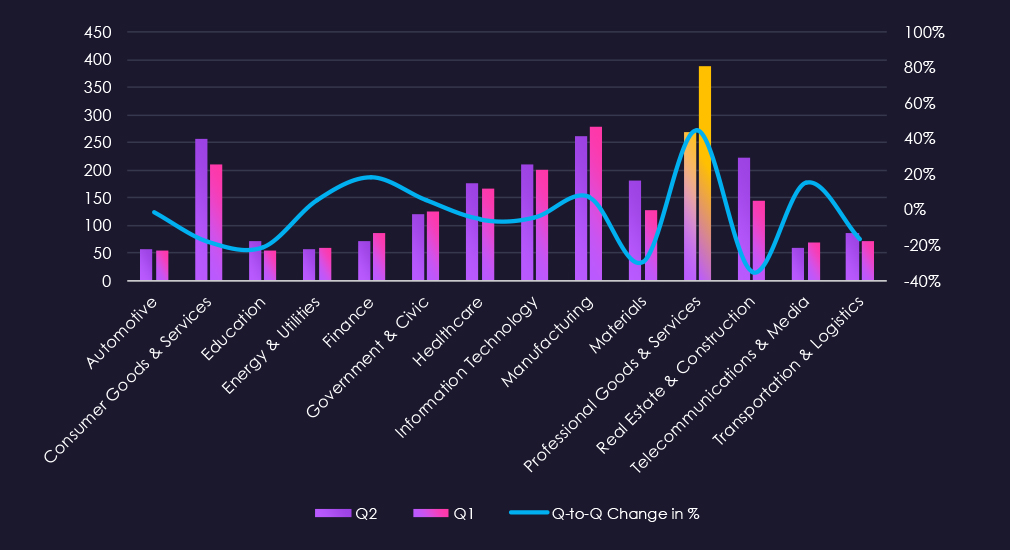
Furthermore, a quarterly comparison shows that the number of victims in the professional goods & services industry grew substantially. It went from 268 to 387 victims, a 44.4% increase. The overall interest, represented by share, also jumped from 12.33% to 18.34% of all victims.
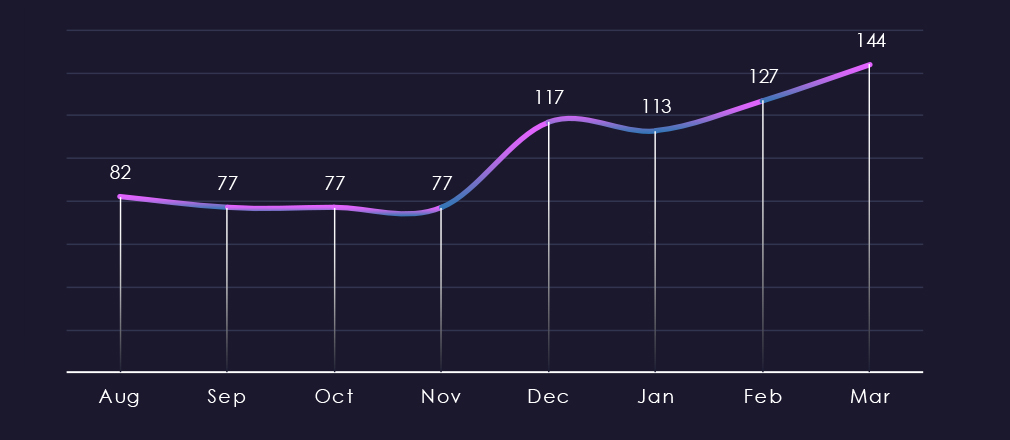
The monthly trendline shows us that the previous quarter was remarkably flat. Then in December, the number of victims jumped dramatically, stayed elevated in January, and grew gradually from there until the current end of March.
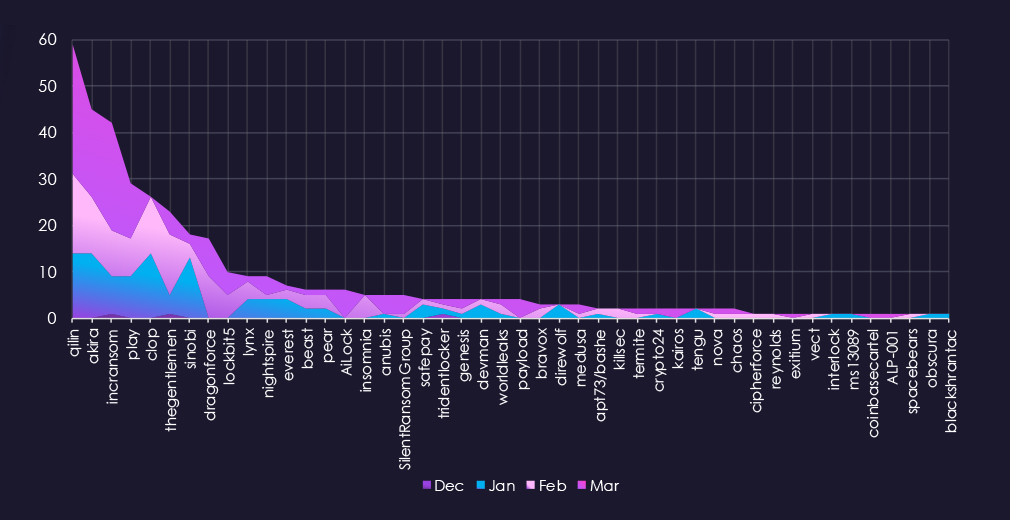
A breakdown of monthly activity per gang reveals which gangs were most active each month. For instance, the top 3 leading gangs were active each month.
On the other hand, the fifth most active gang, Cl0p, did not record any new victims in March.
Lastly, mid-size gangs like AiLock or Anubis contributed to the numbers in March after Cl0p stopped posting new victims.
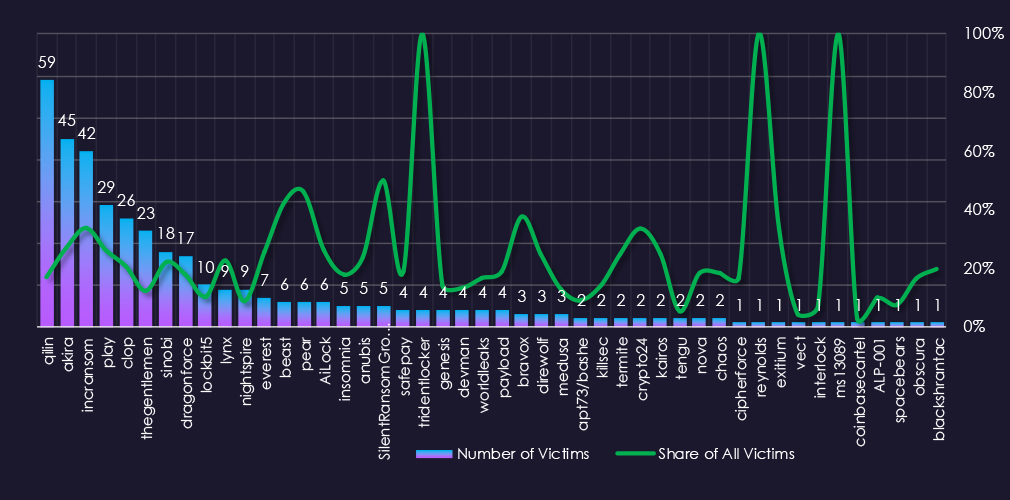
Out of the 68 gangs, 46 recorded victims in the professional goods & services industry in the last 90 days, representing a 57% participation.
Qilin had the highest number of victims and a 17% share out of all their 347 victims in this industry.
Since the B2B industry is comprised of countless small and medium businesses, which are the most common targets of ransomware, we can see the highest shares of most gangs from this industry. Among gangs with more than 5 victims, on average, 25.1%, 1 in 4 of their victims are B2B businesses.
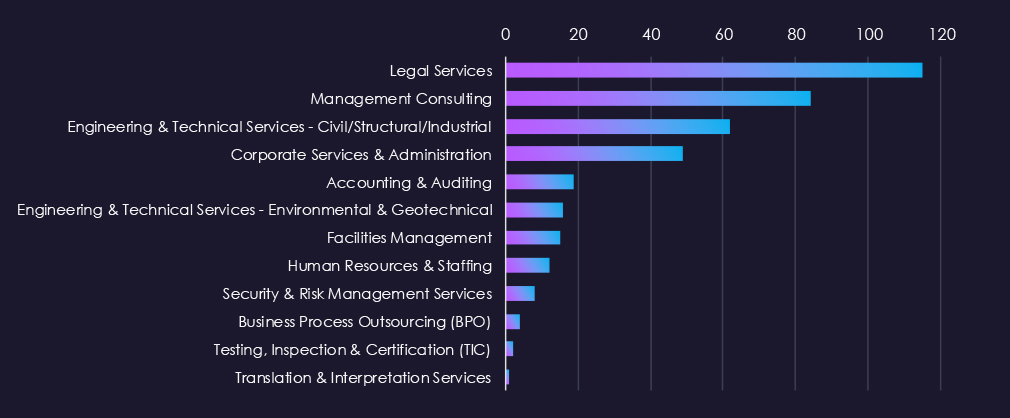
Legal Services, Management Consulting, and Engineering & Technical Services dominated ransomware activity in this sector, reflecting the high-value, confidential nature of their client data, a consistent draw for ransomware operators seeking leverage.
The remaining subsectors recorded comparatively low victim counts. Low figures at the tail of the distribution may reflect reduced targeting, underreporting, or limited public disclosure rather than an absence of risk.
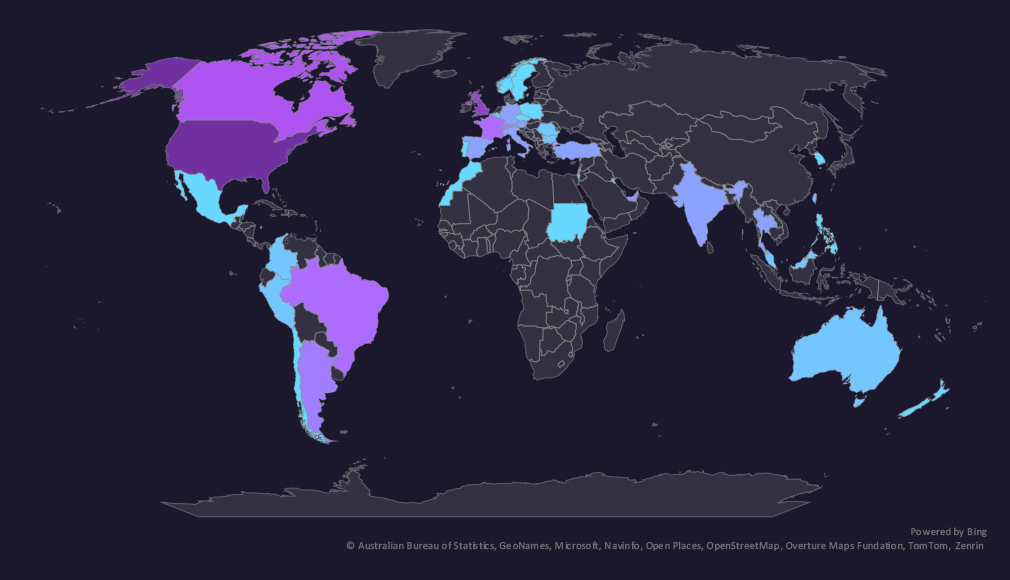
The geographic distribution heatmap underscores the widespread impact of ransomware, highlighting the countries where victims in this industry have been recorded.
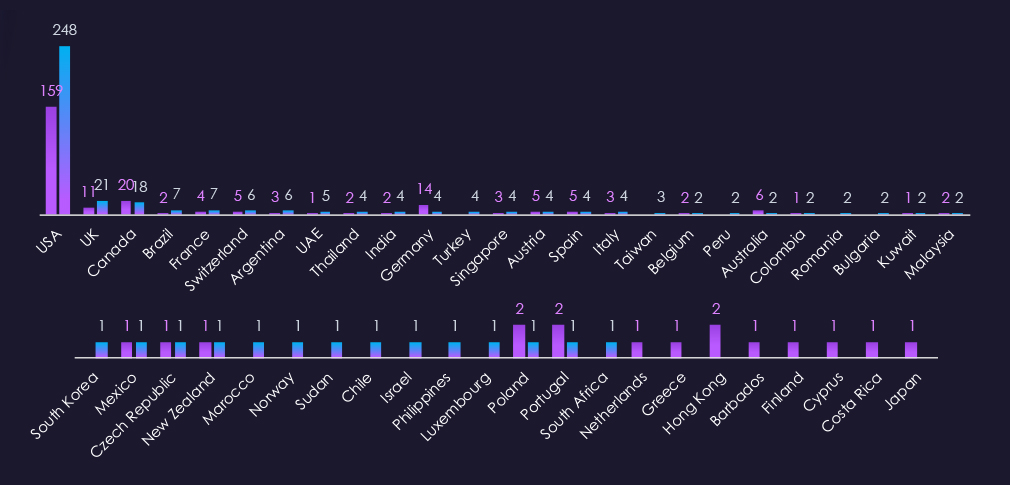
Professional goods & services victimology shows a spike of interest in the USA, recording 64% growth. The UK, Brazil, France, and the UAE recorded the highest elevations.
Germany and Australia, on the other hand, had the largest declines.
In the last 90 days, 41 countries recorded B2B industry victims. An increase from 33 countries in the previous period.
Overall, two-thirds (65%) of all victims are based in the US, and the remaining third is relatively highly distributed.
Risk Level Indicator: High

The professional goods & services industry ranked 1st out of 14 monitored industries, recording 385 victims in the last 90 days. A dramatic increase from the previous 268.
Overall share also grew significantly from 12.33% to 18.34% of all ransomware victims.
Professional goods & services, especially legal services, management consulting, engineering, technical services, and corporate services & administration, are among the most frequent victims of ransomware globally across industries. This is in line with the pivot to the target organizations, which work with client data and allow for the discovery of future victims.
Monthly Activity Trends
After a remarkably flat previous quarter, in December, the number of victims dramatically increased, remained elevated in January, and gradually grew until the end of March.
Ransomware Gangs
A total of 46 out of 68 active ransomware groups targeted this industry in the past 90 days. That is 68% participation.
Qilin: Continuously the most active gang with 347 victims across industries in the last 90 days. 59 were from this industry (17%).
Since the B2B industry is comprised of countless small and medium businesses, which are the most common targets of ransomware, we can see the highest shares of most gangs from this industry. Among gangs with more than 5 victims, on average, 25.1%, 1 in 4 of their victims are B2B businesses.
Geographic Distribution
The geographic distribution of ransomware victims is relatively high, and spread across 41 countries, up from 33 in the previous period.
The USA, however, recorded 65% of all victims.
The UK, Brazil, France, and the UAE recorded the highest elevations.
Germany and Australia, on the other hand, had the largest declines.
For a comprehensive, up-to-date global ransomware tracking report, please refer to our new monthly “Tracking Ransomware” series here.
APT Campaigns (High): Professional goods & services saw 75% of observed APT campaigns record victims, up from 64% than the prior period, and the highest share across the reporting window. China-linked actors dominate, with Stone Panda and MISSION2025 leading, though financially motivated groups, including FIN7, FIN11, and TA505, are more prominent here than in most other sectors. Targeting is concentrated in Asia-Pacific and weighted toward web applications and security software, the latter suggesting attempts to compromise defensive tooling directly.
Reported Cyber Incidents (Low): The sector ranked 8th out of 14 industries, accounting for 3.14% of reported incidents, a low figure acknowledged as a data development limitation rather than a reliable signal of low risk. Activity was relatively stable across the period with no dominant attack pattern. Platform abuse was the most observed technique, with BYOVD, malicious browser extensions, and supply chain attacks each appearing sporadically. Attribution was limited, with all identified victim incidents pointing to the United States.
Underground & Dark Web Chatter (High): The sector ranked 4th across industries at 9.28% of all detected chatter. Unlike most sectors, breach and ransomware trends here are rising rather than declining. Data breach mentions grew consistently across all three periods, and ransomware chatter increased by over 55% across the window. Web exploit activity more than tripled. These converging upward trends indicate growing and sustained threat actor interest in professional services data and client access.
Vulnerabilities (Moderate): The sector ranked 5th, accounting for 5.56% of industry-linked disclosures. Injection attack vulnerabilities more than tripled in the final period, the sharpest single-category escalation. RCE vulnerabilities spiked mid-period and remain elevated. Privilege escalation disclosures, while modest in volume, are an emerging trend. Overall, the vulnerability profile is broadening, with application logic and access control exposures as the primary concern.
Ransomware (High): The sector ranked 1st across all industries with 385 victims, a 44% increase from the prior period’s 268, and grew its share from 12% to over 18% of all ransomware victims. Legal services, management consulting, and engineering firms are the most frequent targets, driven by their access to client data and downstream victim potential. 68% of active ransomware gangs targeted this sector, with Qilin leading at 59 victims. The US accounted for 65% of all victims.