
The CYFIRMA Industry Report delivers original cybersecurity insights and telemetry-driven statistics of global industries, covering one sector each week for a quarter. This report focuses on the information technology industry, presenting key trends and statistics in an engaging infographic format.
Welcome to the CYFIRMA infographic industry report, where we delve into the external threat landscape of the information technology industry over the past three months. This report provides valuable insights and data-driven statistics, delivering a concise analysis of attack campaigns, phishing telemetry, and ransomware incidents targeting information technology organizations.
We aim to present an industry-specific overview in a convenient, engaging, and informative format. Leveraging our cutting-edge platform telemetry and the expertise of our analysts, we bring you actionable intelligence to stay ahead in the cybersecurity landscape.
CYFIRMA delivers pre-emptive cybersecurity, cyber threat intelligence, and external threat landscape management through its platforms, DeCYFIR and DeTCT. These platforms have been purpose-built over many years to continuously collect, correlate, and analyse large volumes of external threat data, combining proprietary intelligence automation with deep, hands-on cyber threat research.
For the purpose of this report, the analysis draws on intelligence generated from CYFIRMA’s platforms. The data referenced has been processed through automated correlation and enrichment mechanisms, informed and validated by human-led research and investigative expertise, and sourced from both structured and unstructured external intelligence channels.
While this report contains data collected and processed by our in-house AI and ML, all charts, statistics, and analyses are done by human CYFIRMA CTI analysts to ensure the highest quality and provide accurate insights.
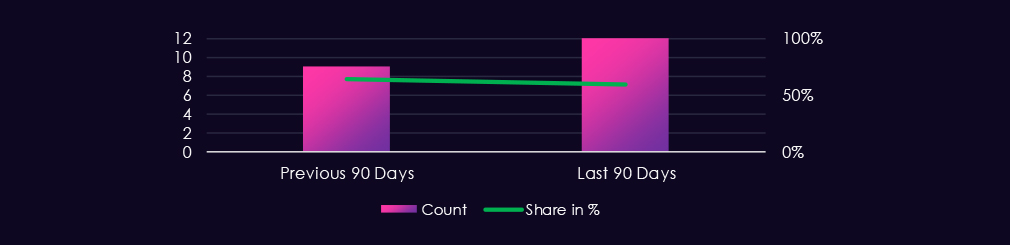
The information technology industry featured in 12 out of the 20 observed campaigns, which is a presence in 60% of all campaigns, an increase from the previous period, where IT organizations were present in 9 out of 14 campaigns; however, a mild decline from 64% presence.

2 of the observed campaigns were detected in December, followed by a large number of campaigns observed or updated in January. February then observed lower detections. March so far has not seen new or updated campaigns.
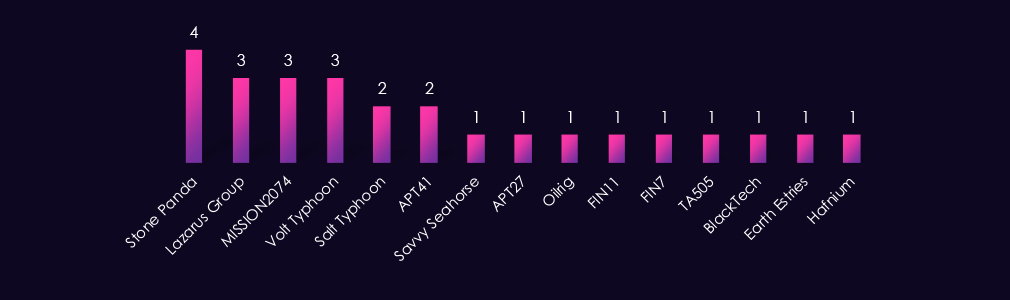
Observed APT campaigns are dominated by suspected China-linked, state-sponsored actors. Stone Panda leads with four observed campaigns, followed by MISSION2074, Volt Typhoon, and Lazarus Group at three each, with Salt Typhoon and APT41 rounding out the higher-frequency tier.
Additional China-aligned representation includes BlackTech, Earth Estries, and Hafnium. North Korea-associated Lazarus Group is the most prominent non-Chinese state actor this period. Iran-linked OilRig and suspected Russian-speaking Savvy Seahorse also feature, alongside financially motivated actors FIN11, FIN7, and TA505.
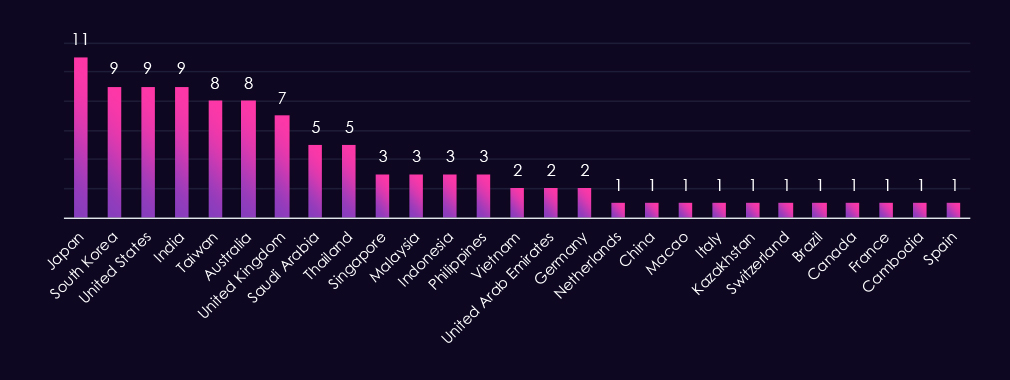
Victim distribution is heavily concentrated in the Asia-Pacific region, which aligns with the suspected threat actors observed during this period. Japan recorded the highest number of victims, with South Korea, the United States, and India close behind.
Taiwan and Australia also appear frequently across the observed campaigns. The United Kingdom is the most affected country in Europe by a notable margin. In the Middle East, Saudi Arabia and the UAE recorded the most victims, consistent with the presence of an Iran-linked actor.
Southeast Asian countries, including Thailand, Singapore, Malaysia, Indonesia, and the Philippines, also appear across multiple campaigns. Remaining victims are spread across continental Europe, Latin America, and Central Asia in low numbers. Notably, China recorded a single victim entry despite being the primary attributed origin of threat actors observed during this period.
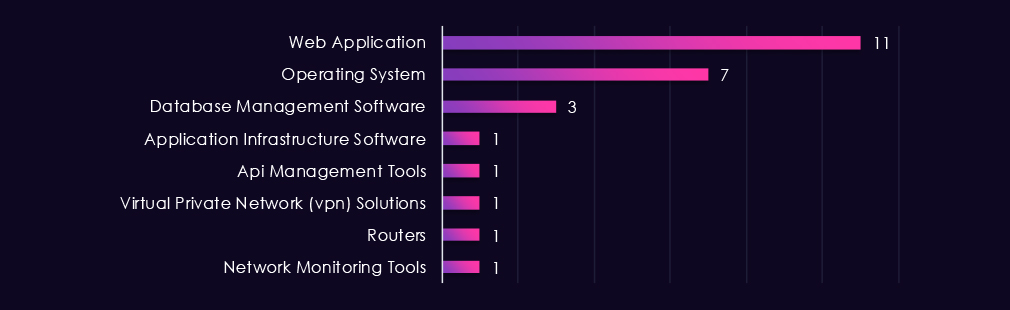
Web applications represent the most frequently targeted technology category, accounting for the highest number of observed attacks this period. Operating systems follow as the second most targeted, reflecting continued threat actor interest in host-level compromise.
Database management software also recorded multiple instances, suggesting data exfiltration as a likely objective in several campaigns. The remaining targeted technologies, including application infrastructure, API management tools, VPN solutions, routers, and network monitoring tools, each recorded single instances. While lower in frequency, targeting of VPNs, routers, and network monitoring tools is consistent with the infrastructure access and persistence techniques commonly associated with state-sponsored actors observed during this period.
Risk Level Indicator: High

Over the past 90 days, the information technology industry has been significantly impacted by advanced persistent threat (APT) campaigns.
12 out of 20 observed APT campaigns recorded victims in this industry. That is a 60% presence in observed campaigns.
That is an increase from the previous 90-day period, during which 9 out of 14 campaigns targeted this industry; however, the overall share has declined from the previous 64%.
Monthly Trends
Two of the observed campaigns were detected in December, followed by a high number of campaigns observed or updated in January. February saw a decrease in detections. As of March, no new or updated campaigns have been observed.
Key Threat Actors
Campaigns show a strong concentration of suspected China-linked threat actors, with Stone Panda recording the highest number of observed campaigns. North Korean Lazarus Group is the most prominent non-Chinese state actor, while Iran-linked and Russian-speaking actors also appear. Financially motivated actors are present but in lower numbers, indicating activity is primarily driven by strategic intelligence or infrastructure-focused objectives.
Geographical Impact
Asia-Pacific recorded the highest concentration. Japan leads in victim count, followed closely by South Korea, the United States, and India. Taiwan, Australia, and the United Kingdom also recorded significant numbers. Middle Eastern presence is noted through Saudi Arabia and the UAE, consistent with Iran-linked actor activity. Remaining cases are spread across Southeast Asia, continental Europe, and Central Asia.
Targeted Technologies
Observed targeting is weighted toward web applications and operating systems, which together account for the majority of recorded attacks. Database management software also features across multiple campaigns, suggesting data exfiltration as a likely objective in several cases. Infrastructure-level technologies, including VPNs, routers, and network monitoring tools, appear at a lower frequency but are consistent with the persistence and access techniques associated with state-sponsored actors observed during this period.
Over the past 90 days, DeCYFIR and DeTCT platforms tracked 734 cyber incidents reported publicly. We could identify the industry for 384 of these incidents (52%).
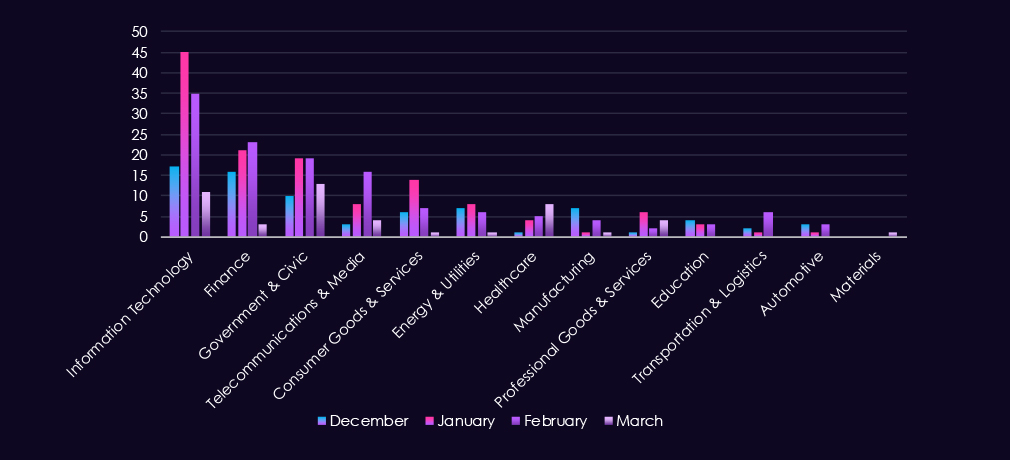
Information Technology had the most incidents at 108, which equals 28% of the incidents where we knew the industry, ranking 1st out of 14 industries.
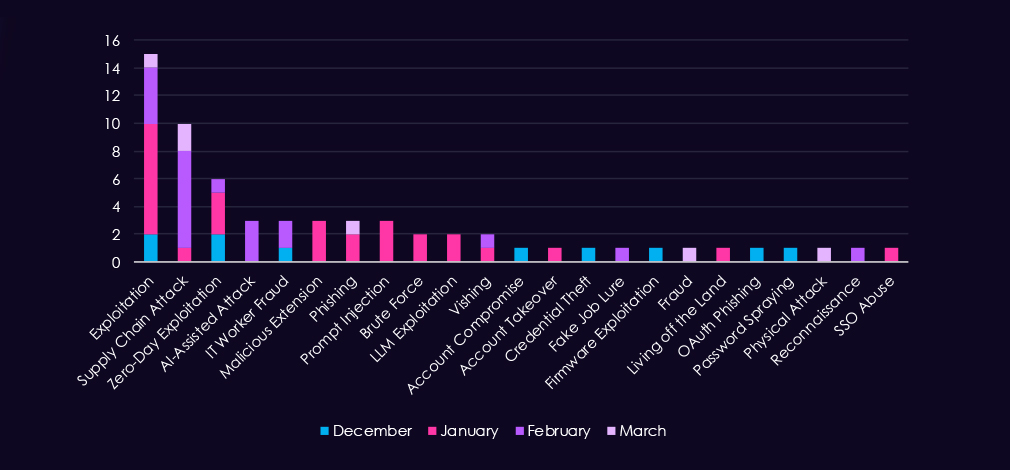
Exploitation and supply chain attacks dominated the 90-day period, accounting for the most observed techniques. Exploitation peaked in January (8 incidents) and then declined sharply. Supply chain attacks showed the opposite pattern, rising from 1 incident in January to 7 in February before dropping to 2 in March.
Newer attack methods emerged sporadically. AI-assisted attacks and prompt injection techniques appeared only in January and February, respectively, suggesting early experimentation. Credential-based attacks—including phishing, vishing, account compromise, and credential theft—remained marginal across all months.
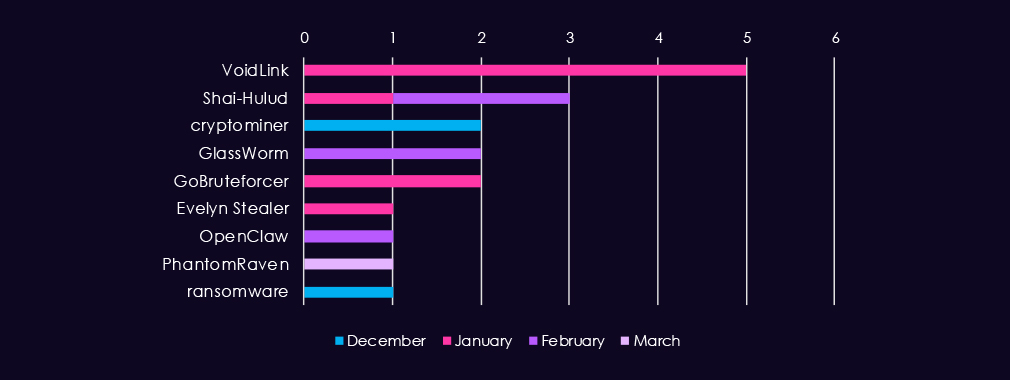
Malware and tool usage in IT sector incidents was diverse, with no dominant tool or malware family. VoidLink appeared most frequently (5 incidents in January), followed by isolated detections of Shai-Hulud, GlassWorm, GoBruteforcer, and others. Most tools were identified in only one or two incidents across the 90 days.
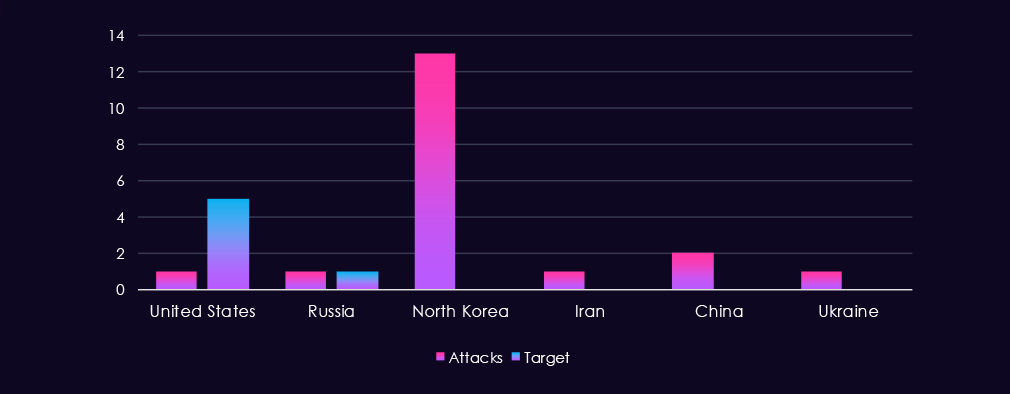
The United States was the most frequently identified target, appearing in five incidents, while Russia was targeted in one. On the threat actor side, North Korea dominated with 13 attributed incidents, followed by China with two, and the United States, Russia, Iran, and Ukraine each appearing in one.
However, this geographic framing has limited value for the IT sector, where public reports typically focus on targeted companies, software, or technology platforms rather than national borders.
Risk Level Indicator: High

Over the past 90 days, the information technology industry has been significantly impacted by cyber incidents.
108 out of 384 od industry-linked cyber incident reports were against information technology. That is 28% presence and ranking 1st out of 14 industries.
Monthly Trends
Activity has peaked during January and slowed slightly during February. Nearing the middle of March, activity so far seems to be slowing down even further.
Attack Techniques
Exploitation and supply chain attacks dominated the 90 days. Exploitation peaked in January (8 incidents) and then declined sharply. Supply chain attacks showed the opposite pattern, rising from 1 incident in January to 7 in February before dropping to 2 in March. Newer attack methods—including AI-assisted attacks and prompt injection—appeared sporadically, indicating early-stage experimentation rather than sustained campaigns.
Malware/Tools used
Malware and tool identification was limited, reflecting the broader limitation that most public incident reports lack detailed technical indicators. VoidLink was the most frequently identified tool (5 incidents in January), with all others appearing once or twice. Observed targeting is weighted toward web applications and operating systems, suggesting flexible intrusion approaches rather than concentration on a specific technology class.
Geographical Impact
Attribution data for both attacking and victim countries was sparse. North Korea was identified as an attacking entity in 13 incidents, with China, Russia, Iran, Ukraine, and the United States each appearing once. Victim countries were rarely specified (6 incidents total); when identified, the United States was named in 5 cases. Geographic attribution has limited utility for the IT sector, where public reports typically focus on targeted companies and systems rather than national borders.
Over the past 90 days, CYFIRMA’s telemetry has identified 10,476 mentions of the information technology industry out of a total of 65,238 industry-linked mentions. This is from a total of 300k+ posts across various underground and dark web channels and forums.
The information technology industry placed 2nd out of 14 industries in the last 90 days, with a share of 16.06% of all detected industry-linked chatter.
Below is a breakdown by 30-day periods of all mentions.
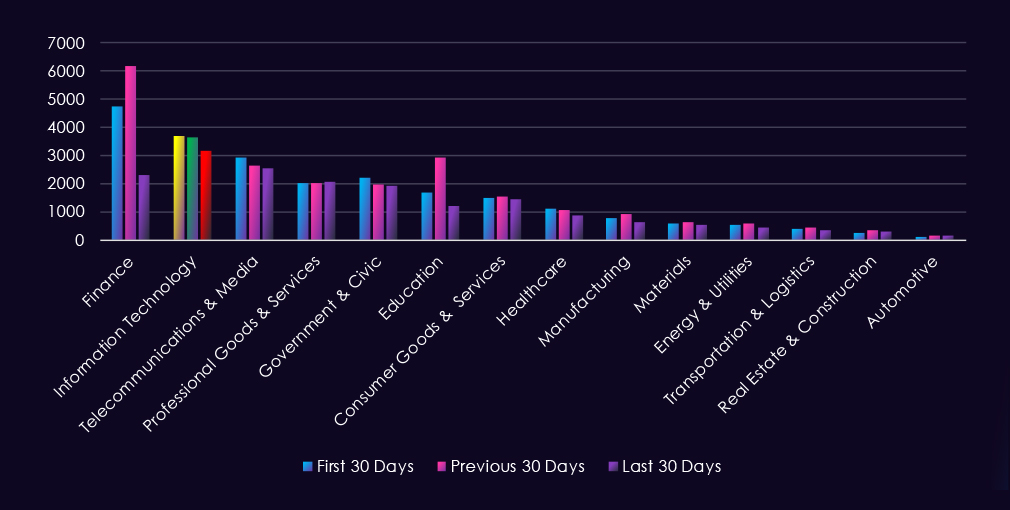
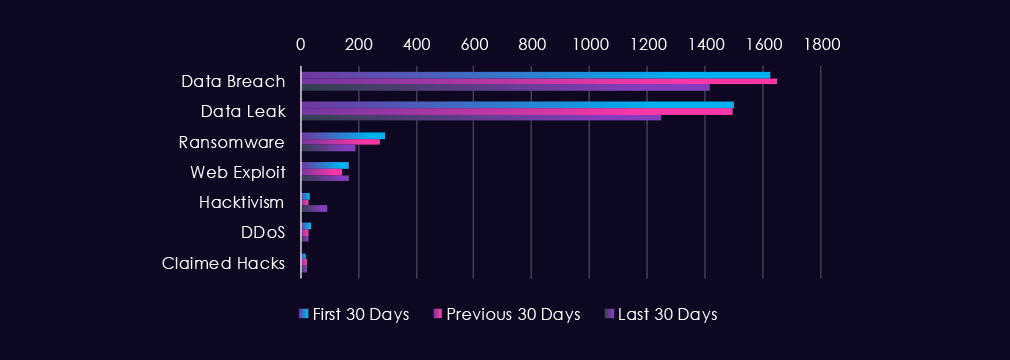
Underground & dark web chatter related to the information technology sector over the last 90 days is dominated by data breach and data leak discussions, which remain consistently elevated across all three 30-day periods. Both categories declined over the period.
Ransomware mentions decreased substantially, while web exploits remained relatively stable. Hacktivism activity has increased notably in the most recent period. DDoS and claimed hacks remain at comparatively lower volumes with modest fluctuation.
Risk Level Indicator: High

In total, the information technology industry comprise 16.06% of all detected industry underground and dark web chatter in the last 90 days, ranking 2nd out of 14 industries.
Below are observed key trends across 90 days:
Data Breach
1,627 → 1,647 → 1,418. Very high but declining in the final period after an initial rise. IT infrastructure and software remain major targets due to source code, credentials, and system access, though the downward trend suggests fewer newly surfaced large-scale compromises.
Data Leak
1,499 → 1,493 → 1,250. Mirrors the breach trend with a steady decline. Indicates continued circulation of IT-related data such as source code, credentials, and internal documentation, though leak postings are less frequent in the final period.
Ransomware
294 → 274 → 191. Consistent decline across all periods. Ransomware targeting of IT infrastructure is decreasing rather than sustained, potentially due to evolving changes of active gangs or shifts in monetization strategies.
Web Exploit
169 → 144 → 165. Slight dip mid-period with recovery recently. Reflects ongoing probing of IT platforms, development infrastructure, cloud services, and application vulnerabilities.
Claimed Hacks
17 → 23 → 24. A modest increase in the latest period. Suggests continued publicly claimed intrusions or access sales involving IT companies and services.
DDoS
37 → 27 → 26. Stable decline across periods. Indicates reduced emphasis on disruption-based attacks compared to data-focused threats in IT sector discussions.
Hacktivism
32 → 26 → 93. Dramatic rise in the final period. Suggests a significant surge in ideological targeting of IT infrastructure, potentially linked to geopolitical narratives or information influence operations.
Over the past 90 days, CYFIRMA’s telemetry has identified 1.286 mentions of the information technology industry out of a total of 3,204 industry mentions. This is from over 10k CVEs reported and updated in the last 90 days.
The information technology industry ranked 1st out of 14 industries in the last 90 days, with a share of 40.14% of all detected industry-linked vulnerabilities.
Below is a breakdown by 30-day periods of all mentions.
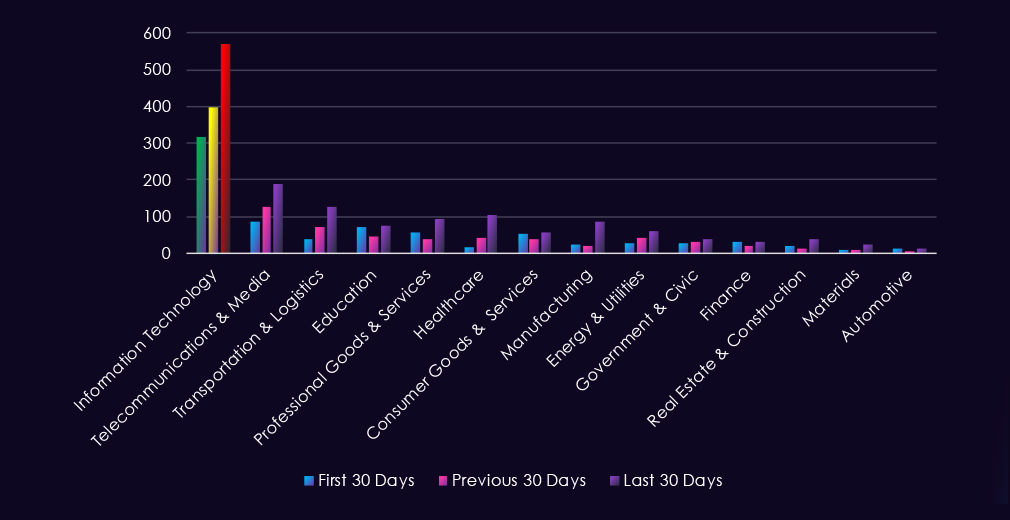
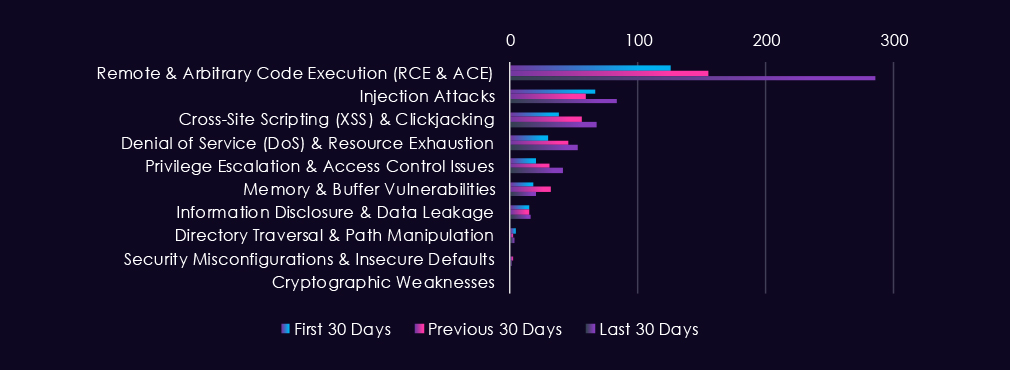
Reported CVEs in the information technology sector over the last 90 days are dominated by remote and arbitrary code execution vulnerabilities, which show a sharp upward trend across all three 30-day periods. Injection attacks and cross-site scripting remain consistently present at lower volumes. Denial of service and privilege escalation vulnerabilities show moderate increases, while memory and buffer vulnerabilities decline after a mid-period spike. Lower-impact vulnerability categories remain comparatively minimal with minimal fluctuation.
Risk Level Indicator: High

In total, the information technology industry comprise of 40.14% of all detected industry-linked vulnerabilities in the last 90 days. And ranking 1st out of 14 industries.
Below are observed key trends across 90 days:
Remote & Arbitrary Code Execution (RCE & ACE)
126 → 155 → 286. Sharp and escalating increase across all periods, more than doubling in the final period. RCE and ACE vulnerabilities represent the highest-impact threats to IT infrastructure due to the potential for direct system compromise.
Injection Attacks
67 → 59 → 83. Modest decline mid-period followed by recovery. Remains a consistently disclosed attack vector targeting application logic and database interactions.
Cross-Site Scripting (XSS) & Clickjacking
38 → 56 → 68. Steady increase across all periods. Growing volume of client-side vulnerabilities affecting web applications and user-facing IT services.
Denial of Service (DoS) & Resource Exhaustion
30 → 45 → 53. Consistent upward trend. Reflects the increasing volume of DoS-enabling vulnerabilities in IT systems.
Privilege Escalation & Access Control Issues
20 → 31 → 41. Steady increase across periods. Sustained volume of vulnerabilities enabling lateral movement and privilege advancement.
Memory & Buffer Vulnerabilities
18 → 32 → 20. Spike mid-period followed by a decline. Represents variable disclosure activity.
Information Disclosure & Data Leakage
15 → 15 → 16. Minimal and stable across all periods.
Directory Traversal & Path Manipulation
4 → 2 → 3. Minimal activity with negligible fluctuation.
Security Misconfigurations & Insecure Defaults
0 → 2 → 1. Minimal and sporadic disclosures.
Cryptographic Weaknesses
0 → 0 → 0. No reported activity.
In the past 90 days, CYFIRMA has identified 205 verified ransomware victims in the information technology industry. This accounts for 9.36% of all 2,190 ransomware victims during the same period, placing the information technology industry 4th out of 14 industries.
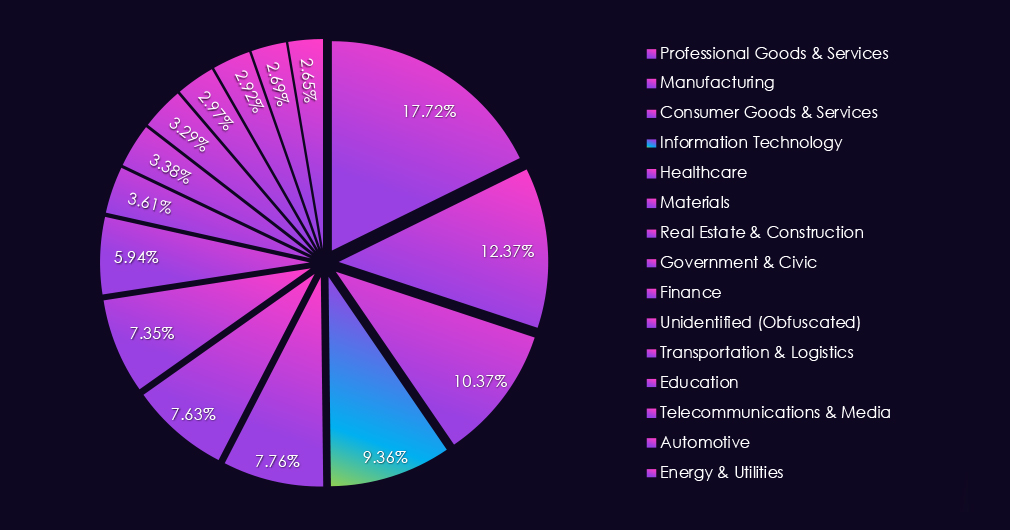
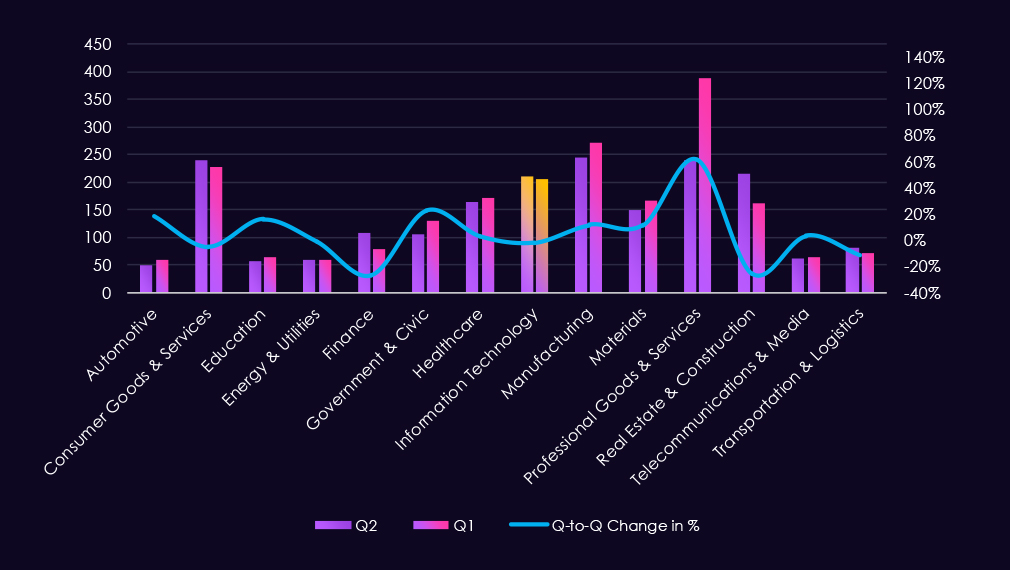
Furthermore, a quarterly comparison shows that the number of victims in the information technology industry remained remarkably stable. There was a minimal change from 209 to 205 victims. The overall interest, represented by share, however, declined from 10.20% to 9.36% of all victims.
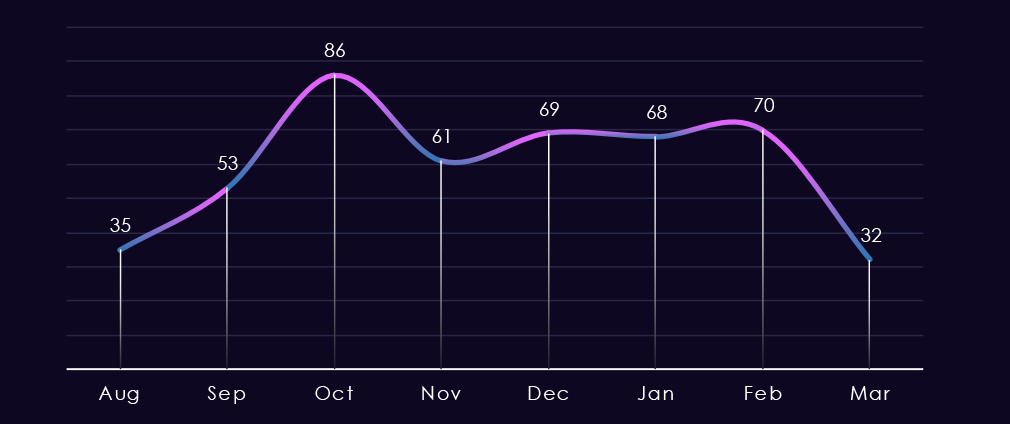
The monthly trendline shows us that despite both quarters recording the same number of victims, the monthly activity had different profiles. August recorded a substantial dip below the monthly average, then October spiked above the monthly average. Since November and especially from December, we have been observing a nearly flat sideways line. March so far is poised to match the last 4 months’ victim counts.
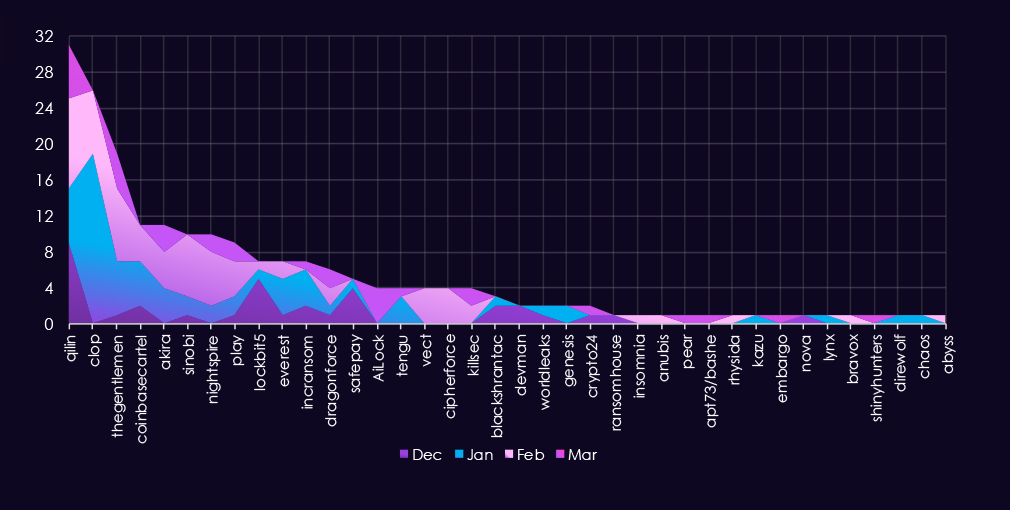
A breakdown of monthly activity per gang reveals which gangs were most active each month. For instance, the most active gang, Qilin, recorded victims every month.
On the other hand, the second most active gang, Cl0p, was highly active in January and, after a slower February, did not record new victims.
Lastly, AiLock, a new gang, is gaining a significant number of victims since its early March debut.
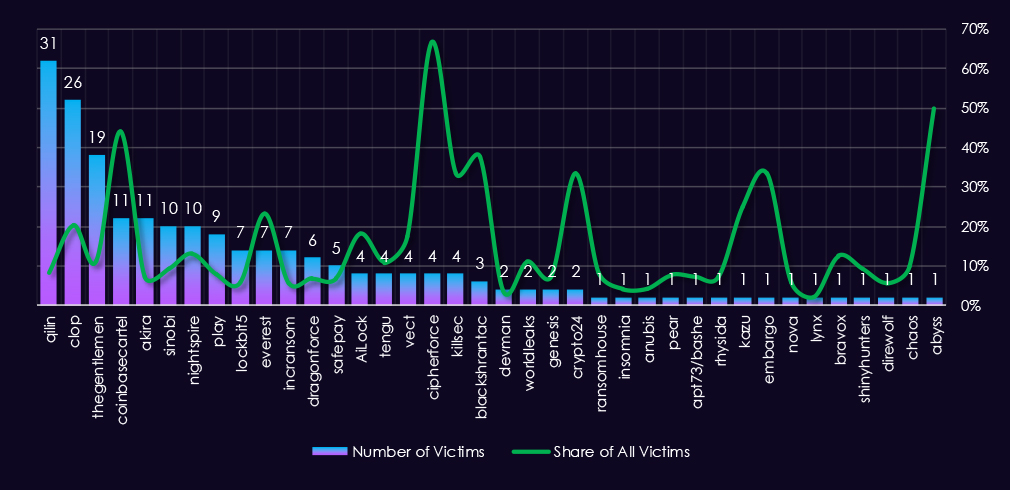
Out of the 67 gangs, 38 recorded victims in the information technology industry in the last 90 days, representing a 57% participation.
Qilin had the highest number of victims and 8.1% share out of all their 382 victims in the information technology industry.
Coinbasecartel(30%), Everest(23%), Cl0p(20%), and Nightspire(13%) showed the highest focus on this industry out of gangs with a higher number of victims, suggesting a high focus.
Overall, IT is a frequent target (<10%) for 18 out of 38 gangs and their affiliates.
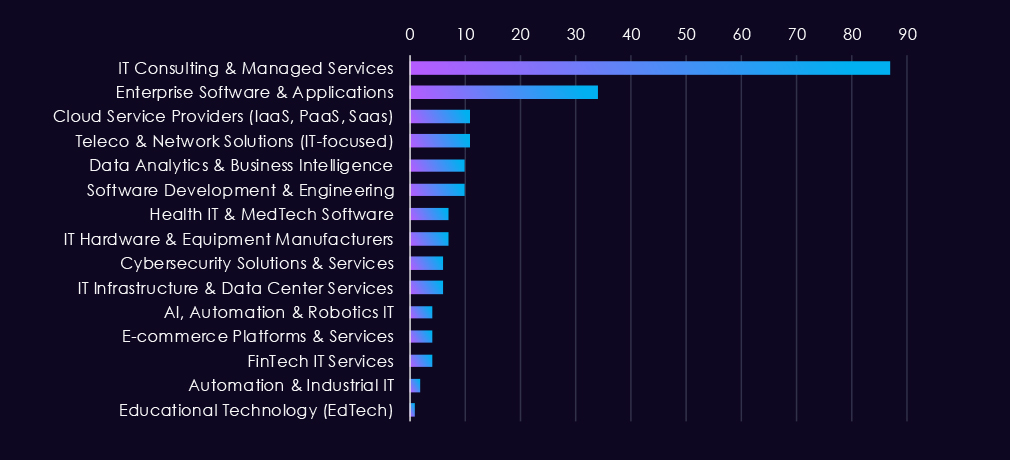
Consulting and managed services firms are disproportionately targeted by ransomware operators due to their privileged access across multiple client environments. Enterprise software vendors represent the second tier, likely due to their ability to impact large user bases. Cloud providers, telecom firms, and data analytics platforms follow. Remaining sectors see comparatively limited activity, either presenting lower attack ROI or receiving less public reporting.
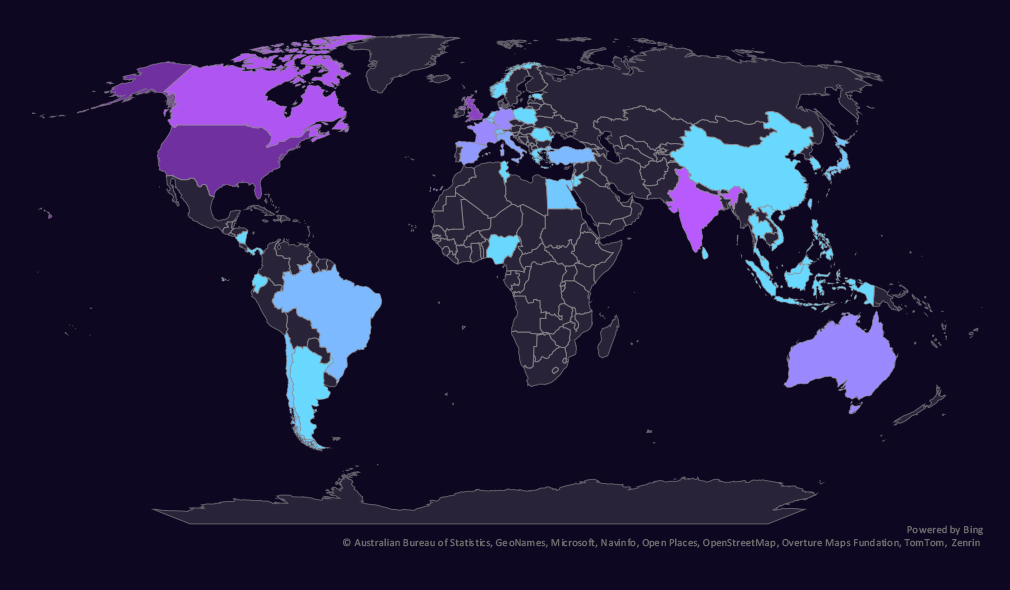
The geographic distribution heatmap underscores the widespread impact of ransomware, highlighting the countries where victims in this industry have been recorded.
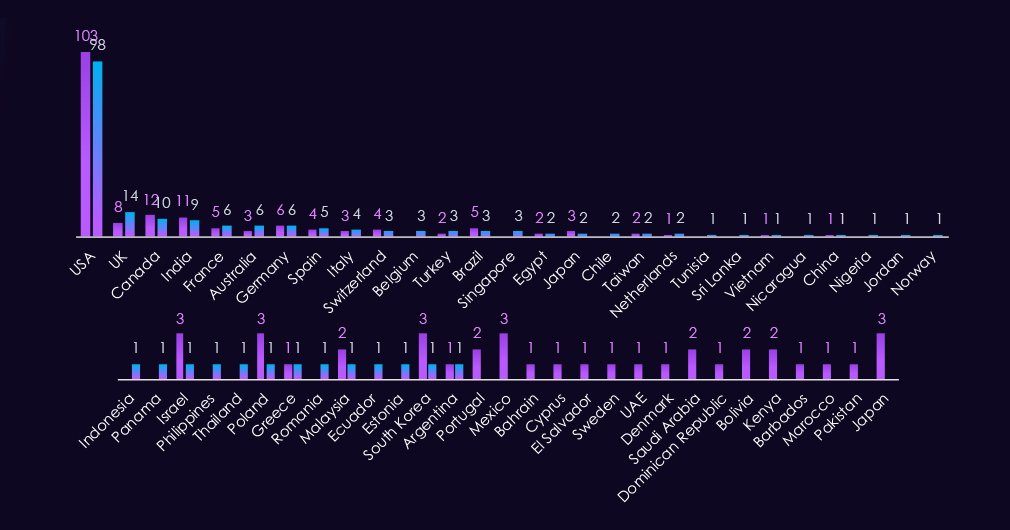
Information technology victimology shows sustained interest in the USA. The UK, Australia, Singapore, Belgium, and Chile recorded the highest elevations.
Japan and Mexico, on the other hand, experienced the largest declines.
In the last 90 days, 40 countries recorded information technology industry victims. Slightly more than 38 countries in the previous period.
Overall, around half of the victims are based in the US, and the second half is relatively highly distributed.
Risk Level Indicator: High

The information technology industry ranked 4th out of 14 monitored industries, recording 205 victims in the last 90 days. Very close to 209 in the previous period.
Overall share declined slightly from 10.20% to 9.36% of all ransomware victims.
The IT industry, especially consulting and managed services, has become a frequent target as they hold access to its clients’ systems and presents an opportunity to breach many other companies and organizations if compromised.
Monthly Activity Trends
Despite both quarters recording nearly the same number of victims, their monthly activity profiles differ. The previous quarter saw growth from an August dip to a high October peak, while the last period was nearly flat, with sustained victim numbers.
Ransomware Gangs
A total of 38 out of 67 active ransomware groups targeted this industry in the past 90 days. That is 57% participation.
Qilin: Continuously the most active gang with 382 victims across industries in the last 90 days. 31 were from this industry (8.1%).
Coinbasecartel: Highest share (30%) among gangs with a high number of victims, suggesting a high focus on this industry.
Everest, Cl0p, and Nightspire: Recording 23%, 20%, and 13% of their victims from IT sectors, implying that it is one of their industries of interest.
Geographic Distribution
The geographic distribution of ransomware victims is relatively high, and spread across 40 countries, just slightly up from 38 in the previous period.
The USA records sustained high numbers, nearly half of all victims. The UK, Australia, Singapore, Belgium, and Chile saw the highest elevations. Japan and Mexico, on the other hand, experienced the sharpest decline.
For a comprehensive, up-to-date global ransomware tracking report, please refer to our new monthly “Tracking Ransomware” series here.
APT Campaigns (High): The IT sector remains a primary target for state-sponsored espionage, with 60% of observed APT campaigns recording victims in the industry. Chinese-linked actors dominate, with North Korean, Iranian, and Russian actors also present. Targeting is concentrated in Asia-Pacific and weighted toward web applications, databases, and network infrastructure — consistent with long-term access and intelligence collection objectives rather than opportunistic intrusion.
Reported Cyber Incidents (High): The IT sector ranked first across all industries, accounting for 28% of all reported incidents. Exploitation and supply chain attacks dominated the period, with supply chain incidents surging in February in a pattern suggesting coordinated campaigns. North Korea was the most frequently attributed attacker. Low geographic victim attribution reflects the sector’s nature — targets are defined by product or service, making IT companies effective vectors for downstream compromise.
Underground & Dark Web Chatter (High): IT accounted for 16% of all detected underground activity, ranking second. Breach and leak volumes remain high despite a declining trend. The sharpest signal is a near-fourfold surge in hacktivist mentions in the final period, likely tied to geopolitical tensions. Ransomware chatter continued declining, consistent with gang restructuring and shifting monetization strategies.
Vulnerabilities (High): The IT sector accounted for over 40% of all industry-linked vulnerability disclosures, ranking first. RCE vulnerabilities more than doubled in the final period to 286 — the most direct and severe trend this quarter. Injection, XSS, privilege escalation, and DoS vulnerabilities all trended upward, indicating a broadening attack surface. Application-layer and execution-level exposures are the primary risk drivers.
Ransomware (High): 205 victims over the period, nearly flat against the prior period’s 209, with overall share declining slightly. Consulting and managed services remain the most attractive sub-sector due to cascading access to client environments. Qilin was the most active gang; Coinbasecartel’s 30% sector concentration marks it as a notably focused actor. The US accounted for nearly half of all victims. Sustained victim counts despite declining dark web chatter suggest active operations are increasingly insulated from public discussion.