
The CYFIRMA Industry Report delivers original cybersecurity insights and telemetry-driven statistics of global industries, covering one sector each week for a quarter. This report focuses on the telecommunications & media organizations, presenting key trends and statistics in an engaging infographic format.
Welcome to the CYFIRMA infographic industry report, where we delve into the external threat landscape of the telecommunications & media industry over the past three months. This report provides valuable insights and data-driven statistics, delivering a concise analysis of attack campaigns, phishing telemetry, and ransomware incidents targeting the telecommunications & media organizations.
We aim to present an industry-specific overview in a convenient, engaging, and informative format. Leveraging our cutting-edge platform telemetry and the expertise of our analysts, we bring you actionable intelligence to stay ahead in the cybersecurity landscape.
CYFIRMA delivers pre-emptive cybersecurity, cyber threat intelligence, and external threat landscape management through its platforms, DeCYFIR and DeTCT. These platforms have been purpose-built over many years to continuously collect, correlate, and analyse large volumes of external threat data, combining proprietary intelligence automation with deep, hands-on cyber threat research.
For the purpose of this report, the analysis draws on intelligence generated from CYFIRMA’s platforms. The data referenced has been processed through automated correlation and enrichment mechanisms, informed and validated by human-led research and investigative expertise, and sourced from both structured and unstructured external intelligence channels.
While this report contains data collected and processed by our in-house AI and ML, all charts, statistics, and analyses are done by human CYFIRMA CTI analysts to ensure the highest quality and provide accurate insights.
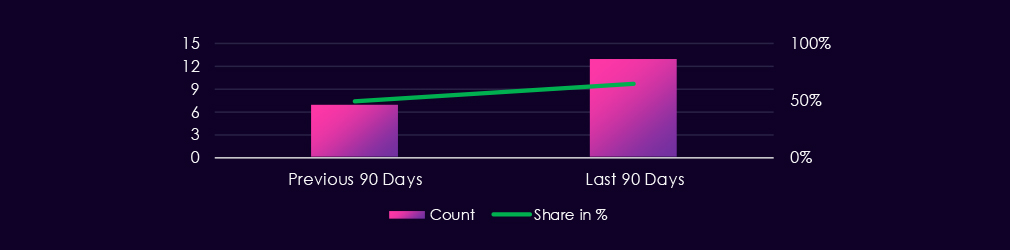
The telecommunications & media industry featured in 13 out of the 20 observed campaigns, which is a presence in 65% of all campaigns. This is an increase from the previous period, where telecommunications & media organizations were present in 7 out of 14 campaigns (50% presence).

2 of the observed campaigns were detected in December, followed by a large number of campaigns observed or updated in January. February then observed lower detections. March so far has not seen new or updated campaigns.
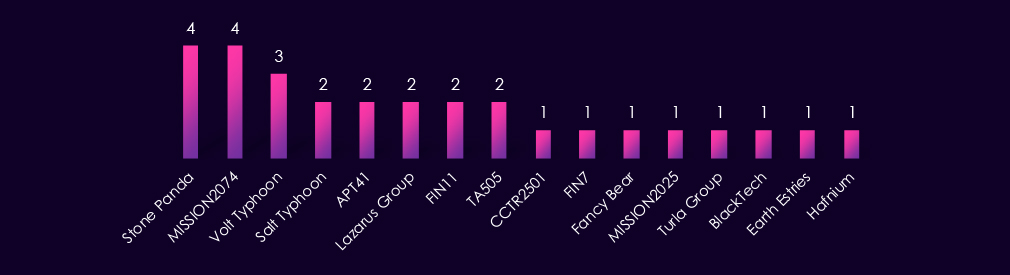
Observed APT campaigns are dominated by suspected China-linked, state-sponsored actors. Stone Panda and MISSION2074 account for the highest number of observed campaigns, followed by Volt Typhoon, Salt Typhoon, and APT41, with additional China-aligned representation including BlackTech, Earth Estries, and Hafnium.
Other state-linked actors are also present, including North Korea-associated Lazarus Group and Russia-linked groups such as Fancy Bear and Turla Group. Financially motivated actors, including FIN11, FIN7, and TA505, are also present, while CCTR2501 represents a Turkish-speaking cybercriminal group.
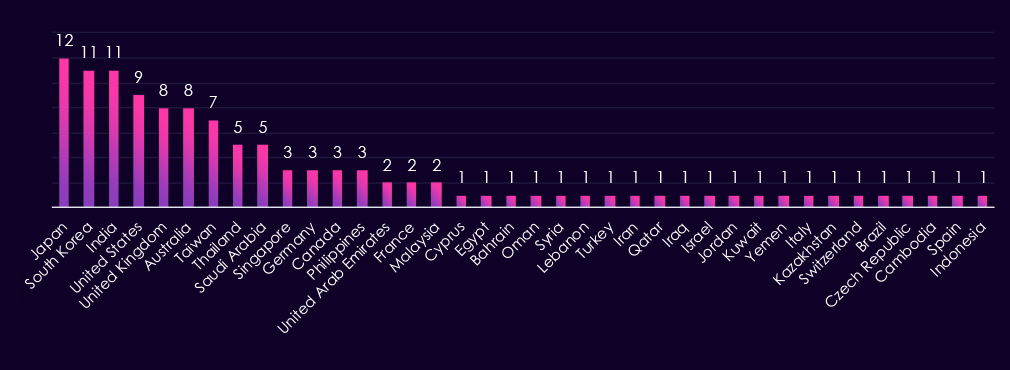
Victim organizations identified in observed telecommunications and media sector campaigns over the last 90 days are distributed globally, with the highest concentrations in Asia-Pacific and major Western economies. Japan appears most frequently, followed by South Korea and India, with sustained activity also observed in the United States, the United Kingdom, Australia, and Taiwan.
This geographic distribution aligns with the predominance of suspected China-linked, state-sponsored actors observed in the same campaigns, which historically focus on telecommunications infrastructure and related information environments across Asia-Pacific and allied nations.
Additional lower-count observations across Europe, Southeast Asia, and the Middle East – including multiple countries across the Gulf region – indicate broad campaign reach rather than geographically confined targeting.
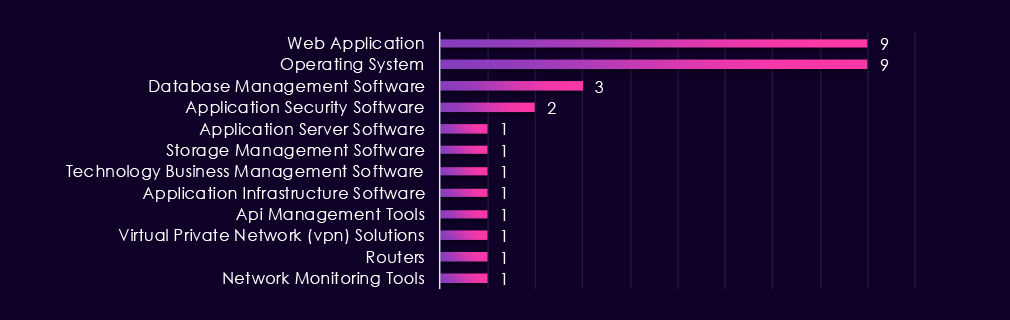
Targeted technologies in observed telecommunications and media sector campaigns are concentrated on web applications and operating systems, which account for the majority of identified cases. This pattern aligns with the tradecraft commonly associated with the predominantly state-sponsored threat actors observed in these campaigns, particularly suspected China-linked groups, which frequently prioritize externally exposed services and core enterprise platforms for initial access and follow-on activity.
Other technologies, including database platforms, application security tools, application servers, and various enterprise infrastructure and network technologies, appear in fewer campaigns, indicating varied intrusion paths rather than reliance on sector-specific telecommunications systems.
Risk Level Indicator: High

Over the past 90 days, the telecommunications & media industry has been significantly impacted by advanced persistent threat (APT) campaigns.
13 out of 20 observed APT campaigns recorded victims in this industry. That is 65% presence in observed campaigns.
That is an increase from the previous 90-day period, during which 7 out of 15 campaigns targeted this industry. The overall share also grew from the previous 50%.
Monthly Trends
Two of the observed campaigns were detected in December, followed by a high number of campaigns observed or updated in January. February saw a decrease in detections. As of March, no new or updated campaigns have been observed.
Key Threat Actors
Campaigns show a strong concentration of suspected China-linked threat actors, with additional representation from Russian- and North Korean-associated groups. Financially motivated actors are also present but appear in fewer campaigns, indicating that observed activity is primarily driven by strategic intelligence or infrastructure-focused objectives rather than direct monetization.
Geographical Impact
Victims were identified across a wide geographic range. Japan, South Korea, and India recorded the most victims, followed by the United States, the United Kingdom, Australia, and Taiwan.
Additional cases across Europe, Southeast Asia, and the Middle East underscore the global reach of APT campaigns.
Targeted Technologies
Observed targeting is weighted toward web applications and operating systems, while other enterprise and infrastructure technologies appear across fewer campaigns. The distribution suggests flexible intrusion approaches rather than concentration on a specific technology class.
Over the past three months, CYFIRMA’s telemetry has identified 8,278 mentions of the telecommunications & media industry out of a total of 66,055 industry-linked mentions. This is from a total of 300k+ posts across various underground and dark web channels and forums.
The telecommunications & media industry placed 3rd out of 14 industries in the last 90 days, with a share of 12.53% of all detected industry-linked chatter.
Below is a breakdown by 30-day periods of all mentions.
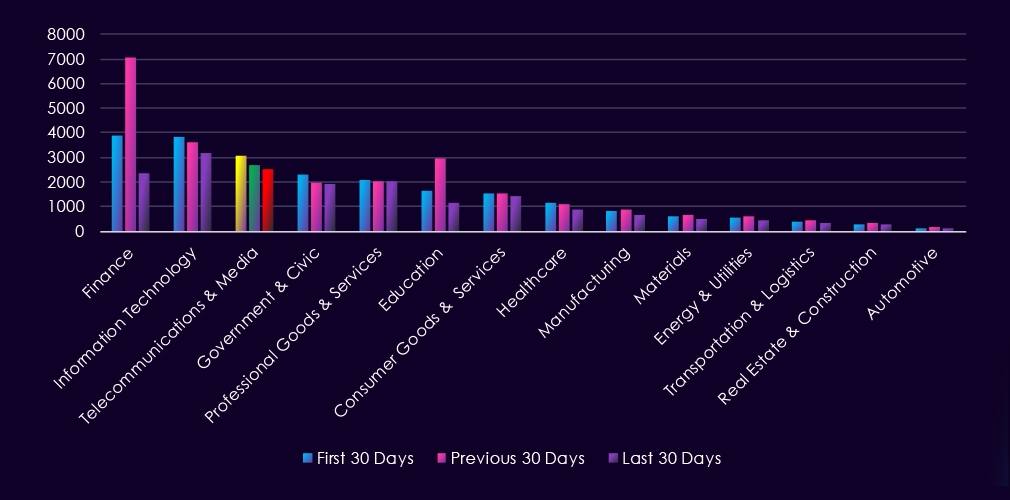
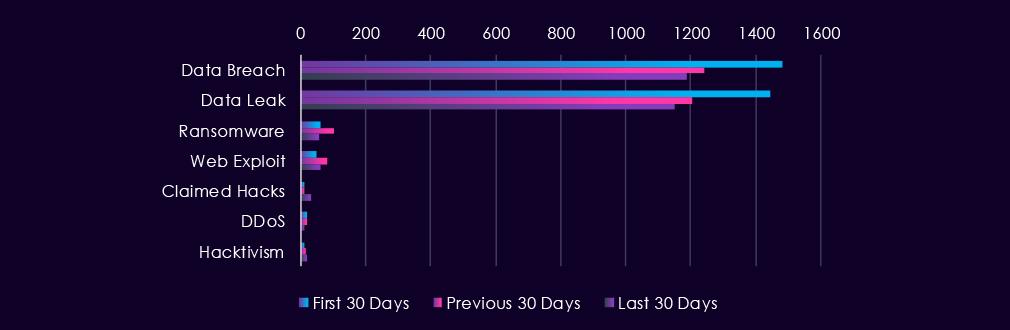
Underground & dark web chatter related to the telecommunications & media sector over the last 90 days is dominated by data breach and data leak discussions, which remain consistently elevated across all three 30-day periods.
Ransomware and web exploit mentions appear at substantially lower levels and fluctuate across periods. Claimed hacks increase notably in the most recent period, while DDoS and hacktivism activity remain comparatively limited but variable.
Risk Level Indicator: High

In total, the telecommunications & media industry comprise 12.53% of all detected industry underground and dark web chatter in the last 90 days. And ranking 3rd out of 14 industries. Below are observed key trends across 90 days:
Data Breach
1483 → 1242 → 1187, Very high but gradually declining. Telecommunications & media remain major targets due to subscriber data and network access, though the downward trend suggests fewer newly surfaced large-scale compromises.
Data Leak
1443 → 1203 → 1151, Mirrors the breach trend with steady decline. Indicates continued circulation of telco and media-related data, such as subscriber information and credentials, although leak postings are slightly less frequent.
Ransomware
62 → 101 → 58, Spike in the middle period followed by a drop. Ransomware targeting is choppy rather than sustained in this sector, potentially due to evolving changes of active gangs.
Web Exploit
47 → 83 → 61, Increased activity mid-period with a slight decline recently. Reflects ongoing probing of telecom web portals, media or subscriber platforms, and media distribution systems.
Claimed Hacks
13 → 10 → 33, Significant increase in the latest period. This surge suggests a recent wave of publicly claimed intrusions or access sales involving telecom or media entities.
DDoS
19 → 21 → 13, Stable initially with a noticeable decline. Indicates reduced emphasis on disruption-based attacks compared to data-focused threats.
Hacktivism
13 → 14 → 21, Gradual rise. Suggests increasing ideological targeting of telecommunications and media infrastructure, often linked to geopolitical narratives or information influence operations.
Over the past three months, CYFIRMA’s telemetry has identified 393 mentions of the telecommunications & media industry, out of a total of 3,101 industry mentions. This is from over 10k CVEs reported and updated in the last 90 days.
The telecommunications & media industry ranked 2nd out of 14 industries in the last 90 days, with a share of 12.67% of all detected industry-linked vulnerabilities.
Below is a breakdown by 30-day periods of all mentions.
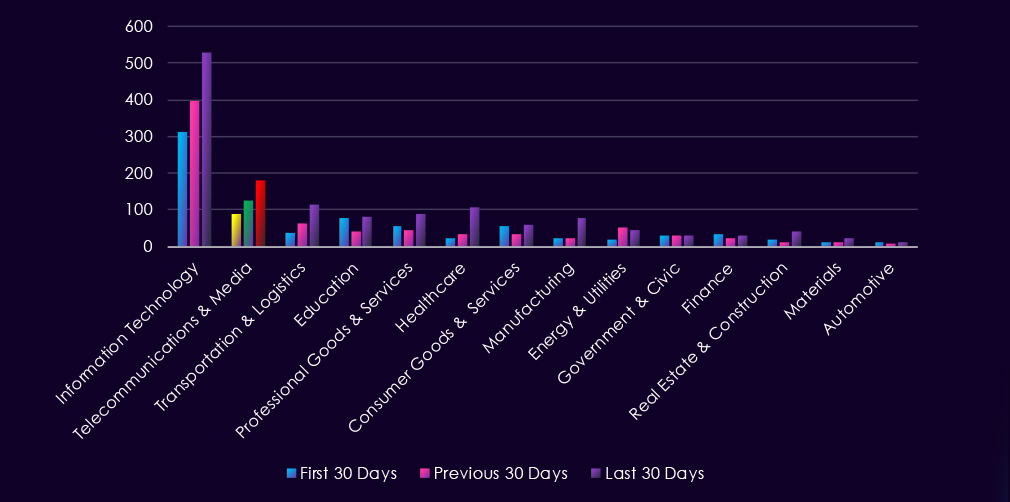
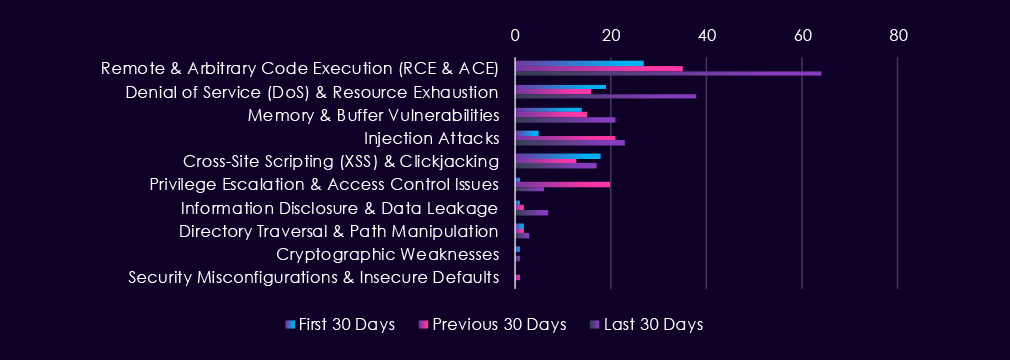
CVEs are dominated by remote & arbitrary code execution vulnerabilities, which have increased significantly in the past 30 days. Denial-of-service issues and memory-related weaknesses remain prominent. Injection vulnerabilities have risen after lower counts earlier in the period, while cross-site scripting remains consistent. Privilege escalation, information disclosure, and directory traversal appear at lower levels. The vulnerability profile is leaning toward high-impact execution and service-disruption weaknesses affecting externally exposed platforms.
Risk Level Indicator: High

In total, the telecommunications & media industry comprise of 12.67% of all detected industry-linked vulnerabilities in the last 90 days, ranking 2nd out of 14 industries. Below are the observed key trends across 90 days:
Remote & Arbitrary Code Execution (RCE & ACE)
27 → 35 → 64, Strong upward trajectory with a sharp increase in the latest period. This indicates growing discovery of high-impact vulnerabilities affecting telecom infrastructure, network appliances, and media distribution platforms.
Denial of Service (DoS) & Resource Exhaustion
19 → 16 → 38, Slight dip followed by a significant surge. The latest spike suggests heightened researcher attention to availability risks in telecom systems where service disruptions could affect large user bases.
Memory & Buffer Vulnerabilities
14 → 15 → 21, Gradual and consistent increase. Reflects continued discovery of lower-level issues in firmware, embedded systems, and network components widely used in telecommunications environments.
Injection Attacks
5 → 21 → 23, Major increase beginning in the middle period and remaining elevated. Suggests concentrated research on telecom web services, APIs, and backend management interfaces.
Cross-Site Scripting (XSS) & Clickjacking
18 → 13 → 17, Fluctuating but consistently present. Indicates ongoing identification of client-side vulnerabilities in subscriber portals, content management systems, and media platforms.
Privilege Escalation & Access Control Issues
1 → 20 → 6, Sharp spike followed by decline, but still above initial levels. Suggests a wave of discoveries related to authentication and role management in telecom software stacks.
Information Disclosure & Data Leakage
1 → 2 → 7, Gradual increase. Indicates growing identification of vulnerabilities that could expose configuration data, subscriber information, or internal system details.
Directory Traversal & Path Manipulation
2 → 2 → 3, Low but stable with a slight rise. These findings typically relate to file-handling weaknesses in telecom management tools.
Cryptographic Weaknesses
1 → 0 → 1, Rare and sporadic. When present, these vulnerabilities may affect encryption implementations or certificate handling in telecom systems.
Security Misconfigurations & Insecure Defaults
0 → 1 → 0, Minimal and inconsistent. Indicates isolated findings rather than a recurring issue.
In the past 90 days, CYFIRMA has identified 63 verified ransomware victims in the telecommunications & media industry. This accounts for 2.91% of all 2,166 ransomware victims during the same period, placing the telecommunications & media industry 11th out of 14 industries.
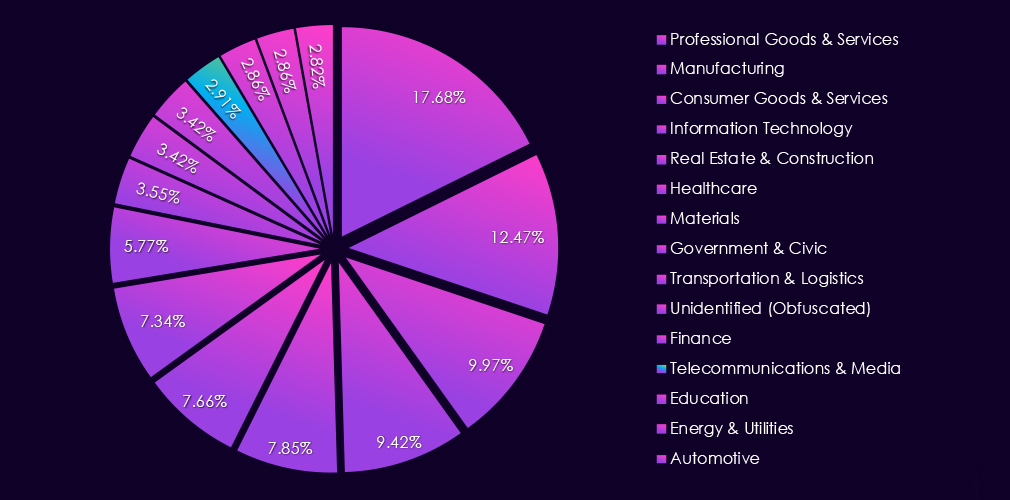
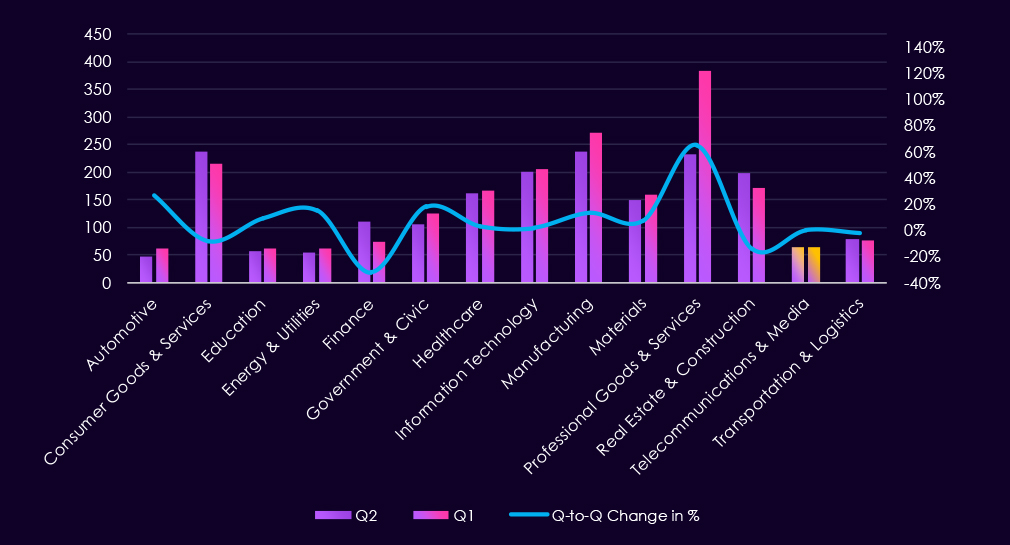
Furthermore, a quarterly comparison shows that interest in telecommunications & media organizations remained remarkably stable. There was no change from 63 to 63 victims in both last quarters. The overall share declined mildly from 3.17% to 2.91% of all victims.
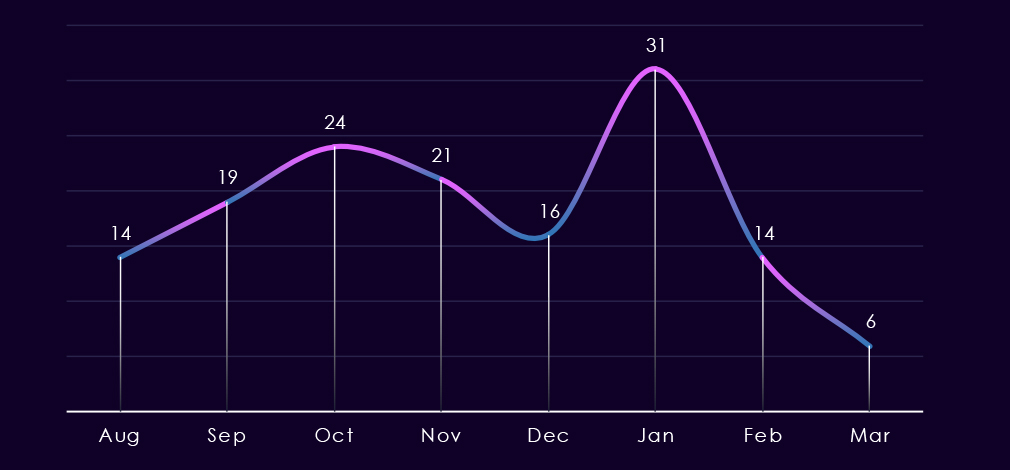
The monthly trendline shows us that despite both quarters recording the same number of victims, the monthly activity was very different in each quarter. While the previous quarter showed gradual growth towards the October peak, the last period recorded sharp changes from a dip to a high spike and returned to low numbers again.
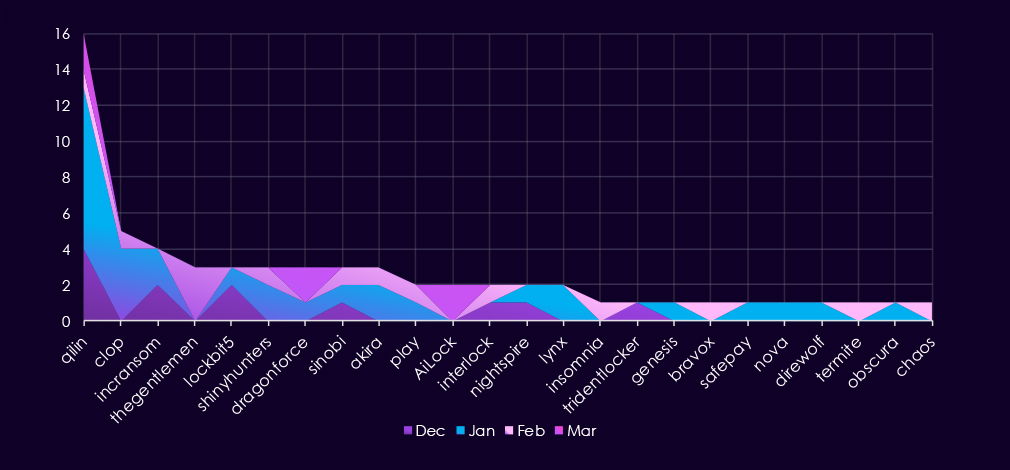
A breakdown of monthly activity per gang reveals which gangs were most active each month. For instance, the most active group, Qilin, recorded victims every month, but after high volume in January, it recorded only one victim in February.
On the other hand, groups like Thegentlemen, Clop, and AiLock recorded most or all of their victims during a single month. Overall, we can see that the January spike was driven by Qilin and a number of smaller gangs, not by a single major event.
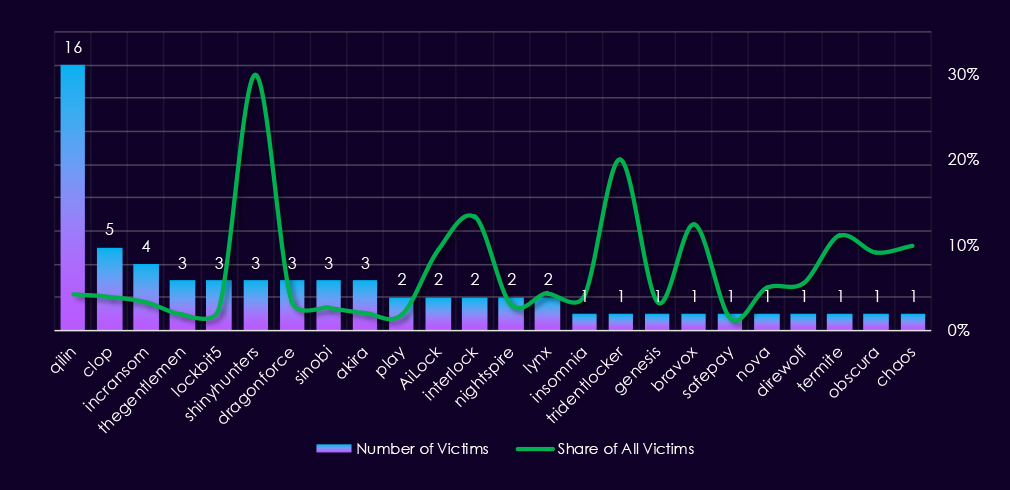
Out of the 67 gangs, 24 recorded victims in the telecommunications & media industry in the last 90 days, representing a 36% participation.
Qilin had the highest number of victims and 4.2% share out of all their 382 victims in the telecommunications & media industry.
Shinyhunters(30%) and Interlock(13%) showed the highest focus on this industry out of gangs with more than one victim.
Overall, telcos & media are not a frequent target (<10%) for most gangs and their affiliates.

Advertising and media agencies, followed by digital media and content platforms and publishing organizations, are the most frequent victims of ransomware. Film, television, and audio production studios and broadcasting entities also experience ransomware attacks.
Telecommunications infrastructure and service providers, including internet service providers, mobile network operators, and telecom infrastructure companies, are less frequently targeted.
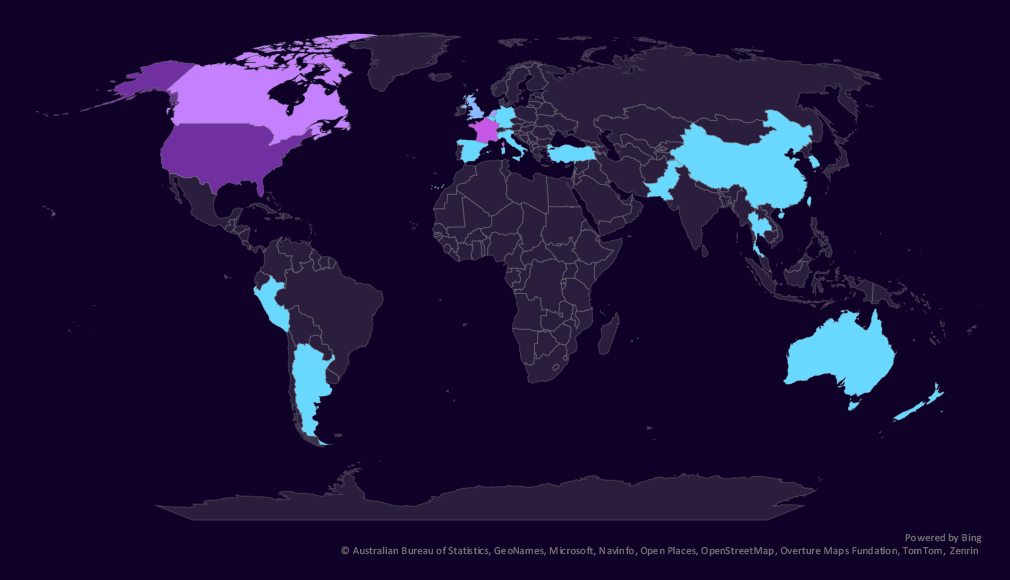
The geographic distribution heatmap underscores the widespread impact of ransomware, highlighting the countries where victims in this industry have been recorded.
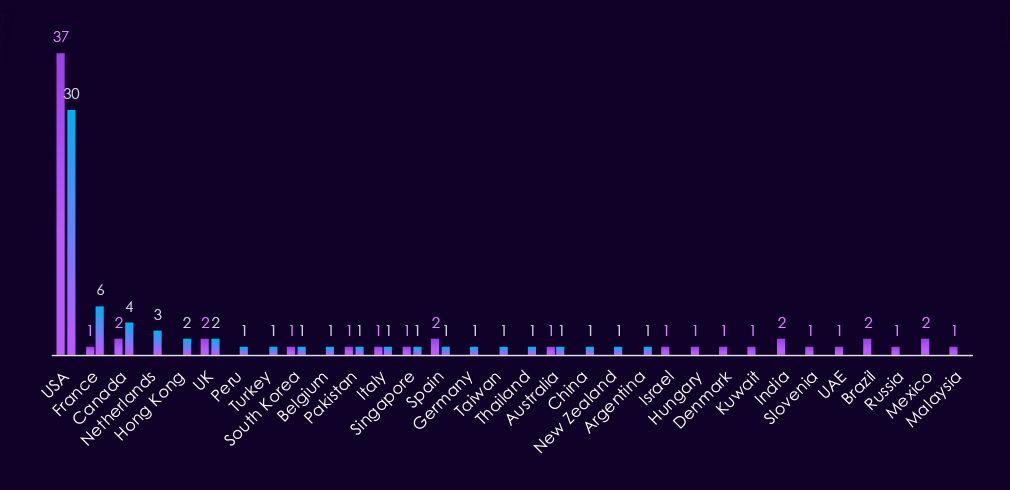
Telecommunications & media victimology shows a minor decline of interest in the USA. France, Canada, and the Netherlands recorded the highest elevations.
India, Brazil, and Mexico, on the other hand, have the largest declines.
In the last 90 days, 21 countries recorded telecommunications & media industry victims, the same as the previous period.
Overall, activity is mostly concentrated in a handful of countries.
Risk Level Indicator: Low

The telecommunications & media industry ranked 11th out of 14 monitored industries, recording 63 victims in the last 90 days, the same number of victims as in the previous 90-day period.
Overall share declined mildly from 3.17% to 2.91% of all ransomware victims.
Monthly Activity Trends
Despite both quarters recording the same number of victims, their monthly activity differed significantly. The previous quarter showed steady growth toward an October peak, while the last period fluctuated sharply between dips and a high spike in January.
Ransomware Gangs
A total of 24 out of 67 active ransomware groups targeted this industry in the past 90 days. That is a 36% participation.
Qilin: Continuously the most active gang with 382 victims across industries in the last 90 days. 16 were from this industry (4.2%).
Shinyhunters: Highest share (30%) among gangs with more than one victim. Suggesting a high focus on this industry.
Interlock: Recording 13% of their victims from the telcos & media sector, implying it is one of their industries of interest.
Geographic Distribution
The geographic distribution of ransomware victims is relatively low, and spread across 21 countries, the same as in the previous period.
France, Canada, and the Netherlands saw the highest elevations.
The USA, India, Brazil, and Mexico, on the other hand, saw the sharpest decline.
For a comprehensive, up-to-date global ransomware tracking report, please refer to our new monthly “Tracking Ransomware” series here.
APT Campaigns (High): Telecommunications & media experienced substantial APT activity, with 13 of 20 observed campaigns (65%) impacting the sector – an increase from 7 of 15 (50%) in the previous period. Activity intensified in January, following two campaigns in December, before slowing in February and early March. Observed campaigns were dominated by China-linked state-sponsored actors, with additional involvement from Russian and North Korean groups, indicating strong geopolitical and intelligence-driven interest rather than purely criminal objectives. Victims were distributed globally, with Japan, South Korea, and India recording the highest concentrations, followed by the United States, the United Kingdom, Australia, and Taiwan. Targeting focused mainly on web applications and operating systems, suggesting flexible intrusion paths against externally exposed telecom and media infrastructure.
Underground & Dark Web Chatter (High): The sector accounted for 12.53% of industry chatter, ranking 3rd overall. Although breach and leak discussions declined gradually, activity remained very high due to the value of subscriber data and network access. Ransomware chatter showed volatile patterns, with a spike mid-period followed by a decline. Web exploit activity remained elevated, reflecting continued probing of telecom portals, subscriber services, and media delivery platforms. Claimed hacks surged in the latest period, suggesting a wave of publicly advertised compromises or access sales. Hacktivism activity also increased, highlighting the sector’s continued exposure to ideological or geopolitical campaigns.
Vulnerabilities (High): Telecommunications & media represented 12.67% of industry-linked vulnerabilities, ranking 2nd overall. RCE disclosures rose sharply, highlighting critical weaknesses in telecom infrastructure, network appliances, and media distribution systems. DoS vulnerabilities also surged in the latest period, indicating increased focus on availability risks affecting large user bases. Injection flaws remained elevated, while memory-related vulnerabilities continued to increase gradually, reflecting deeper scrutiny of telecom firmware and embedded network components. Other vulnerability classes remained present but less dominant.
Ransomware (Low): Ransomware impact remained relatively limited compared with other industries, with 63 victims, unchanged from the previous period. Despite identical totals, monthly activity patterns shifted, with the previous quarter showing steady growth while the latest period fluctuated significantly with a January spike. 36% of active ransomware groups targeted the sector. Qilin remained the most active by volume, though its sector focus was limited. Shinyhunters demonstrated the strongest proportional focus on telecom and media victims, while Interlock also showed elevated targeting. Victims were spread across 21 countries, with increases in France, Canada, and the Netherlands, while the United States, India, Brazil, and Mexico saw a decline.