
The CYFIRMA Industry Report delivers original cybersecurity insights and telemetry-driven statistics of global industries, covering one sector each week for a quarter. This report focuses on the materials-producing organizations, presenting key trends and statistics in an engaging infographic format.
Welcome to the CYFIRMA infographic industry report, where we delve into the external threat landscape of the materials industry over the past three months. This report provides valuable insights and data-driven statistics, delivering a concise analysis of attack campaigns, phishing telemetry, and ransomware incidents targeting materials organizations.
We aim to present an industry-specific overview in a convenient, engaging, and informative format. Leveraging our cutting-edge platform telemetry and the expertise of our analysts, we bring you actionable intelligence to stay ahead in the cybersecurity landscape.
CYFIRMA delivers pre-emptive cybersecurity, cyber threat intelligence, and external threat landscape management through its platforms, DeCYFIR and DeTCT. These platforms have been purpose-built over many years to continuously collect, correlate, and analyse large volumes of external threat data, combining proprietary intelligence automation with deep, hands-on cyber threat research.
For the purpose of this report, the analysis draws on intelligence generated from CYFIRMA’s platforms. The data referenced has been processed through automated correlation and enrichment mechanisms, informed and validated by human-led research and investigative expertise, and sourced from both structured and unstructured external intelligence channels.
While this report contains data collected and processed by our in-house AI and ML, all charts, statistics, and analyses are done by human CYFIRMA CTI analysts to ensure the highest quality and provide accurate insights.
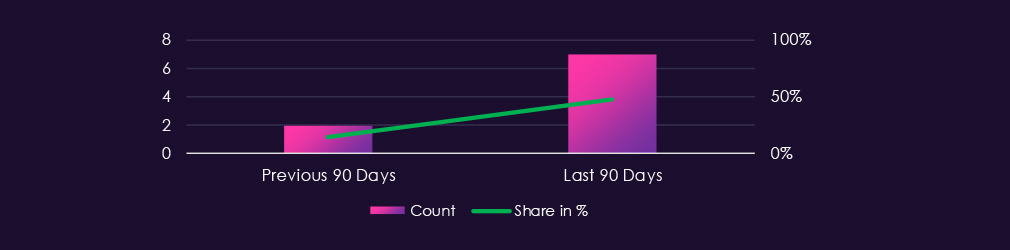
The materials industry featured in 7 out of the 15 observed campaigns, which is a presence in 47% of all campaigns, an increase from the previous period, where the materials industry was present in 2 out of 13 campaigns (15% presence).
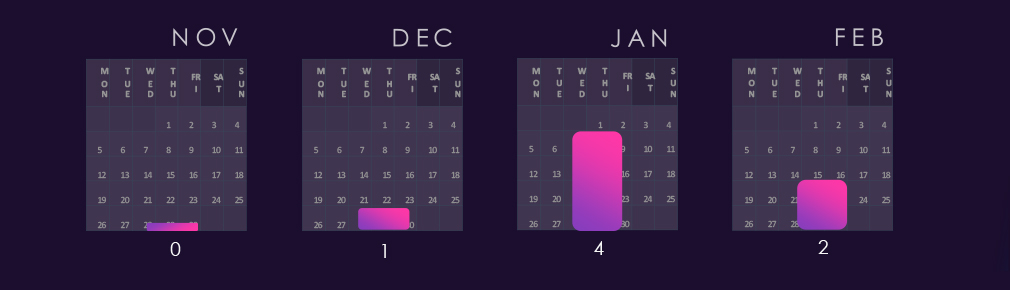
1 of the observed campaigns was detected in December, followed by a large number of campaigns observed or updated in January. February saw 2 campaigns in this industry.
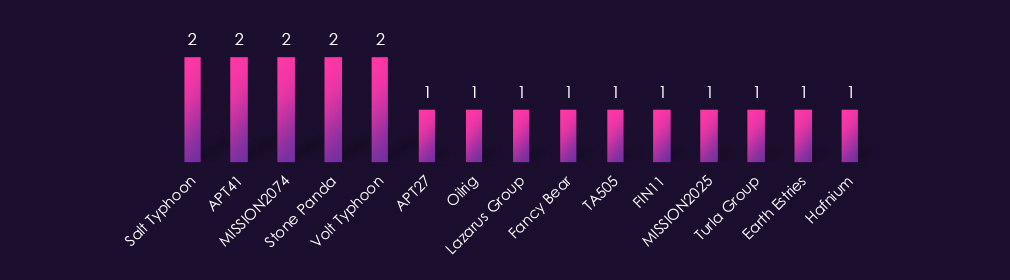
Observed APT campaigns involving materials sector victims are distributed across a broad set of state-sponsored actors, with repeated representation from suspected China-linked groups, including Salt Typhoon, APT41, MISSION2074, Stone Panda, and Volt Typhoon. Additional China-aligned activity includes APT27, Earth Estries, and Hafnium.
Other state-linked actors are also present, including Iran-associated Oilrig, North Korea-associated Lazarus Group, and Russia-linked groups such as Fancy Bear and Turla Group. Financially motivated actors, including TA505 and FIN11, appear in fewer campaigns.
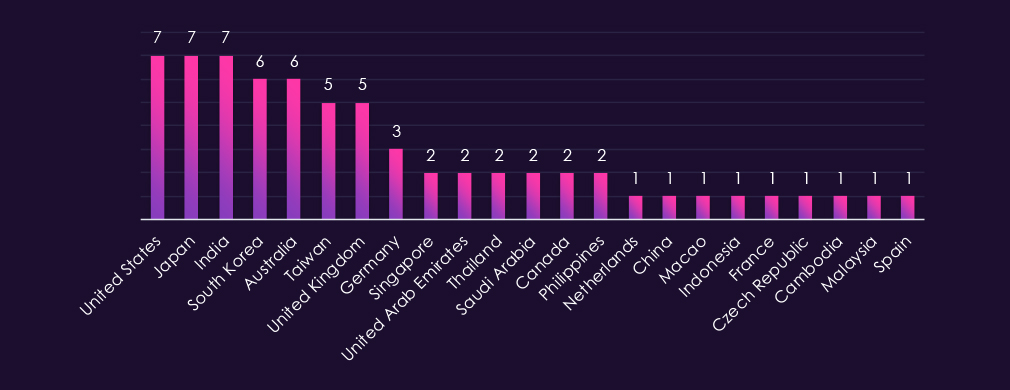
Victim organizations identified in the seven observed campaigns with materials industry victims are distributed globally, with the highest concentrations in the United States, Japan, and India, each appearing across all campaigns. South Korea and Australia also show sustained activity, followed by Taiwan and the United Kingdom.
This distribution indicates consistent cross-regional targeting across Asia-Pacific and major Western economies rather than concentration in a single national market. Additional lower-count observations across Europe, Southeast Asia, and the Middle East further reflect broad campaign reach within globally integrated materials and supply chain ecosystems.
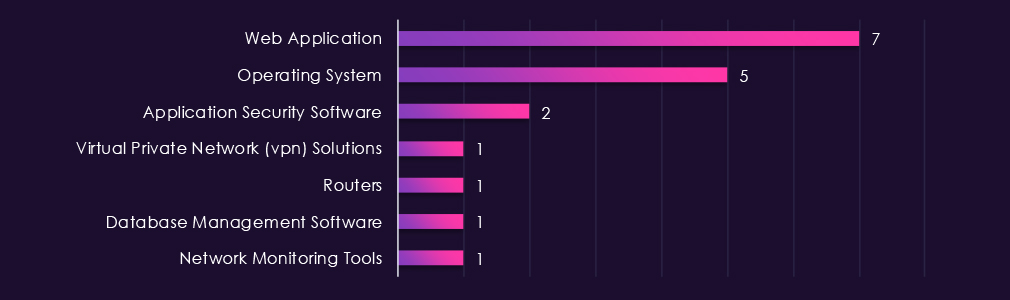
Targeted technologies in observed campaigns are concentrated on web applications and operating systems, which together account for the majority of identified cases across the seven campaigns. This pattern aligns with tradecraft commonly associated with the predominantly state-sponsored threat actors observed in these operations, emphasizing externally exposed services and core enterprise platforms.
Application security software appears in multiple campaigns, while VPN solutions, routers, database platforms, and network monitoring tools are observed in individual cases, indicating varied intrusion paths rather than a focus on specialized industrial systems.
Risk Level Indicator: High

Over the past 90 days, the materials industry has been significantly impacted by advanced persistent threat (APT) campaigns.
7 out of 15 observed APT campaigns recorded victims in this industry. That is 47% presence in observed campaigns.
That is an increase from the previous 90-day period, during which 2 out of 13 campaigns targeted this industry, also growing is the overall share from the previous 15%. Such an increase warrants a high-risk indicator.
Monthly Trends
1 of the campaigns was observed during December, followed by 4 campaigns in very active January. February saw 2 campaigns, suggesting continued interest.
Key Threat Actors
While suspected China-linked actors account for multiple observed campaigns in the materials sector, additional representation from Russian-, Iranian-, and North Korean-linked groups indicates broader geopolitical interest. Financially motivated actors are observed in fewer campaigns, suggesting that activity in this sector is primarily strategic rather than criminally driven.
Geographical Impact
The geographic spread of materials-sector victims aligns with the diverse state-sponsored threat actor profile observed in these campaigns. Concentrated activity in the United States, Japan, India, and South Korea corresponds with regions of strategic industrial capacity, while additional cases across Europe, Southeast Asia, and the Middle East indicate multi-regional campaign scope.
Targeted Technologies
Observed targeting is primarily aimed at web applications and operating systems, with other enterprise and network technologies appearing across fewer campaigns. The distribution reflects flexible intrusion approaches rather than concentration on sector-specific technologies.
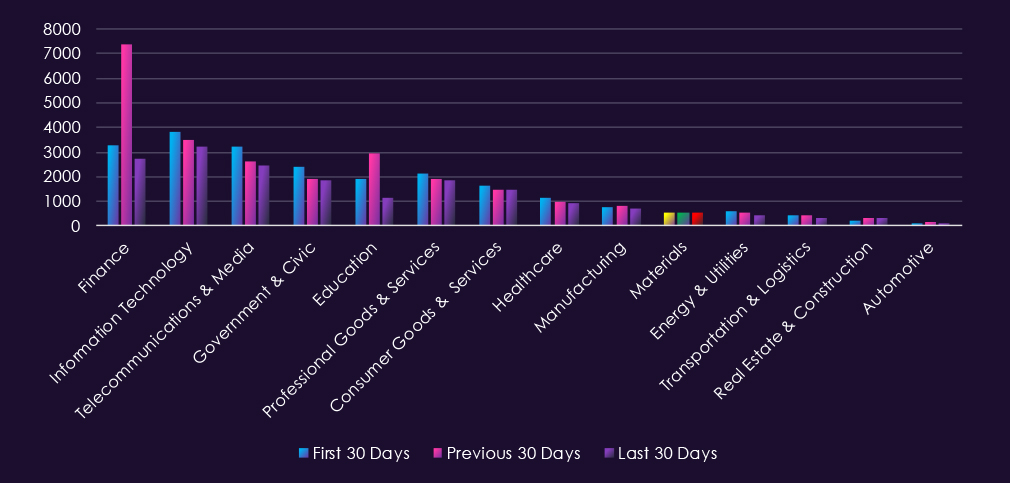
Over the past three months, CYFIRMA’s telemetry has identified 1,606 mentions of the materials industry out of a total of 65,793 industry-linked mentions. This is from a total of 300k+ posts across various underground and dark web channels and forums.
The materials industry placed 10th out of 14 industries in the last 90 days, with a share of 2.44% of all detected industry-linked chatter.
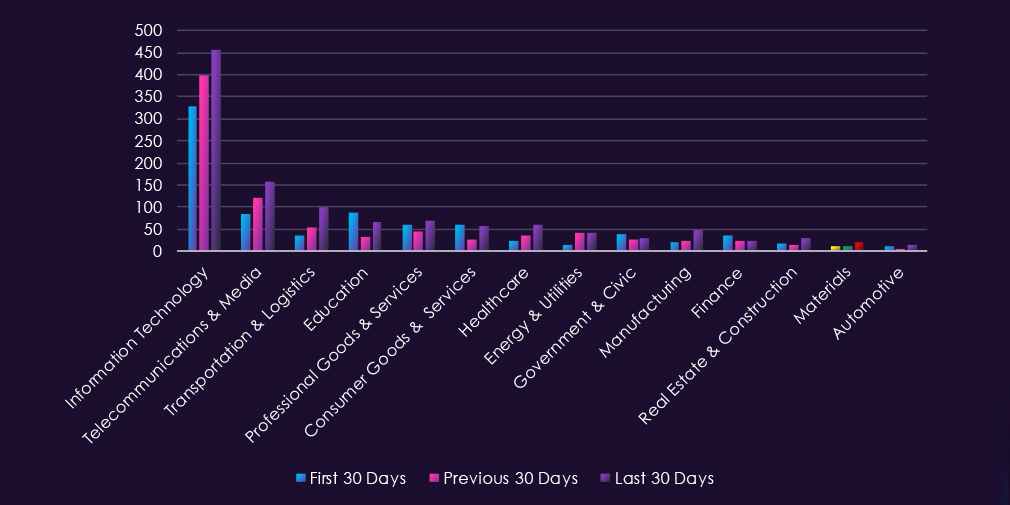
Below is a breakdown by 30-day periods of all mentions.
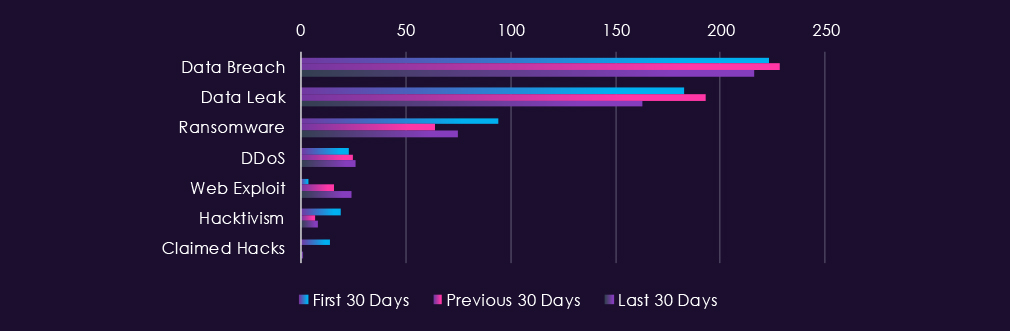
Chatter is led by data breach and data leak discussions, which remain consistently elevated across all three 30-day periods. Ransomware activity fluctuates but remains secondary to breach-related conversations.
DDoS mentions remain steady at moderate levels, while web exploit discussions increase in the most recent period. Hacktivism and claimed hack activity remain comparatively limited and variable across periods.
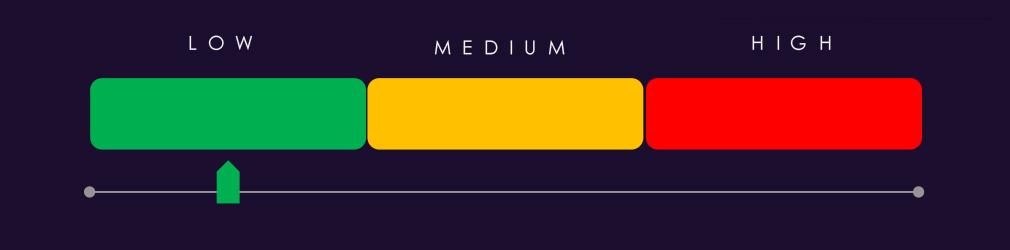
Risk Level Indicator: Low

In total, the materials industry comprise 2.44% of all detected industry underground and dark web chatter in the last 90 days, ranking 10th out of 14 industries.
Below are observed key trends across 90 days:
Data Breach
223 → 228 → 216, Consistently high and relatively stable. Materials companies remain steady targets, likely due to supply chain positioning, proprietary formulas, and integration with manufacturing and energy sectors.
Data Leak
183 → 193 → 163, Slight mid-period increase followed by a decline. While still elevated, leak discussions have tapered, suggesting fewer large-scale public data postings or a shift toward private monetization channels.
Ransomware
94 → 64 → 75, Decline followed by a moderate rebound. Ransomware remains a meaningful but secondary threat compared to breach-related activity, reflecting the sector’s operational leverage for extortion.
DDoS
23 → 25 → 26, Gradual increase and stable at moderate levels. Indicates consistent disruption-focused activity, though not at escalated levels.
Web Exploit
4 → 16 → 24, Clear upward trend. Suggests increasing exploitation attempts against web-facing materials-sector assets, potentially including supplier portals and industrial monitoring systems.
Hacktivism
19 → 7 → 8, Sharp drop after the first period with minor stabilization. Ideologically motivated targeting appears limited and inconsistent.
Claimed Hacks
14 → 0 → 1, Significant early activity followed by near absence. Indicates fewer publicly advertised compromises in recent periods, possibly reflecting quieter access sales rather than overt claims.
Over the past three months, CYFIRMA’s telemetry has identified 44 mentions of the materials industry out of a total of 2,845 industry mentions. This is from over 10k CVEs reported and updated in the last 90 days.
The materials industry ranked 13th out of 14 industries in the last 90 days, with a share of 1.55% of all detected industry-linked vulnerabilities.
Below is a breakdown by 30-day periods of all mentions.
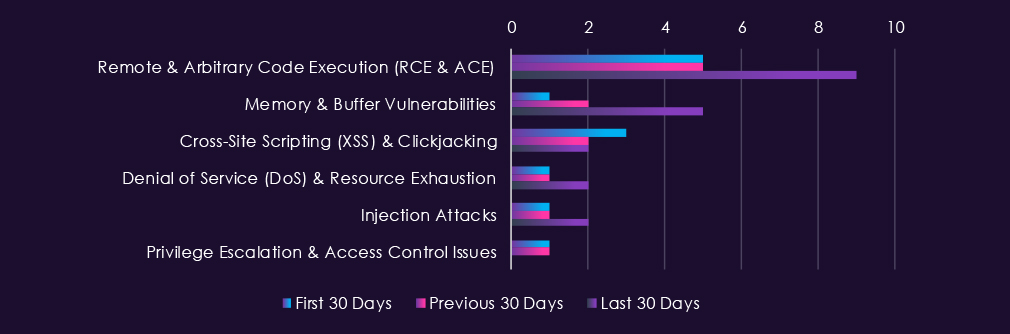
Reported materials-related CVEs over the last 90 days are led by remote and arbitrary code execution vulnerabilities, which have increased in the most recent 30-day period. Memory and buffer-related weaknesses also show a noticeable rise, while cross-site scripting, denial-of-service, and injection vulnerabilities remain present at lower but consistent levels. Privilege escalation issues have declined in the most recent period.
Risk Level Indicator: Low
In total, the materials industry comprise of 1.55% of all detected industry-linked vulnerabilities in the last 90 days, ranking 13th out of 14 industries.
Below are observed key trends across 90 days:
Remote & Arbitrary Code Execution (RCE & ACE)
5 → 5 → 9, Stable initially with a clear increase in the latest period. RCE disclosures are rising, indicating growing identification of high-impact flaws in industrial software, control systems, and supplier-integrated platforms.
Memory & Buffer Vulnerabilities
1 → 2 → 5, Steady upward trend. Suggests increased research attention on lower-level or legacy components common in materials processing and industrial environments.
Cross-Site Scripting (XSS) & Clickjacking
3 → 2 → 2, Slight decline and stabilization. Client-side web vulnerabilities remain present but are not escalating.
Denial of Service (DoS) & Resource Exhaustion
1 → 1 → 2, Low but gradually increasing. Indicates occasional discovery of availability-related weaknesses, which could be significant in production-sensitive environments.
Injection Attacks
1 → 1 → 2, Low and slightly rising. Reflects sporadic identification of input validation issues in materials-sector applications and web portals.
Privilege Escalation & Access Control Issues
1 → 1 → 0, Declining to none in the latest period. Suggests limited recent disclosure of authentication or permission-related weaknesses.
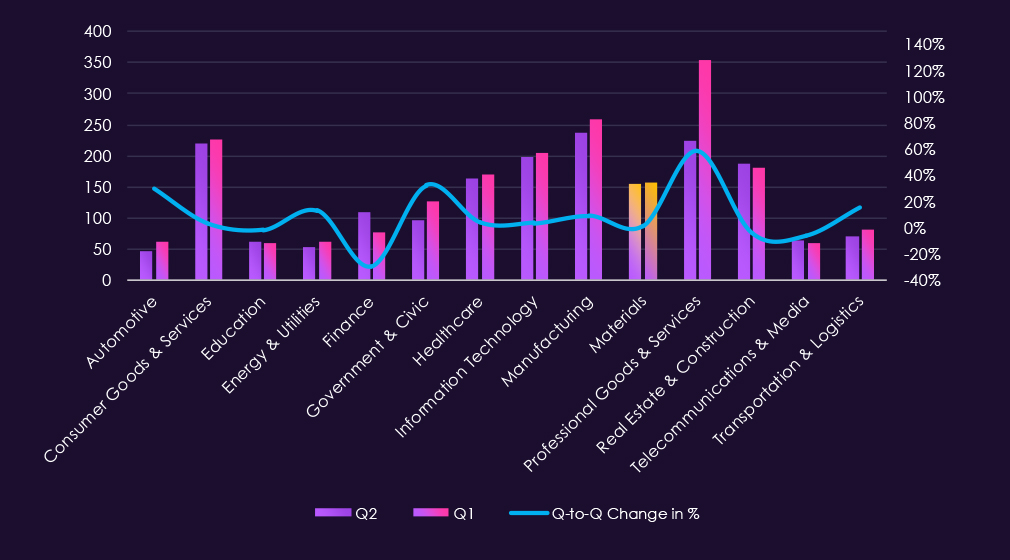
In the past 90 days, CYFIRMA has identified 156 verified ransomware victims in the materials industry. This accounts for 7.24% of all 2,154 ransomware victims during the same period, placing the materials industry 7th out of 14 industries.
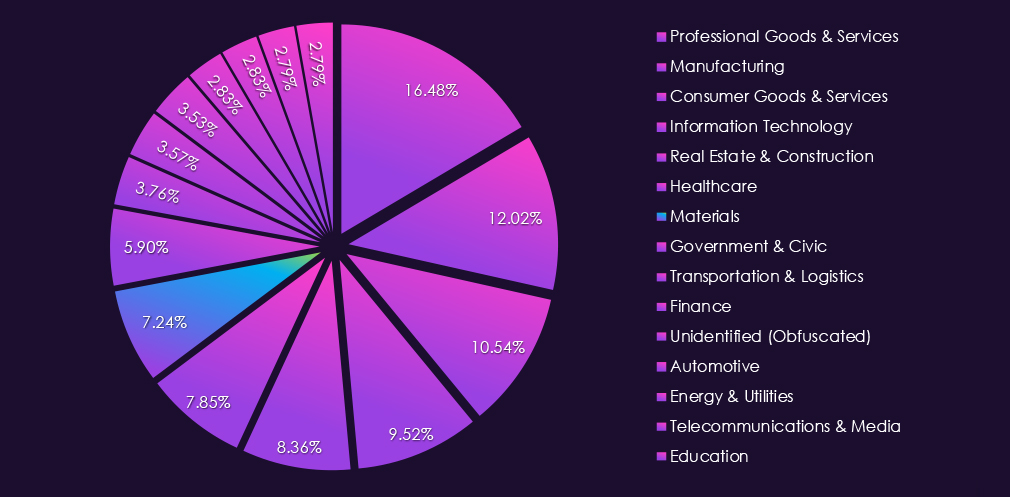
Furthermore, a quarterly comparison shows that interest in the materials industry is sustained. There was only a minimal increase of 1.3% from 154 to 156 victims. The overall share dropped mildly from 7.93% to 7.24% of all victims.
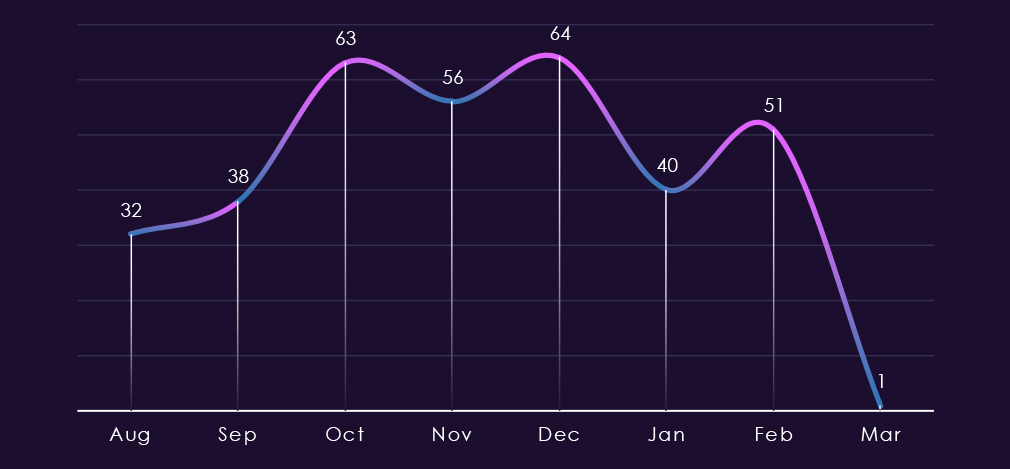
The monthly trendline shows low numbers back in August and September, followed by the months of elevation until a dip in January, only for February to climb back to 51 victims.
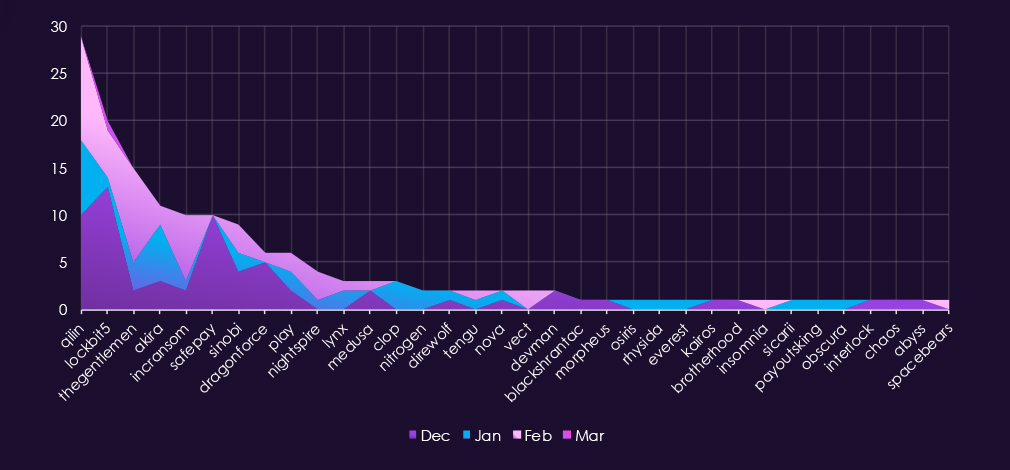
A breakdown of monthly activity per gang reveals which gangs were most active each month. For instance, the most active group, Qilin, recorded victims every month, though fewer in January.
On the other hand, Safepay recorded victims mostly only in December. LockBit5 appeared in December, but due to a leaked database, it was shut down again.
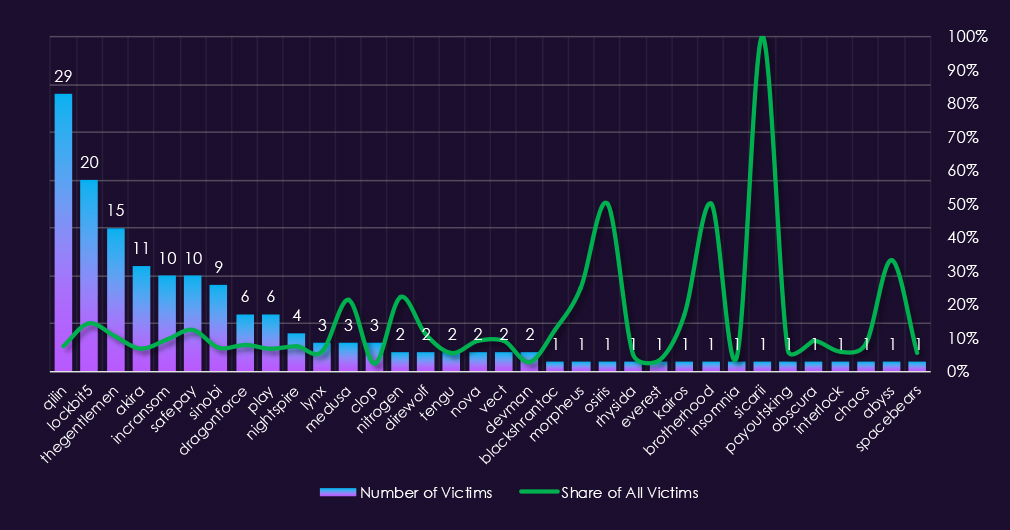
Out of the 70 gangs, 34 recorded victims in the materials industry in the last 90 days, representing a 49% participation.
Qilin had the highest number of victims and 7.5% share out of all their 389 victims in this industry.
LockBit5(15%), Safepay(12%), and Medusa(21%) showed the highest focus on this industry out of gangs with more than two victims.
Overall, the materials industry is a relatively frequent target (<10%) for some gangs and their affiliates.
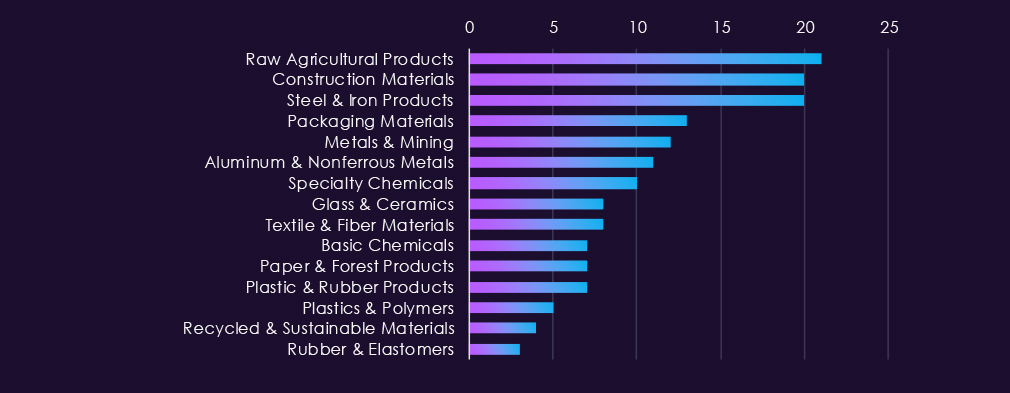
Raw Agricultural Products, Construction materials, and Steel & Iron Production were the most frequent targets of ransomware.
Overall, the victimology in the materials industry is relatively evenly spread across sectors.
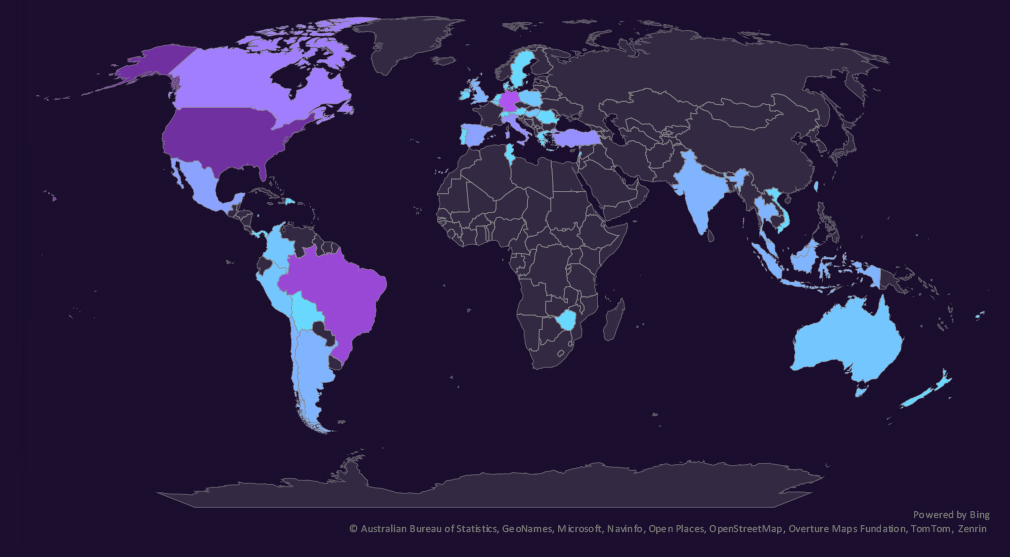
The geographic distribution heatmap underscores the widespread impact of ransomware, highlighting the countries where victims in this industry have been recorded.
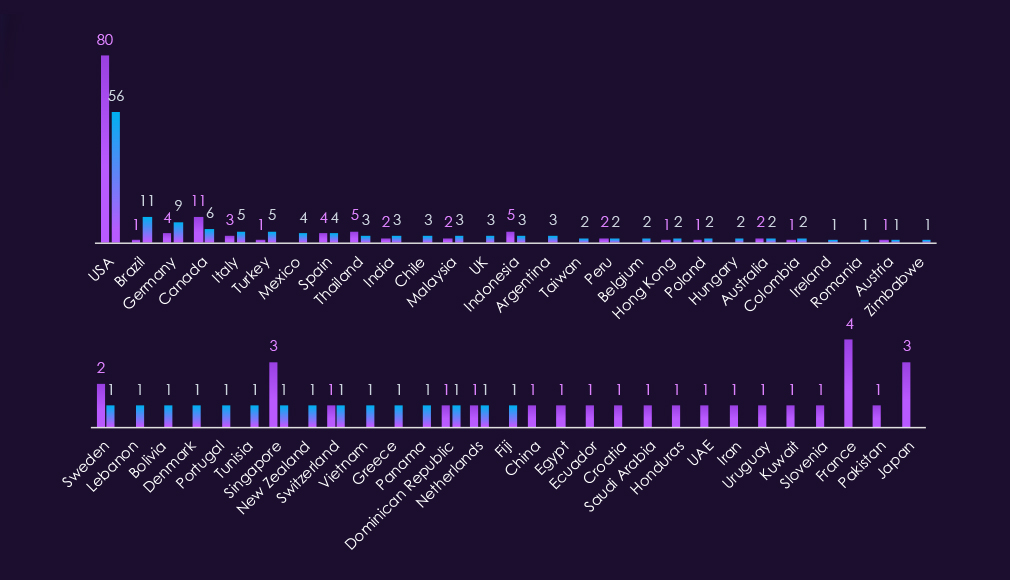
Material victimology shows low interest in the USA, Canada, France, and Japan over the past 90 days.
Brazil, Germany, Turkey, and Mexico, on the other hand, recorded the largest increase.
In the last 90 days, 42 countries recorded materials industry victims, an increase from 36 countries in the previous period.
Risk Level Indicator: High
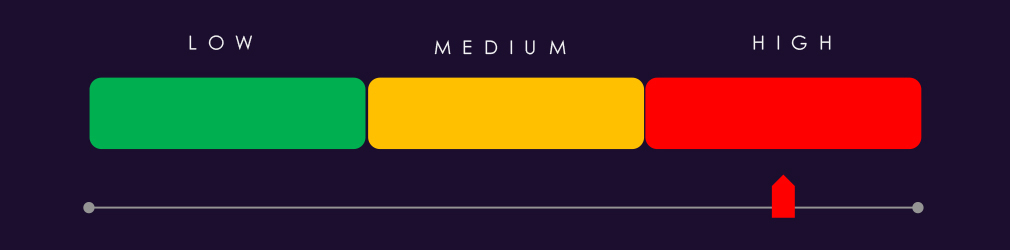
The materials industry ranked 7th out of 14 monitored industries, recording 156 victims in the last 90 days, an elevation of only 1.3% from 154 victims in the previous 90-day period.
Overall share declined from 7.93% to 7.23% of all ransomware victims.
Though the absolute number of victims is not as high as in other industries, given the lower number of companies in this industry and the shift out of the USA targeting, we give the materials industry a high risk level.
Monthly Activity Trends
After relatively low numbers in August and September, numbers jumped and stayed elevated for three months. January recorded a dip, but February jumped back up to the previous elevation.
Ransomware Gangs
A total of 34 out of 70 active ransomware groups targeted this industry in the past 90 days, which is a 49% participation.
Qilin: Continuously the most active gang with 389 victims across industries in the last 90 days, 29 were from the materials industry (7.5%).
Thegentlemen, Safepay: Highest share (10%,12%) among gangs with more than ten victims, showing an elevated focus on this industry.
LockBit5: Recording 20 victims and 15% of their victims from the materials sector; however, after the leak of their database, LockBit5 halted their operation again.
Geographic Distribution
The geographic distribution of ransomware victims is relatively high, and spread across 42 countries, an increase from 36 in the previous period.
Brazil, Germany, Turkey, and Mexico saw the highest elevations.
The USA, Canada, France, and Japan, on the other hand, experienced the sharpest decline.
For a comprehensive, up-to-date global ransomware tracking report, please refer to our new monthly “Tracking Ransomware” series here.
APT Campaigns (High): The Materials Industry experienced a sharp escalation in APT exposure, with 7 of 15 campaigns (47%) impacting the sector – up from 2 of 13 (15%) previously. Activity intensified in January (4 campaigns) following limited December activity, with continued cases in February, indicating sustained interest. While China-linked state-sponsored groups account for multiple campaigns, additional Russian-, Iranian-, and North Korean-linked actors were observed, pointing to broad geopolitical interest rather than purely financial motivation. Victims were concentrated in the United States, Japan, India, and South Korea, with additional cases across Europe, Southeast Asia, and the Middle East. Targeting focused primarily on web applications and operating systems, reflecting adaptable intrusion methods.
Underground & Dark Web Chatter (Low): Materials represented 2.44% of industry chatter, ranking 10th. Breach activity remained consistently high, while data leak discussions eased slightly. Ransomware chatter declined before a modest rebound, remaining secondary to breach-focused activity. Notably, web exploit chatter rose steadily, indicating increased probing of supplier portals and externally exposed industrial systems. Hacktivism and claimed hacks remained limited and inconsistent.
Vulnerabilities (Low): The sector accounted for 1.55% of industry-linked CVEs, ranking 13th. However, RCE disclosures rose in the latest period, alongside increasing memory-related findings – trends consistent with deeper scrutiny of industrial control systems and embedded components. Injection and DoS issues showed slight upticks, while privilege escalation findings declined.
Ransomware (High): The Materials Industry ranked 7th with 156 victims, nearly flat quarter-over-quarter numbers of victims, though its overall share dipped slightly. Despite moderate absolute volume, risk remains elevated given the sector’s smaller population and recent geographic diversification away from the U.S. Activity stayed elevated for three consecutive months, with February rebounding after a brief January dip. Nearly half of active ransomware groups (49%) targeted the sector. Qilin led in volume (29 victims), though sector focus was moderate. TheGentlemen and Safepay showed stronger proportional targeting, while LockBit5 (15% sector share) temporarily re-emerged before operational disruption. Victims spanned 42 countries, with notable increases in Brazil, Germany, Turkey, and Mexico, while the U.S., Canada, France, and Japan declined – indicating geographic redistribution rather than contraction.