
The CYFIRMA Industry Report delivers original cybersecurity insights and telemetry-driven statistics of global industries, covering one sector each week for a quarter. This report focuses on the manufacturing organizations, presenting key trends and statistics in an engaging infographic format.
Welcome to the CYFIRMA infographic industry report, where we delve into the external threat landscape of the manufacturing industry over the past three months. This report provides valuable insights and data-driven statistics, delivering a concise analysis of attack campaigns, phishing telemetry, and ransomware incidents targeting manufacturing organizations.
We aim to present an industry-specific overview in a convenient, engaging, and informative format. Leveraging our cutting-edge platform telemetry and the expertise of our analysts, we bring you actionable intelligence to stay ahead in the cybersecurity landscape.
CYFIRMA delivers pre-emptive cybersecurity, cyber threat intelligence, and external threat landscape management through its platforms, DeCYFIR and DeTCT. These platforms have been purpose-built over many years to continuously collect, correlate, and analyse large volumes of external threat data, combining proprietary intelligence automation with deep, hands-on cyber threat research.
For the purposes of this report, the analysis draws on intelligence generated from CYFIRMA’s platforms. The data referenced has been processed through automated correlation and enrichment mechanisms, informed and validated by human-led research and investigative expertise, and sourced from both structured and unstructured external intelligence channels.
While this report contains data collected and processed by our in-house AI and ML, all charts, statistics, and analyses are done by human CYFIRMA CTI analysts to ensure the highest quality and provide accurate insights.
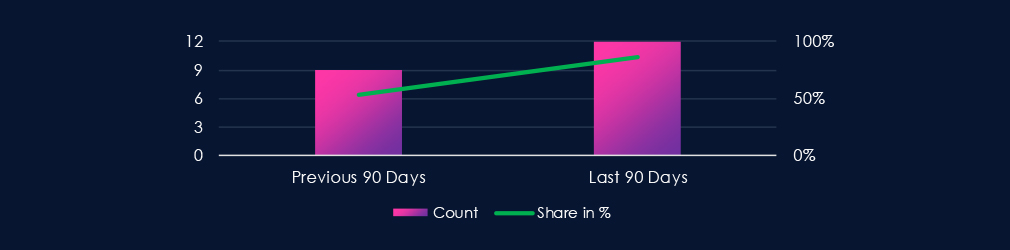
The manufacturing industry featured in 12 out of the 14 observed campaigns, which is a presence in 86% of all campaigns, an increase from the previous period, where manufacturing organizations were present in 9 out of 17 campaigns (53% presence).

2 of the observed campaigns were detected in December, followed by a large number of campaigns observed or updated in January. February so far has seen only 1 campaign in this industry.
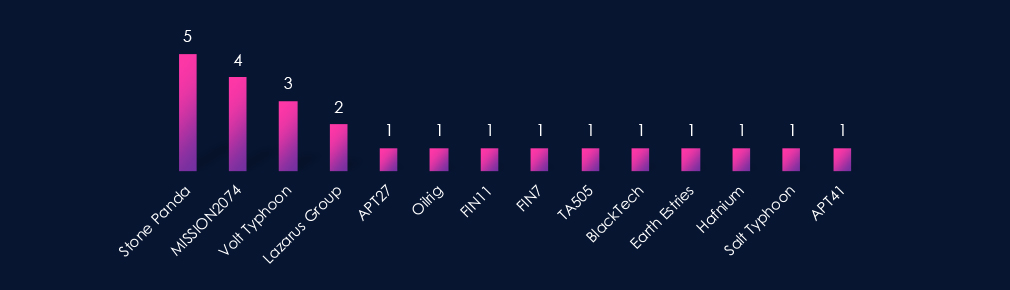
Observed APT campaigns are weighted toward suspected China-linked, state-sponsored actors. Stone Panda, MISSION2074, and Volt Typhoon account for the highest number of observed campaigns, with additional China-aligned representation including APT27, BlackTech, Earth Estries, Hafnium, Salt Typhoon, and APT41.
North Korea is reflected through Lazarus Group, while Iran-linked activity appears via Oilrig. Russian cybercrime syndicates FIN7, FIN11, and TA505 are observed in fewer campaigns, indicating that the overall activity profile is primarily state-sponsored rather than criminally driven.
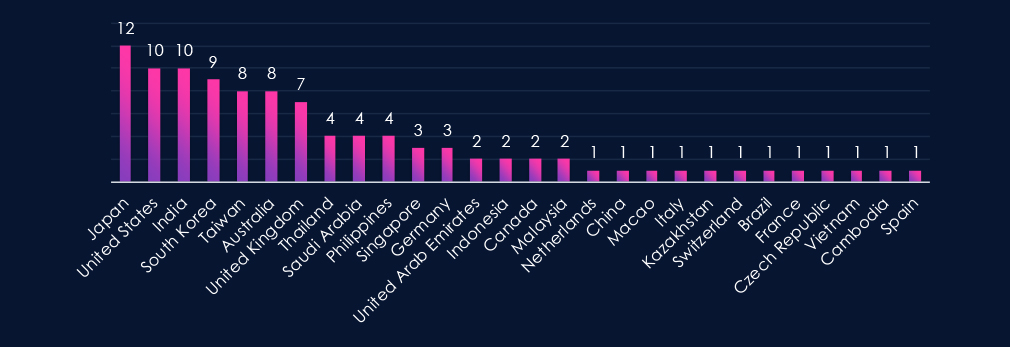
Victims are distributed globally, with the highest concentrations in Asia-Pacific and major Western economies. Japan appears most frequently, followed by the United States and India, with sustained activity also observed in South Korea, Taiwan, Australia, and the United Kingdom.
This geographic distribution aligns with the predominance of suspected China-linked, state-sponsored actors. The prominence of some East and Southeast Asian countries is consistent with the historical targeting of these groups. Repeated activity in the US and Europe reflects the importance of advanced manufacturing and industrial supply chains.
Additional lower-count observations across Southeast Asia, the Middle East, and Europe indicate broad campaign reach rather than narrowly confined regional targeting.
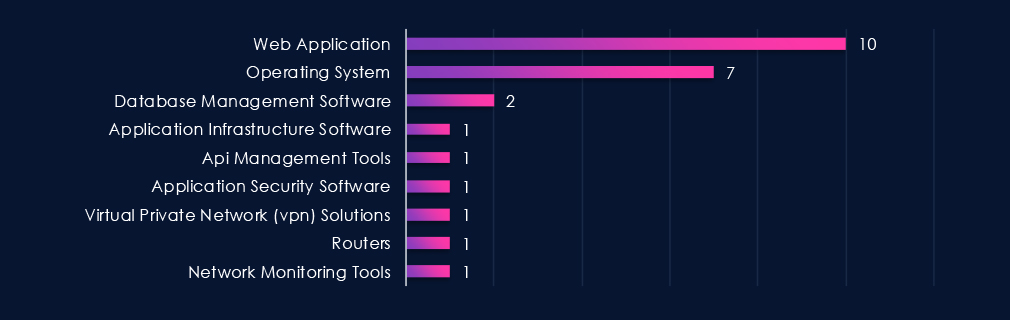
Targeted technologies are concentrated on web applications and operating systems, which account for the majority of identified cases. This pattern is consistent with the tradecraft commonly associated with the predominantly state-sponsored threat actors observed in these campaigns, particularly suspected China-linked groups, which typically prioritize externally exposed services and core enterprise platforms for initial access and follow-on activity.
Other technologies, including database platforms, application infrastructure, API management tools, security software, VPN solutions, routers, and network monitoring tools, appear in fewer campaigns, indicating varied intrusion paths rather than reliance on specialized industrial control systems.
Risk Level Indicator: High

Over the past 90 days, the manufacturing industry has been significantly impacted by advanced persistent threat (APT) campaigns.
12 out of 14 observed APT campaigns recorded victims in this industry. That is an 86% presence in observed campaigns.
That is an increase from the previous 90-day period, during which 9 out of 17 campaigns targeted this industry, also growing is the overall share from the previous 29%.
Monthly Trends
2 of the campaigns were observed during December, followed by 9 campaigns in very active January. February so far saw only a single campaign with victims in the manufacturing industry.
Key Threat Actors
While multiple threat actors are present, the majority of observed campaigns are attributed to suspected China-linked state-sponsored groups. North Korean, Iranian, and Russian financially motivated actors are associated with fewer campaigns within the observed period.
Geographical Impact
Manufacturing sector victims were identified across multiple regions, with higher concentrations in Asia-Pacific and selected Western countries. Japan, the United States, and India account for the highest observed counts, followed by South Korea, Taiwan, Australia, and the United Kingdom.
Targeted Technologies
Observed targeting is weighted toward web applications and operating systems, with other enterprise and network technologies appearing across fewer campaigns. The distribution suggests flexible intrusion approaches rather than concentration on a specific technology category.
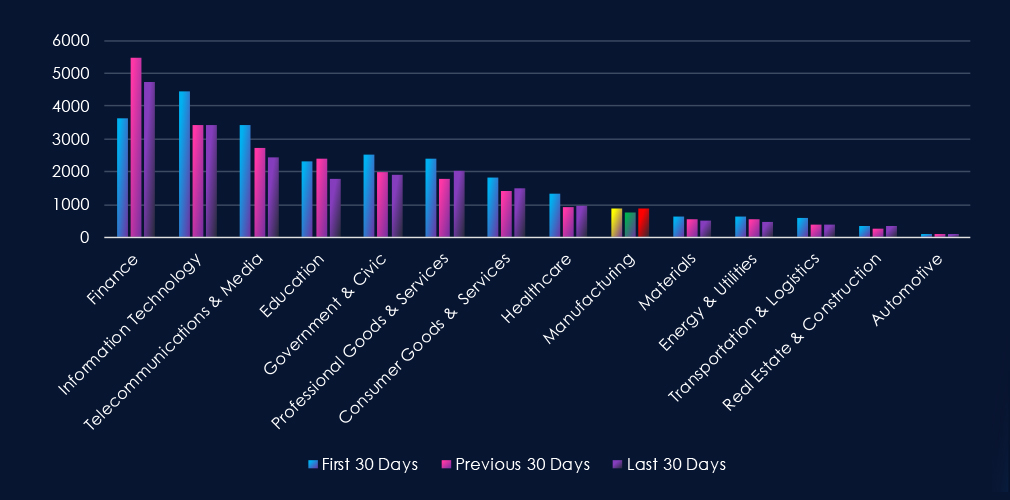
Over the past three months, CYFIRMA’s telemetry has identified 353 mentions of the manufacturing industry out of a total of 69,289 industry-linked mentions. This is from a total of 300k+ posts across various underground and dark web channels and forums.
The manufacturing industry placed 9th out of 14 industries in the last 90 days, with a share of 3.60% of all detected industry-linked chatter.
Below is a breakdown by 30-day periods of all mentions.
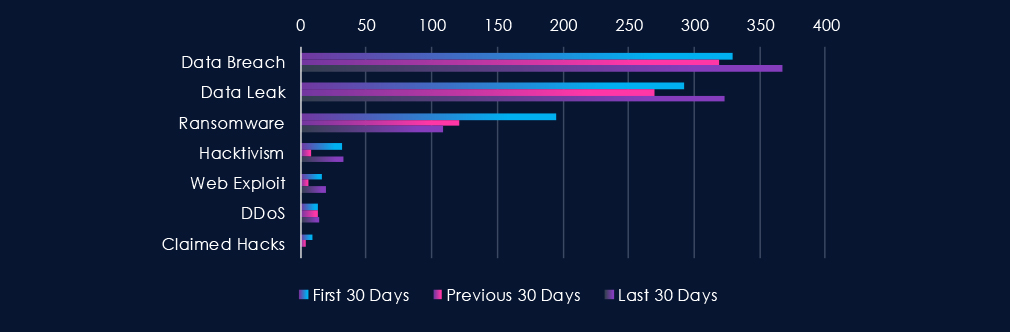
Data Breaches and Data Leaks have been the most talked-about topics in this industry. Both categories have seen sustained activity over the last 90-day period, with an uptick in the last 30 days. Ransomware dropped off significantly in the first 30 days.
Remaining categories, apart from DDoS, were choppy, with Hacktivism and Claimed hacks most prominent.
Risk Level Indicator: Moderate

In total, the manufacturing industry comprise 3.60% of all detected industry underground and dark web chatter in the last 90 days, ranking 9th out of 14 industries.
Below are observed key trends across 90 days:
Data Breach
329 → 319 → 367, High and rising in the latest period. Indicates renewed targeting of manufacturing firms, likely tied to intellectual property theft, supplier compromise, and access to downstream industrial partners.
Data Leak
292 → 270 → 323, Decline followed by a clear rebound. Suggests increased exfiltration and resale of manufacturing data, including design files, operational data, and corporate credentials.
Ransomware
195 → 121 → 109, Downward trend across periods. While still a key threat due to production downtime leverage, ransomware chatter has cooled compared to earlier levels.
Hacktivism
32 → 8 → 33, Sharp drop mid-period followed by a strong resurgence. This pattern may reflect renewed ideological or geopolitical campaigns targeting industrial or defense-linked manufacturers.
Web Exploit
16 → 6 → 19, Decline followed by a notable increase. Suggests renewed exploitation attempts against manufacturing web assets, portals, or exposed industrial management interfaces.
DDoS
13 → 13 → 14, Stable and moderate. Indicates consistent, though not escalating, disruption-focused activity.
Claimed Hacks
9 → 4 → 0, Steady decline to none in the latest period. Fewer public claims may signal a shift toward quieter monetization models or fewer successful high-profile intrusions.
Over the past three months, CYFIRMA’s telemetry has identified 25 mentions of the manufacturing industry out of a total of 2,521 industry mentions. This is from over 10k CVEs reported and updated in the last 90 days.
The manufacturing industry ranked 11th out of 14 industries in the last 90 days, with a share of 2.78% of all detected industry-linked vulnerabilities.
Below is a breakdown by 30-day periods of all mentions.
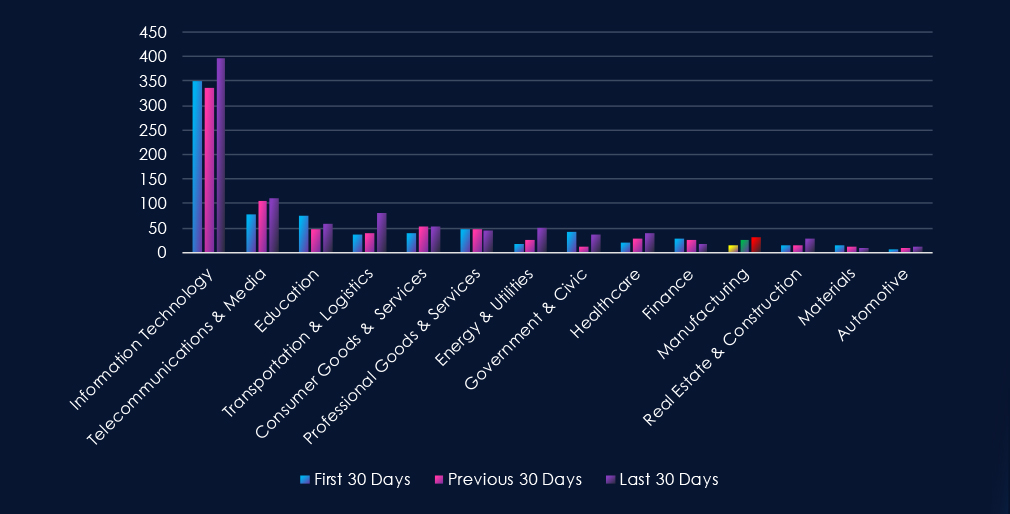
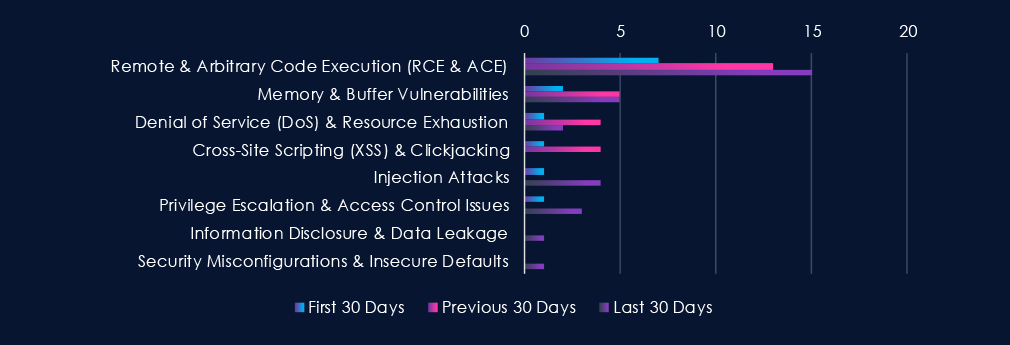
CVEs are led by Remote & Arbitrary Code Execution vulnerabilities, which increase steadily across the three 30-day periods. Memory & Buffer-related issues remain consistently present, while Injection and Privilege Escalation vulnerabilities show increased activity in the most recent period. Denial-of-service and XSS issues fluctuate at lower levels, and Information Disclosure and Security Misconfiguration weaknesses appear sporadically.
Risk Level Indicator: Low

In total, the manufacturing industry comprise of 2.78% of all detected industry-linked vulnerabilities in the last 90 days, ranking 11th out of 14 industries. Below are observed key trends across 90 days:
Remote & Arbitrary Code Execution (RCE & ACE)
7 → 13 → 15, Clear upward trend across all periods. RCE disclosures are increasing, indicating sustained researcher focus on high-impact flaws in industrial control systems, manufacturing execution systems (MES), and embedded production technologies.
Memory & Buffer Vulnerabilities
2 → 5 → 5, Rising and remaining elevated. Suggests continued identification of lower-level memory safety issues, often associated with legacy OT components and embedded industrial software.
Denial of Service (DoS) & Resource Exhaustion
1 → 4 → 2, Moderate mid-period increase followed by partial decline. Availability-related vulnerabilities are present but not consistently escalating.
Cross-Site Scripting (XSS) & Clickjacking
1 → 4 → 0, Spike in the middle period followed by no recent disclosures. Indicates a temporary wave of findings affecting web-based dashboards or plant management interfaces.
Injection Attacks
1 → 0 → 4, Low early activity with a noticeable recent increase. Points to renewed discovery of input validation weaknesses in manufacturing portals and integrated supply-chain systems.
Privilege Escalation & Access Control Issues
1 → 0 → 3, Emerging trend in the latest period. Suggests growing identification of authentication and role management weaknesses within industrial and operational software stacks.
Information Disclosure & Data Leakage
0 → 0 → 1, Newly appearing in the most recent period. Indicates isolated exposure-related findings, potentially involving configuration data or internal system information.
Security Misconfigurations & Insecure Defaults
0 → 0 → 1, Minimal but present. Reflects occasional findings related to unsafe default settings or deployment configurations in manufacturing environments.
In the past 90 days, CYFIRMA has identified 267 verified ransomware victims in the manufacturing industry. This accounts for 12.71% of all 2,100 ransomware victims during the same period, placing the manufacturing industry 2nd out of 14 industries.
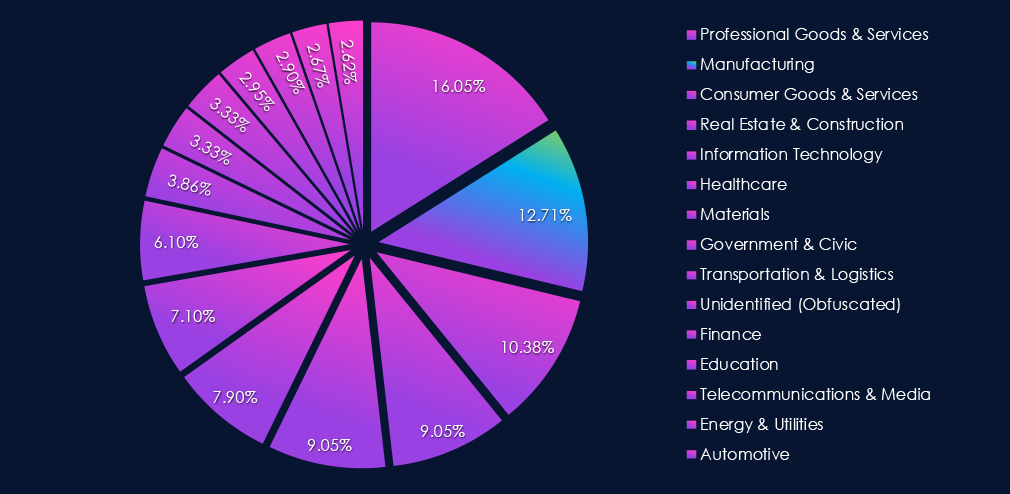
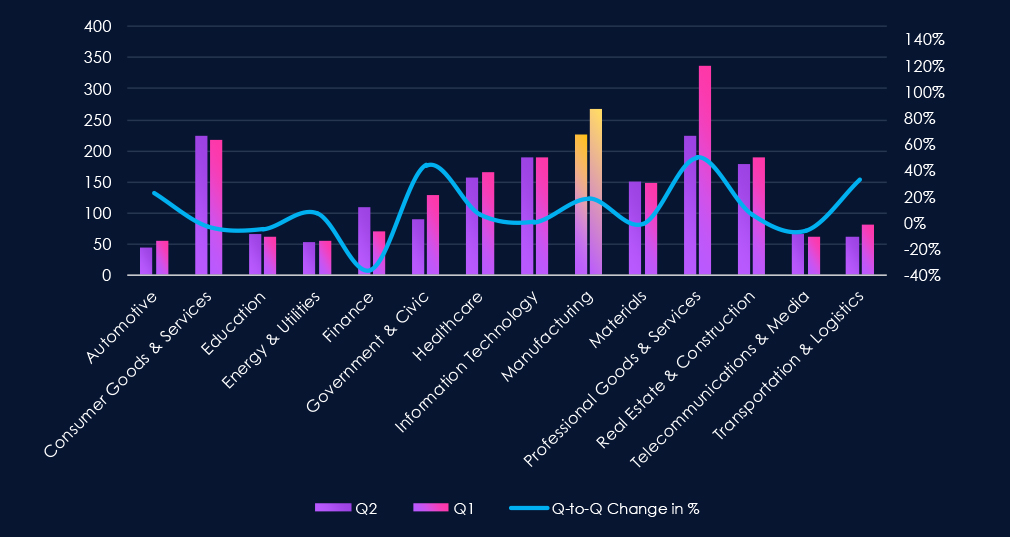
Furthermore, a quarterly comparison shows that interest in manufacturing organizations shows an uptick. There was an increase of 18.1% from 226 to 267 victims. The overall share also grew from 11.99% to 12.71% of all victims.
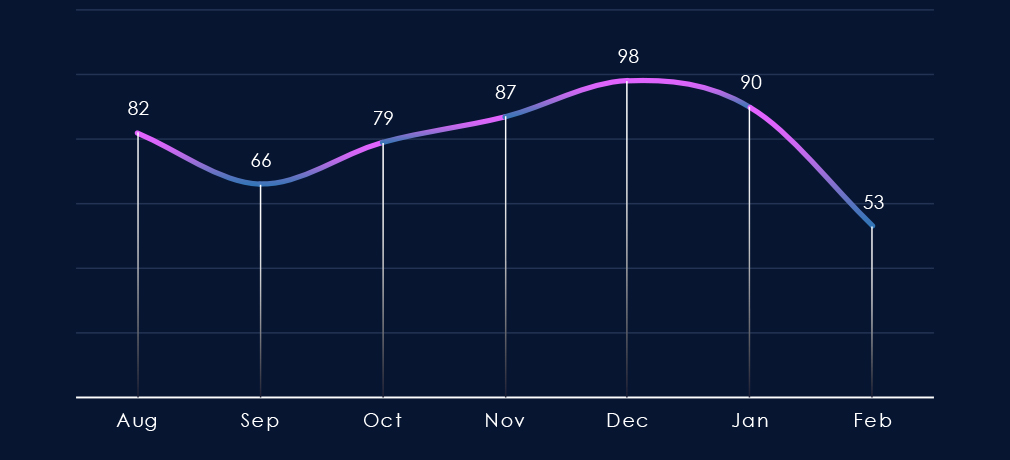
The monthly trendline shows us gradual growth since September towards a 180-day peak in December. Since the peak, we can see a mild drop off, and February so far looks like a significant slowdown in activity.
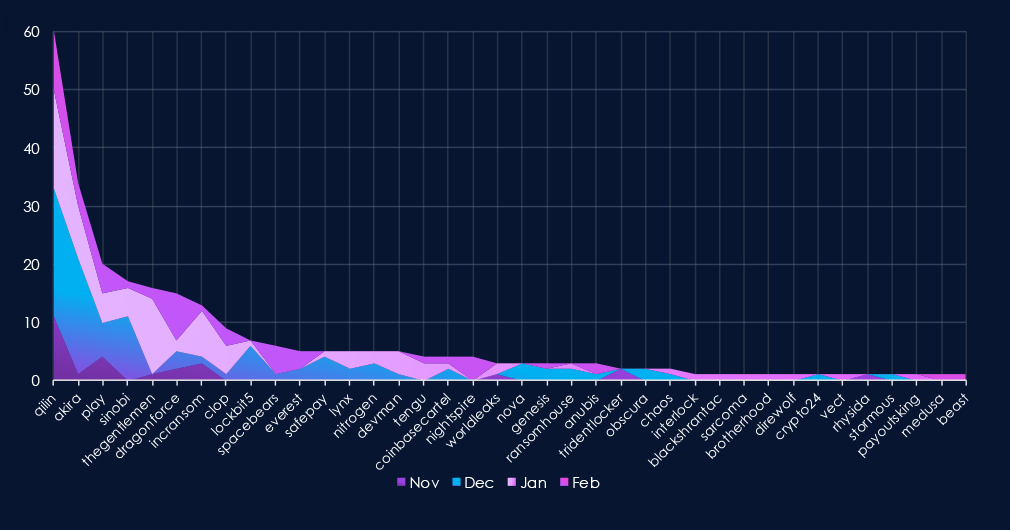
A breakdown of monthly activity per gang reveals which gangs were most active each month. For instance, the most active group, Qilin, recorded victims every month.
On the other hand, groups like Thegentlemen, Cl0p, and Tengu recorded victims mostly only in January. LockBit5 appeared in December, but due to a leaked db, was shut down again.
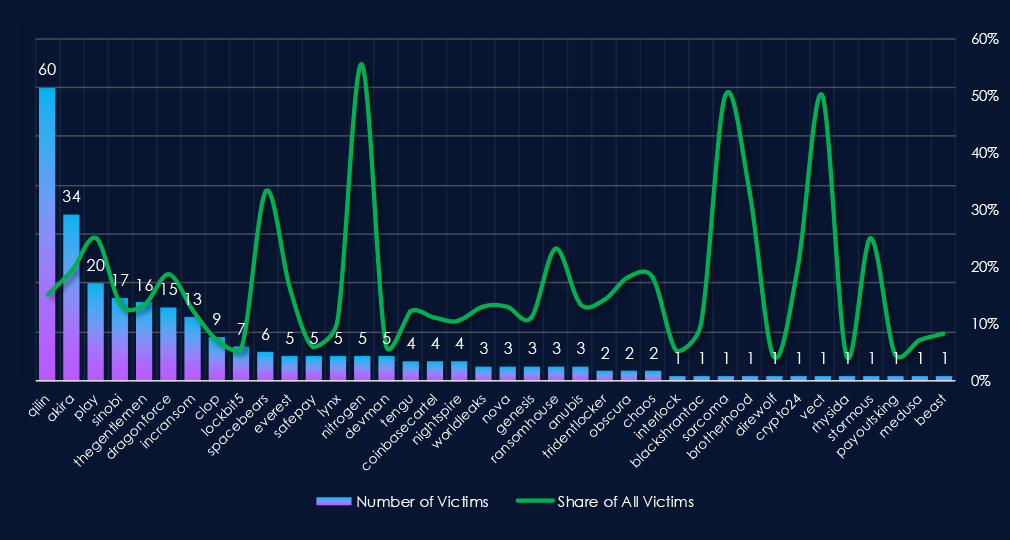
Out of the 66 gangs, 38 recorded victims in the manufacturing industry in the last 90 days, representing a 58% participation.
Qilin had the highest number of victims and 15% share out of all their 398 victims in the manufacturing industry.
Nitrogen(56%), Spacebears(33%), and Play(25%) showed the highest focus on this industry out of gangs with more than one victim.
Overall, manufacturing is a very frequent target (< 10%) for most gangs and their affiliates.
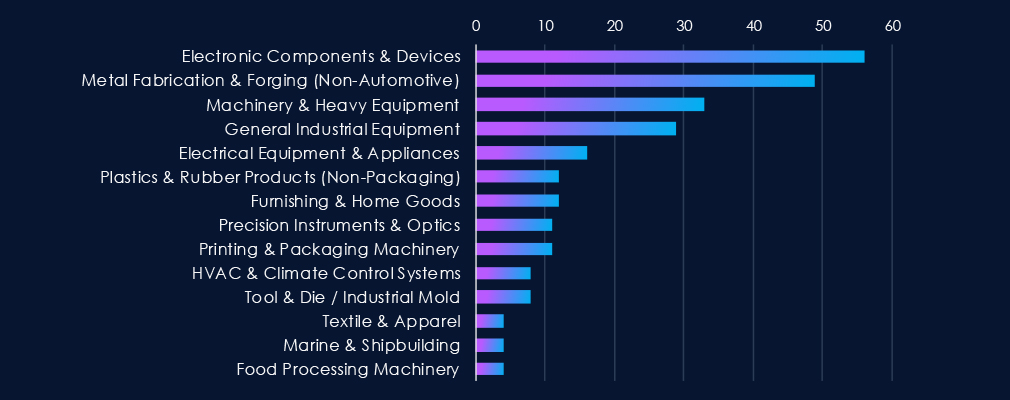
Electronics components and devices were the most frequent victims in manufacturing. Followed by Metal Fabrication & Forging.
In more distant third and fourth place are Machinery, Heavy Equipment, and General Industrial Equipment.
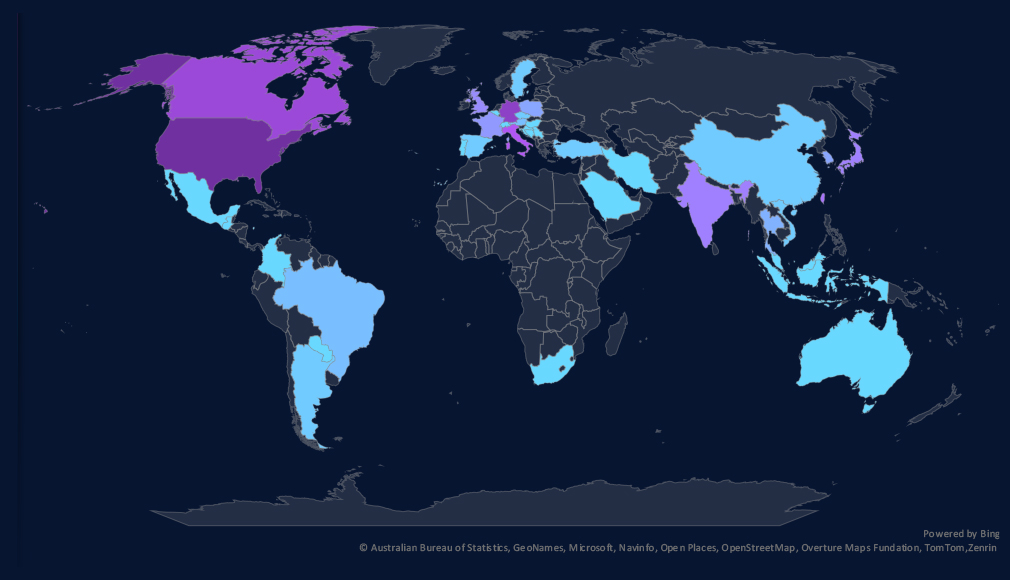
The geographic distribution heatmap underscores the widespread impact of ransomware, highlighting the countries where victims in this industry have been recorded.
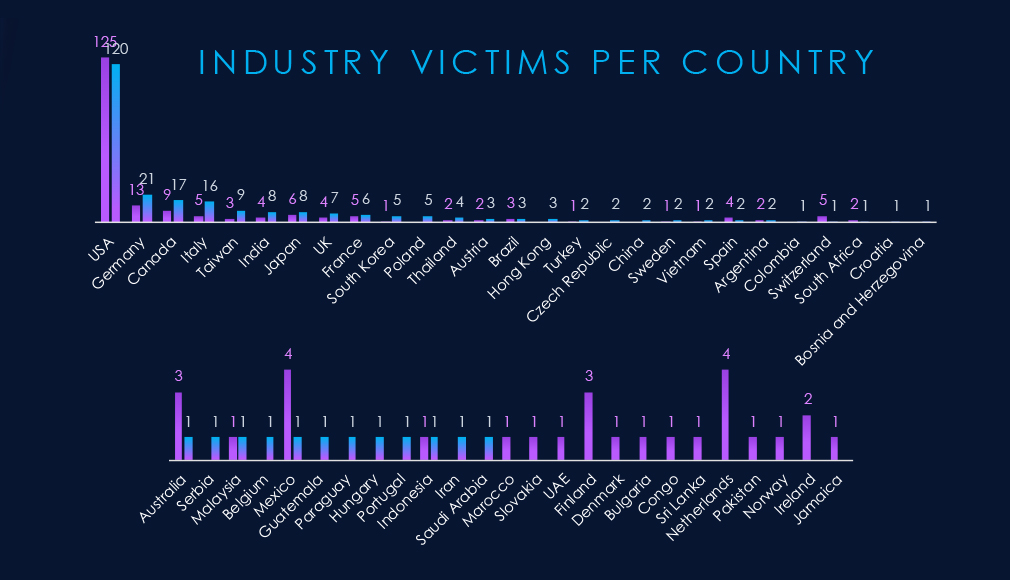
Manufacturing victimology shows sustained interest in the USA. Germany, Canada, Italy, and Taiwan recorded the highest elevations.
Switzerland, Mexico, the Netherlands, and Finland, on the other hand, have the largest declines.
In the last 90 days, 39 countries recorded manufacturing industry victims. increase from 37 countries in the previous period.
Risk Level Indicator: High

The manufacturing industry ranked 2nd out of 14 monitored industries, recording 267 victims in the last 90 days, an increase of 18.1% from 226 victims in the previous 90-day period.
Overall share also increased from 11.99% to 12.71% of all ransomware victims.
Monthly Activity Trends
The number of victims kept growing from the September low towards the December peak. January showed the first slowdown since September, and February so far is poised for a sharper drop off in victims in manufacturing.
Ransomware Gangs
A total of 38 out of 66 active ransomware groups targeted this industry in the past 90 days. That is a 58% participation.
Qilin: Continuously the most active gang with 398 victims across industries in the last 90 days. 60 were from the manufacturing industry (15%).
Nitrogen: Highest share (56%) among gangs with more than one victim, suggesting a specific focus on this industry.
Spacebears, Play: Recording 33% and 25% of their victims from the manufacturing sector, implying it is one of their industries of interest.
Geographic Distribution
The geographic distribution of ransomware victims is relatively high, and spread across 39 countries. Increase from 37 in the previous period.
Germany, Canada, Italy, and Taiwan saw the highest elevations. Switzerland, Mexico, the Netherlands, and Finland, on the other hand, experienced the sharpest decline.
For a comprehensive, up-to-date global ransomware tracking report, please refer to our new monthly “Tracking Ransomware” series here.
APT Campaigns (High): Manufacturing saw a sharp escalation in APT exposure, with 12 of 14 campaigns (86%) impacting the sector, up significantly from the prior period. Activity surged in January (9 campaigns) following limited December activity, while February has slowed. Most campaigns are attributed to China-linked state-sponsored groups, with additional but more limited activity from North Korean, Iranian, and Russian financially motivated actors. Victims were concentrated in Japan, the United States, and India, followed by South Korea, Taiwan, Australia, and the UK. Targeting centered on web applications and operating systems, reflecting flexible intrusion methods rather than dependence on sector-specific technologies.
Underground & Dark Web Chatter (Moderate): Manufacturing accounted for 3.60% of industry chatter, ranking 9th. Breach and leak discussions rebounded in the latest period, indicating renewed interest in intellectual property, supplier access, and downstream industrial compromise. Ransomware chatter declined steadily, though operational downtime remains a strong leverage point. Hacktivism resurfaced sharply after a lull, while web exploit activity also increased, suggesting renewed probing of exposed industrial portals and management systems. Publicly claimed hacks fell to zero, implying quieter monetization tactics.
Vulnerabilities (Low): The sector represented 2.78% of industry-linked CVEs, ranking 11th. However, RCE disclosures rose consistently, highlighting growing attention to high-impact flaws in ICS, MES, and embedded systems. Memory issues remained elevated, consistent with legacy OT environments. Injection and privilege escalation findings increased in the latest period, suggesting deeper scrutiny of authentication and input validation weaknesses. Other categories remained sporadic.
Ransomware (High): Manufacturing ranked 2nd overall with 267 victims (+18%), raising its share to 12.71% of all ransomware cases. Activity climbed from September through a December peak before slowing in January and potentially further in February. Participation was broad, with 58% of active gangs targeting the sector. Qilin led in volume (60 victims), though its focus remains diversified. Nitrogen (56% sector share) demonstrated the strongest specialization, while Spacebears (33%) and Play (25%) also showed elevated concentration. Victims spanned 39 countries, with notable increases in Germany, Canada, Italy, and Taiwan, underscoring manufacturing’s continued exposure across global supply chains.