
The CYFIRMA Industry Report delivers original cybersecurity insights and telemetry-driven statistics of global industries, covering one sector each week for a quarter. This report focuses on the automotive organizations, presenting key trends and statistics in an engaging infographic format.
Welcome to the CYFIRMA infographic industry report, where we delve into the external threat landscape of the automotive industry over the past three months. This report provides valuable insights and data-driven statistics, delivering a concise analysis of attack campaigns, phishing telemetry, and ransomware incidents targeting the automotive organizations.
We aim to present an industry-specific overview in a convenient, engaging, and informative format. Leveraging our cutting-edge platform telemetry and the expertise of our analysts, we bring you actionable intelligence to stay ahead in the cybersecurity landscape.
CYFIRMA delivers pre-emptive cybersecurity, cyber threat intelligence, and external threat landscape management through its platforms, DeCYFIR and DeTCT. These platforms have been purpose-built over many years to continuously collect, correlate, and analyse large volumes of external threat data, combining proprietary intelligence automation with deep, hands-on cyber threat research.
For the purposes of this report, the analysis draws on intelligence generated from CYFIRMA’s platforms. The data referenced has been processed through automated correlation and enrichment mechanisms, informed and validated by human-led research and investigative expertise, and sourced from both structured and unstructured external intelligence channels.
While this report contains data collected and processed by our in-house AI and ML, all charts, statistics, and analyses are done by human CYFIRMA CTI analysts to ensure the highest quality and provide accurate insights.
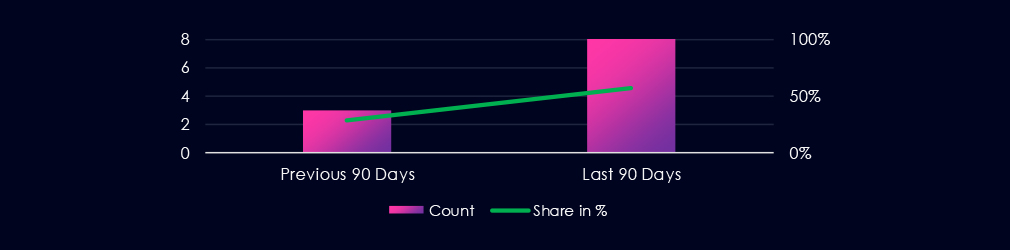
The automotive industry featured in 8 out of the 14 observed campaigns, which is a presence in 57% of all campaigns. Decline from the previous period, where automotive organizations were present in 4 out of 14 campaigns (29% presence).

2 out of 8 observed campaigns were detected in December, and the rest during January. February so far has not seen a new campaign with automotive victims.
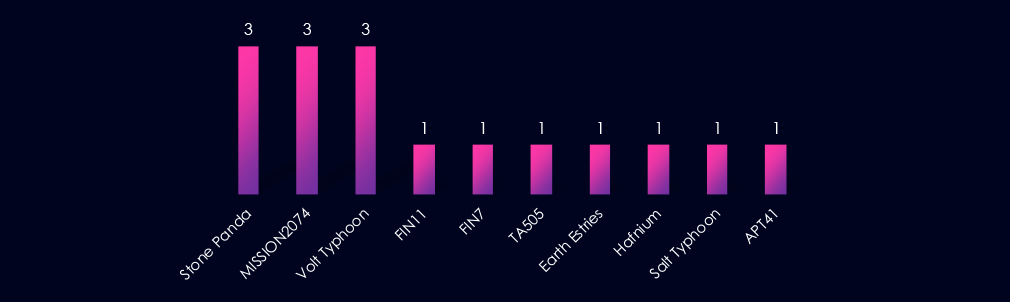
Observed APT campaigns involving automotive sector victims are dominated by suspected China-linked, state-sponsored actors, including Stone Panda, MISSION2074, and Volt Typhoon, each appearing multiple times. Additional China-aligned representation includes Earth Estries, Hafnium, Salt Typhoon, and APT41.
Financially motivated groups, including FIN7, FIN11, and TA505, appear less frequently, indicating that observed activity is predominantly state-sponsored operations rather than criminal monetization campaigns.
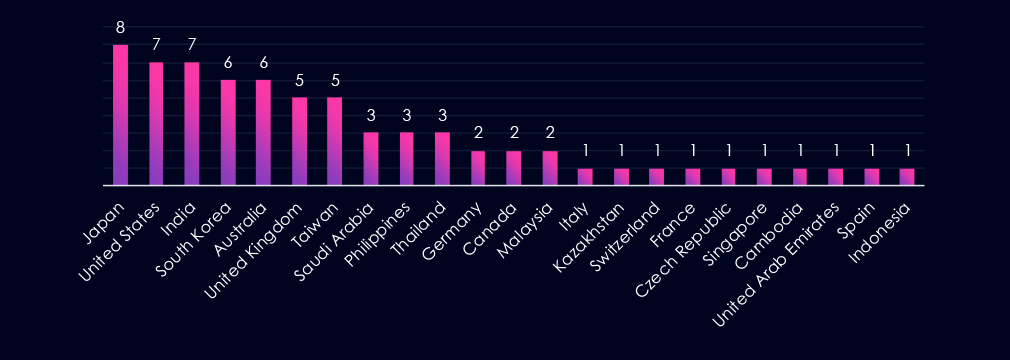
Victim organizations identified in observed automotive sector campaigns were distributed globally, with the highest concentrations in Asia-Pacific and major Western economies. Japan appears most frequently, followed by the United States and India, with sustained activity also observed in South Korea, Australia, the United Kingdom, and Taiwan.
This geographic distribution aligns both with known automotive economies and the dominance of suspected China-linked, state-sponsored actors. The prominence of East and Southeast Asian countries is consistent with historical targeting patterns associated with these groups, while repeated activity in the United States and Europe reflects the strategic importance of the automotive industry within global manufacturing and supply chains.
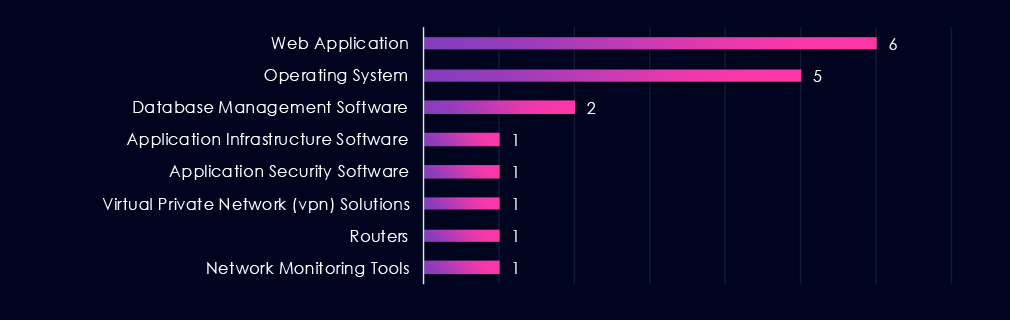
Targeted technologies in observed automotive sector campaigns are concentrated on web applications and operating systems, which together account for the majority of identified cases. This focus aligns with the externally exposed services and core enterprise platforms for initial access and follow-on activity.
Other technologies, including database platforms, application infrastructure, security software, VPN solutions, routers, and network monitoring tools, appear infrequently, indicating varied intrusion paths rather than reliance on sector-specific automotive systems.
Risk Level Indicator: Moderate

Over the past 90 days, the automotive industry has been significantly impacted by advanced persistent threat (APT) campaigns.
8 out of 14 observed APT campaigns recorded victims in this industry. That is 57% presence in observed campaigns.
That is an increase from the previous 90-day period, during which 4 out of 14 campaigns targeted this industry, also growing is the overall share from the previous 29%.
Monthly Trends
2 of the campaigns were observed during December, followed by 6 campaigns in very active January. February so far has not observed a new campaign with automotive victims.
Key Threat Actors
The distribution of suspected threat actors in automotive-related APT campaigns is heavily skewed toward state-sponsored groups, particularly China-linked. Financially motivated actors from Russian cybercrime syndicates are also present.
Geographical Impact
Victims were identified across multiple regions, with higher concentrations in Asia-Pacific and selected Western countries. Japan, the United States, and India account for the highest observed counts, followed by South Korea, Australia, the United Kingdom, and Taiwan.
Targeted Technologies
Observed targeting is focused on web applications and operating systems, with other enterprise and network technologies appearing less frequently.
The distribution shows flexible intrusion approaches when externally facing web applications are not available.
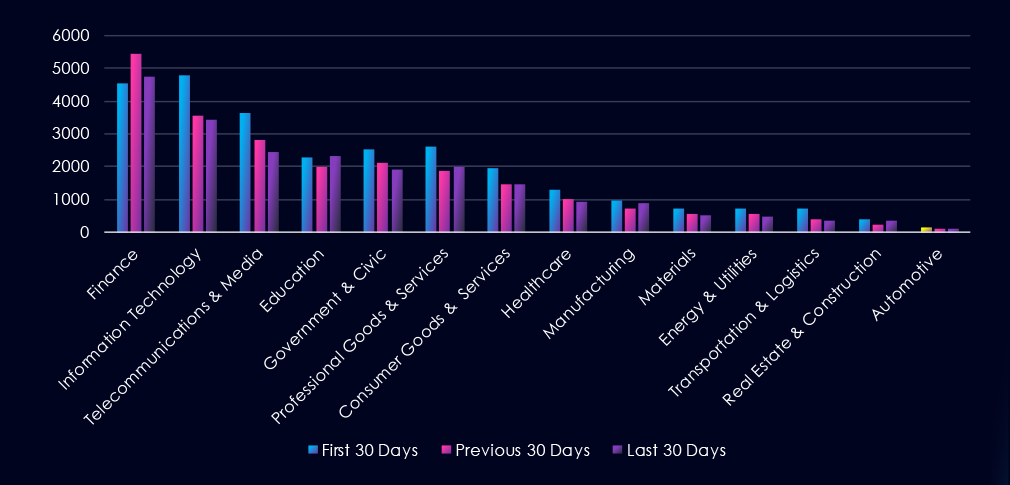
Over the past three months, CYFIRMA’s telemetry has identified 353 mentions of the automotive industry out of a total of 72,012 industry-linked mentions. This is from a total of 300k+ posts across various underground and dark web channels and forums.
The automotive industry placed last out of 14 industries in the last 90 days, with a share of 0.49% of all detected industry-linked chatter.
Below is a breakdown by 30-day periods of all mentions.
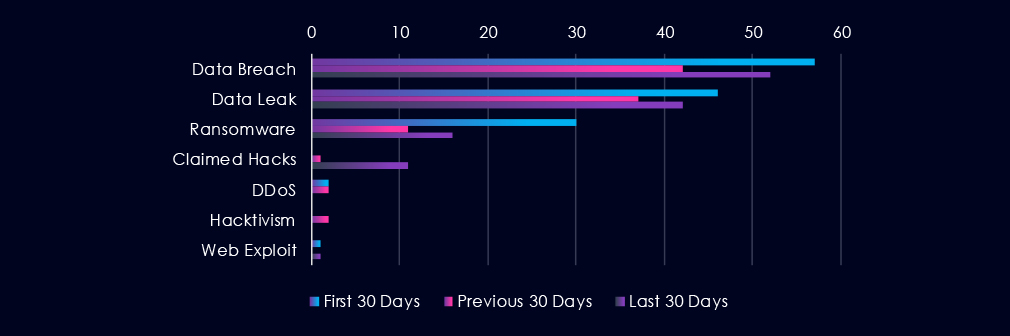
Data Breaches and Data Leaks have been the most talked-about topics in this industry. Both categories have seen a minor decline in discussions over the last 90-day period, with a dip in the previous 30 days.
The chatter about Ransomware has significantly declined over the past 90 days, and claimed hacks jumped in the last 30 days.
Risk Level Indicator: Low

In total, the automotive industry comprise 0.49% of all detected industry underground and dark web chatter in the last 90 days, ranking last out of 14 industries.
Below are the observed key trends across 90 days:
Data Breach
57 → 42 → 52, Moderate and relatively stable with a slight rebound in the latest period. Automotive firms continue to face targeted compromise attempts, though activity levels are far lower than in finance or IT.
Data Leak
46 → 37 → 42, Minor fluctuations with no clear upward trajectory. Indicates continued but limited circulation of automotive-related data, possibly tied to supplier ecosystems or internal corporate systems.
Ransomware
30 → 11 → 16, Sharp drop followed by a partial recovery. Suggests ransomware operators have deprioritized automotive compared to other industries, though opportunistic targeting persists.
Claimed Hacks
0 → 1 → 11, Significant spike in the most recent period. This jump may reflect a short wave of publicly advertised intrusions or access sales involving automotive suppliers or dealerships.
DDoS
2 → 2 → 0, Low and now absent. Indicates little current focus on service disruption in this sector.
Hacktivism
0 → 2 → 0, Brief mid-period activity but no sustained ideological targeting.
Web Exploit
1 → 0 → 1, Very limited and sporadic. Web-based exploitation does not appear to be a primary attack vector at this time.
Over the past three months, CYFIRMA’s telemetry has identified 25 mentions of the automotive industry out of a total of 2,497 industry mentions. This is from over 10k CVEs reported and updated in the last 90 days.
The automotive industry ranked last out of 14 industries in the last 90 days, with a share of 1.00% of all detected industry-linked vulnerabilities.
Below is a breakdown by 30-day periods of all mentions.
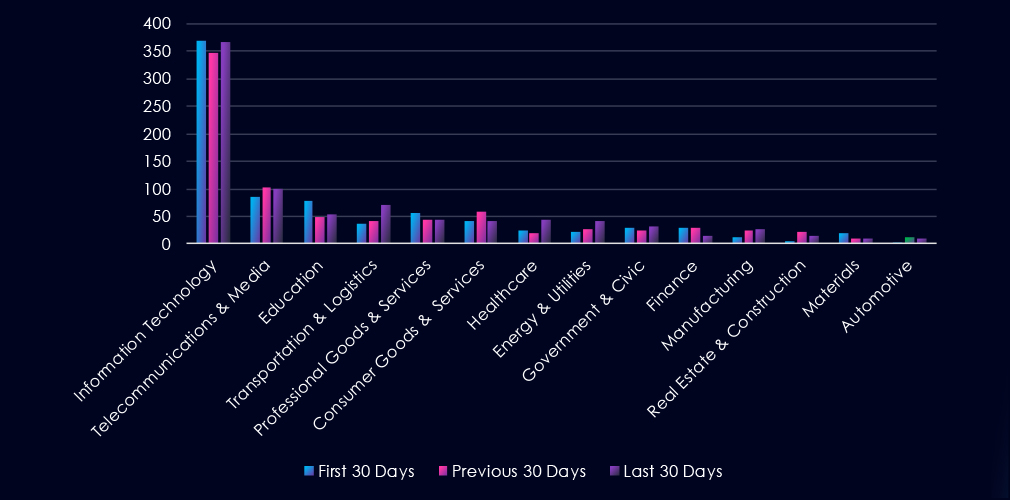
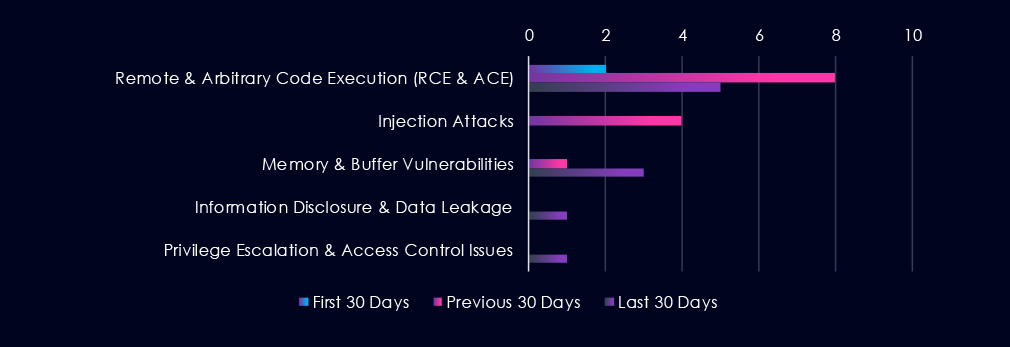
Remote & Arbitrary Code Execution (RCE & ACE) are the most frequent vulnerabilities with CVE reports across 90 days. Injection Attacks follow in second place, with a large spike in the previous 30 days. Memory & Buffer Vulnerabilities are in third place, with CVE reports growing over the last 60 days.
Risk Level Indicator: Low

In total, the automotive industry comprise of 1.00% of all detected industry-linked vulnerabilities in the last 90 days, ranking last out of 14 industries.
Below are the observed key trends across 90 days:
Remote & Arbitrary Code Execution (RCE & ACE)
2 → 8 → 5, Spike in the middle period followed by moderation. RCE remains the most significant vulnerability class in automotive technologies, particularly relevant to telematics systems, backend fleet platforms, and connected vehicle services.
Injection Attacks
0 → 4 → 0, Isolated mid-period wave with no recent disclosures. Suggests a short-term research focus on automotive web interfaces or APIs rather than a sustained vulnerability pattern.
Memory & Buffer Vulnerabilities
0 → 1 → 3, Gradual increase in the latest period. Indicates growing identification of lower-level flaws, likely within embedded systems, firmware, or legacy components common in automotive environments.
Information Disclosure & Data Leakage
0 → 0 → 1, Newly appearing in the latest period. Points to isolated findings involving exposure of sensitive data, potentially within connected vehicle or dealership systems.
Privilege Escalation & Access Control Issues
0 → 0 → 1, Emerging in the most recent period. Suggests recent discovery of authentication or permission weaknesses in automotive software platforms.
In the past 90 days, CYFIRMA has identified 59 verified ransomware victims in the automotive industry. This accounts for 2.72% of all 2,169 ransomware victims during the same period, placing the automotive industry 14th out of 14 industries.
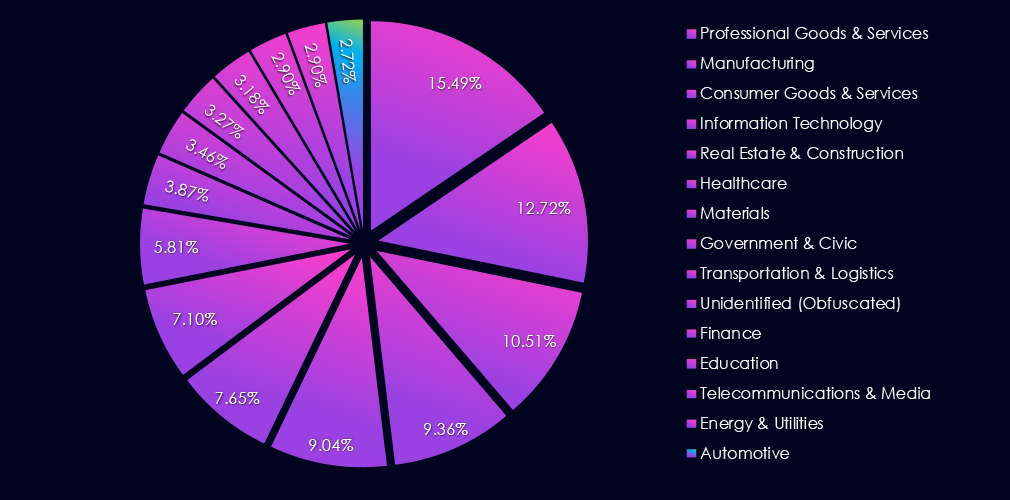
Furthermore, a quarterly comparison shows that interest in automotive organizations shows a significant uptick. There was an increase of 55.3% from 38 to 59 victims. The overall share also grew from 2.10% to 2.72% of all victims.
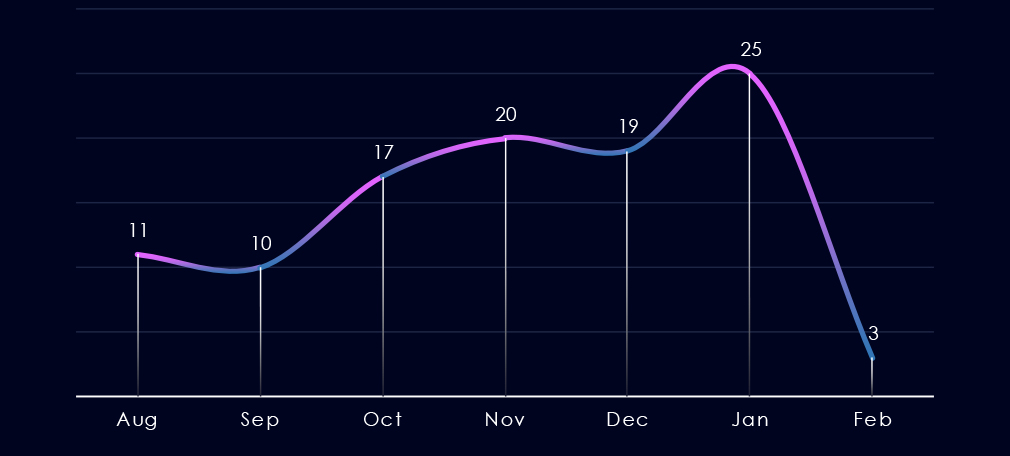
The monthly trendline shows us gradual growth since September towards a 180-day peak in January. The first half of February so far shows a dramatic slowdown from the January peak.
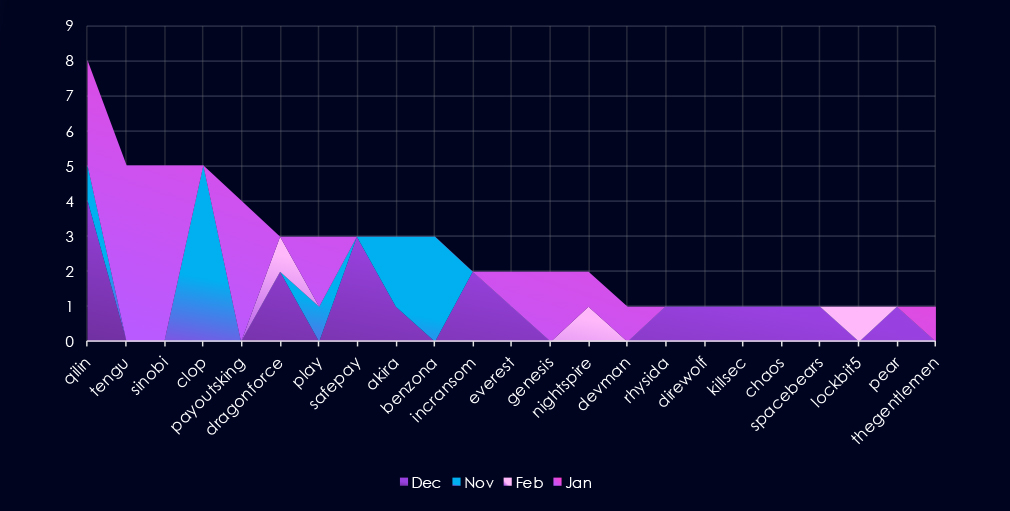
A breakdown of monthly activity per gang reveals which gangs were most active each month. For instance, Qilin recorded most victims in December and January.
Furthermore, in January, we can see Tengu, Sinobi, Payoutsking, and Genesis recording large amounts of victims collectively.
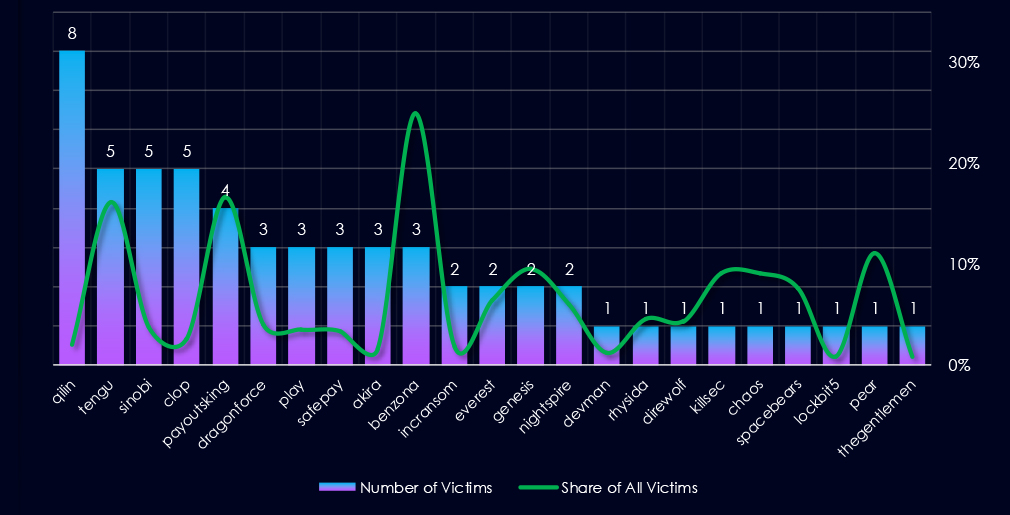
Out of the 66 gangs, 23 recorded victims in the automotive industry in the last 90 days, representing a 35% participation.
Qilin had the highest number of victims, however, a low share of 2.0% out of all their 400 victims. That means their numbers are opportunistic targeting and the large scale of their activity.
Benzona(25%) and Tengu with Payoutsking (~16%) showed higher focus on this industry.
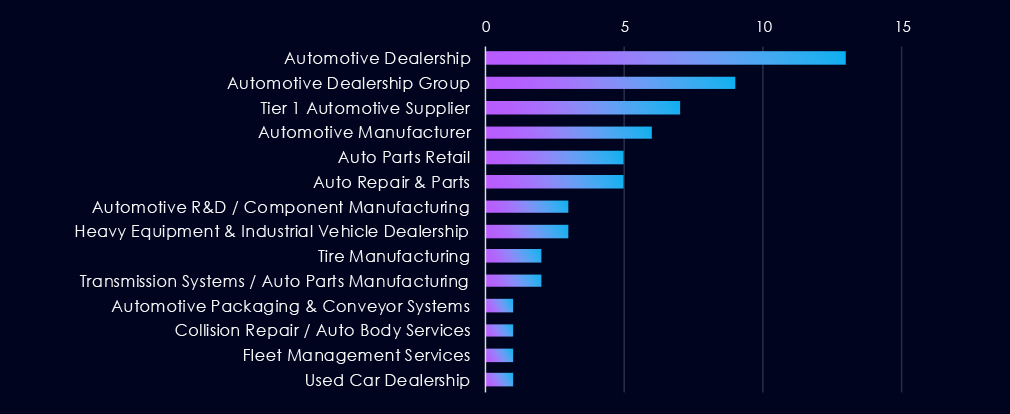
Combined dealership categories are the most frequent victims of ransomware, appearing to bear the brunt of the recent elevated numbers. Further, combined manufacturing and auto parts are the second and third most frequent victims, respectively.
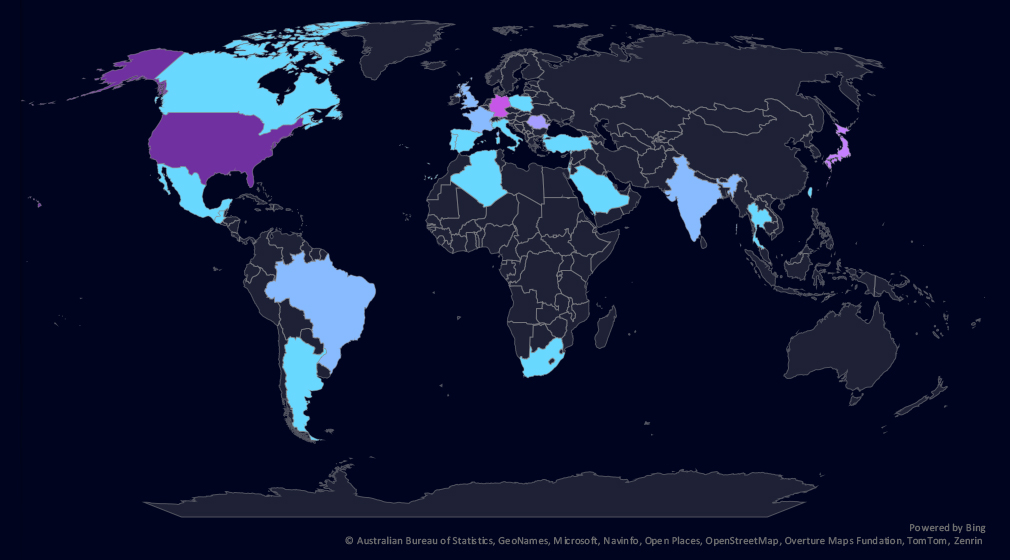
The geographic distribution heatmap underscores the widespread impact of ransomware, highlighting the countries where victims in this industry have been recorded.
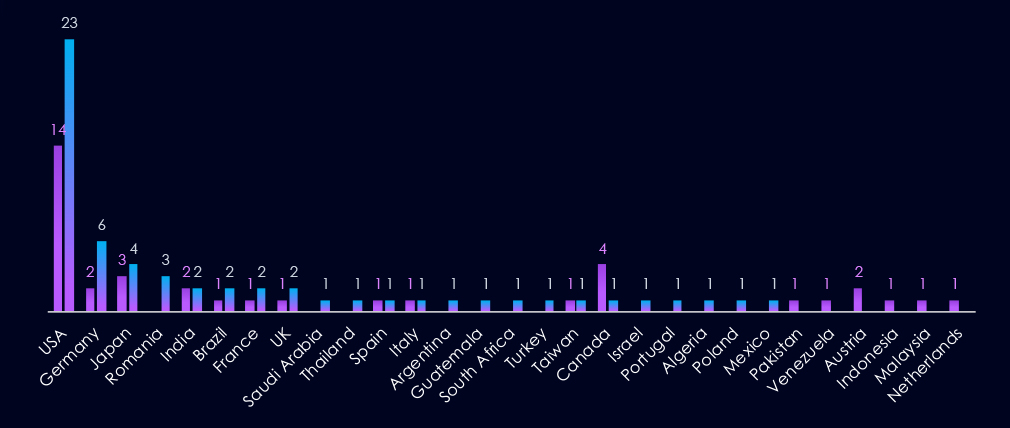
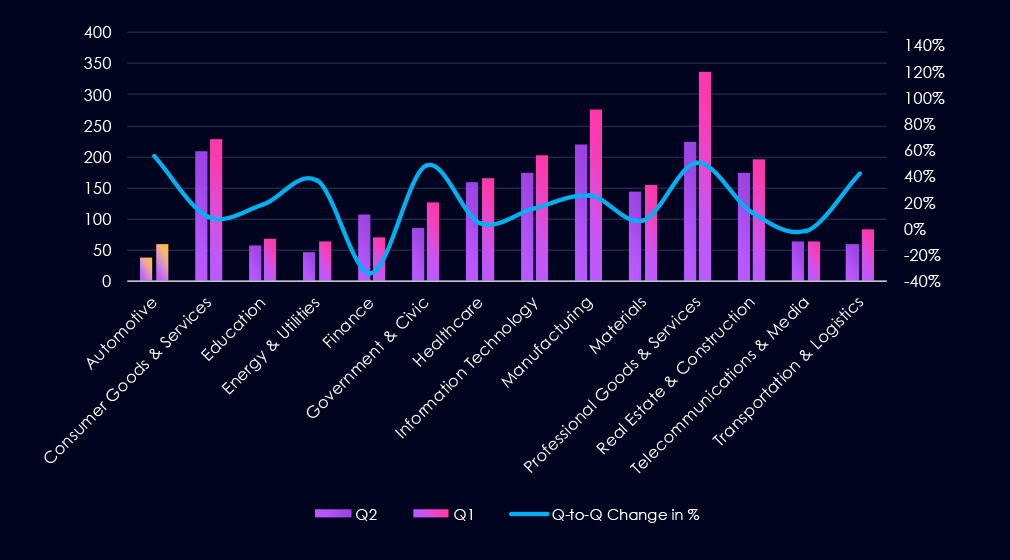
The chart shows quarter-to-quarter changes in targeted countries. Data is sorted by the last 90 days and compared to the previous 90 days, marked in purple.
Automotive victimology shows major elevation in the USA, Germany, and Romania. Conversely, Canada and Austria recorded the highest declines.
In the last 90 days, 23 countries recorded automotive industry victims. increase from 17 countries in the previous period.
Risk Level Indicator: Moderate

The automotive industry ranked 14th out of 14 monitored industries, recording 59 victims in the last 90 days. Major elevation of 55.3% from 38 victims in the previous 90-day period.
Overall share also increased from 2.10% to 2.72% of all ransomware victims.
Due to recent elevation, this industry warrants a moderate risk ransomware factor.
Monthly Activity Trends
The number of victims kept growing from the September low towards the January spike. February so far appears to be on track for a 180-day low. That can change on a dime, though.
Ransomware Gangs
A total of 23 out of 66 active ransomware groups targeted this industry in the past 90 days – 35% participation:
Qilin: Continuously, the most active gang. However, its focus on this industry is low. Its victim count is high due to the sheer total volumes of its victims.
Benzona: Highest share (25%) among gangs with more than one victim, suggesting a high focus on this industry.
Tengu, Payoutsking: Recording ~16% of their victims from the automotive sector, implying it is one of their industries of interest.
Geographic Distribution
The geographic distribution of ransomware victims is relatively low, and spread across 23 countries. Increase from 17 in the previous period.
The USA, Germany, and Romania saw the highest elevations. Canada and Austria, on the other hand, decline.
For a comprehensive, up-to-date global ransomware tracking report, please refer to our new monthly “Tracking Ransomware” series here.
APT Campaigns (Moderate): Automotive experienced a marked increase in APT exposure, with 8 of 14 campaigns (57%) impacting the sector, up from 29% in the previous period. Activity was concentrated in December and especially January, which accounted for six campaigns, while February has remained quiet so far. Targeting was heavily skewed toward China-linked state-sponsored actors, with additional activity from Russian financially motivated groups. Victims were primarily located in Japan, the United States, and India, followed by South Korea, Australia, the UK, and Taiwan. Campaigns focused mainly on web applications and operating systems, indicating reliance on externally exposed platforms, though intrusion approaches demonstrated flexibility when such assets were unavailable.
Underground & Dark Web Chatter (Low): Automotive ranked last in overall chatter, accounting for just 0.49% of observed activity. Breach and leak discussions remained relatively stable and low compared to other industries. Ransomware chatter declined sharply before a modest rebound, while claimed hacks spiked in the most recent period, possibly reflecting short-lived waves of access sales or supplier compromises. DDoS, hacktivism, and web exploit activity remained minimal.
Vulnerabilities (Low): The sector represented only 1.00% of industry-linked vulnerabilities, again ranking last. RCE disclosures peaked mid-period before moderating, remaining the most significant vulnerability class given the risks to telematics and connected vehicle platforms. Memory-related issues rose in the latest period, suggesting increased scrutiny of embedded and firmware components. Injection and access control findings were isolated and not sustained, indicating limited concentrated research activity.
Ransomware (Moderate): Despite ranking last overall, ransomware victims increased sharply to 59 cases (+55%), raising the sector’s share to 2.72% and warranting a moderate risk rating. Activity built steadily from September through a January spike, though February is currently trending lower. Targeting appears largely opportunistic, with no dominant gang focus. While Qilin recorded the highest number of victims, this reflects overall volume rather than sector specialization. However, Benzona (25% sector share) and groups such as Tengu and Payoutsking (~16%) show comparatively stronger automotive focus. Victims were spread across 23 countries, with the United States, Germany, and Romania seeing the largest increases, while Canada and Austria declined.